
Pertussis infection according to microbiology
Bordetella pertussis whooping cough microbiology
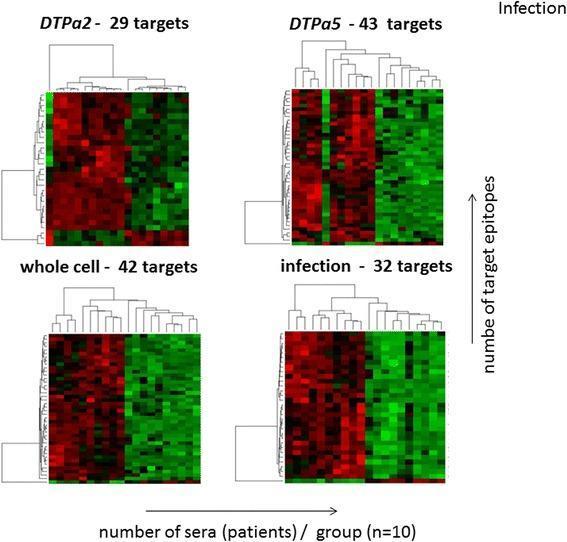
This Comparison Chart displays a matrix of four Prediction Analysis of Microarrays (PAM) heatmaps, comparing antibody recognition of Bordetella pertussis (Bp) epitopes across four study groups: DTPa2 (29 targets), DTPa5 (43 targets), whole cell vaccine (42 targets), and natural infection (32 targets). The visualization represents results from peptide microarray analysis. Each heatmap is organized with hierarchical clustering dendrograms on the top and left axes. The x-axis represents individual patient sera (n=10 per group), and the y-axis represents specific target epitopes. A color-coded scale indicates IgG signal intensity: red represents strong epitope recognition (high fluorescence), while green represents weak or no recognition. The heatmaps demonstrate distinct immunological 'reactome' profiles for each group. For instance, DTPa5 shows a dense cluster of high-intensity recognition (red), while the whole cell and infection groups exhibit more heterogeneous patterns. This data is used to differentiate the humoral immune response induced by various pertussis vaccine formulations compared to natural whooping cough infection.
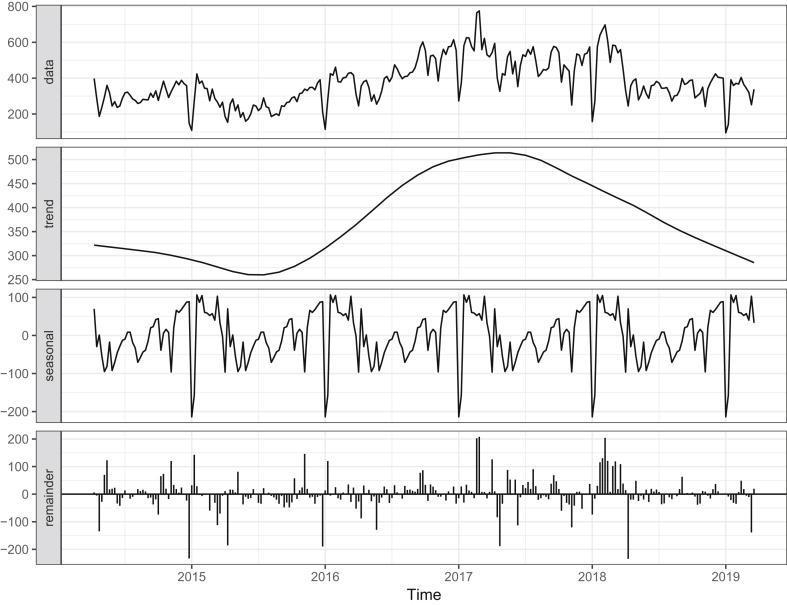
A four-panel stacked line graph illustrating the STL (Seasonal-Trend decomposition using LOESS) time-series analysis of weekly pertussis (whooping cough) cases from 2015 to 2019. The top panel, 'data', shows the raw observed weekly case numbers, fluctuating between approximately 100 and 800 cases. The second panel, 'trend', displays a smoothed non-linear curve indicating an initial decline in 2015, a significant rise throughout 2016 peaking in mid-2017, followed by a steady decline through 2019. The third panel, 'seasonal', highlights a recurring annual oscillatory pattern with distinct peaks in winter months and troughs in spring/summer, demonstrating the disease's seasonal periodicity. The bottom panel, 'remainder', represents the random noise or residuals not captured by trend or seasonality. This epidemiological visualization is used in public health to analyze disease progression, monitor outbreaks, and inform vaccination or triage protocols by distinguishing cyclical patterns from long-term changes in incidence.
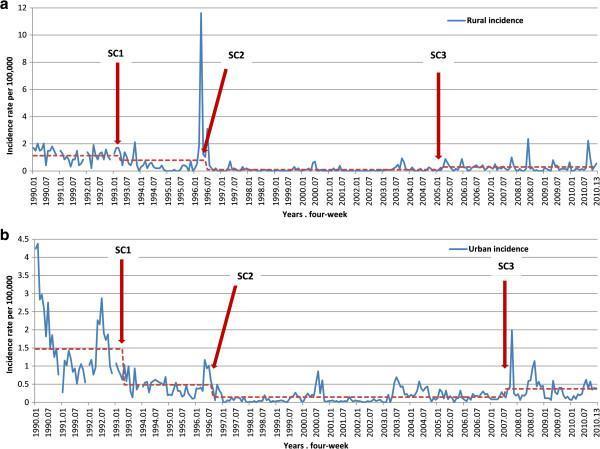
Two time-series graphs (a and b) illustrating the epidemiological incidence of whooping cough (pertussis) in Catalonia, Spain, from 1990 to 2010. The y-axis represents the incidence rate per 100,000 population, and the x-axis displays time in four-week periods. Graph 'a' depicts rural counties, showing a significant outbreak peak around 1996 reaching approximately 12 per 100,000. Graph 'b' depicts urban counties, showing higher baseline incidence in the early 1990s followed by a general decline and subsequent smaller peaks. Both graphs identify structural changes (SC) marked as SC1, SC2, and SC3, which indicate significant shifts in the time-series mean or trend, illustrated by red dashed horizontal lines. These structural changes align with epidemiological shifts in disease transmission patterns across two decades. The data serves to compare rural versus urban disease dynamics and identify specific periods of epidemiological transition, supporting public health monitoring and immunization strategy evaluation.
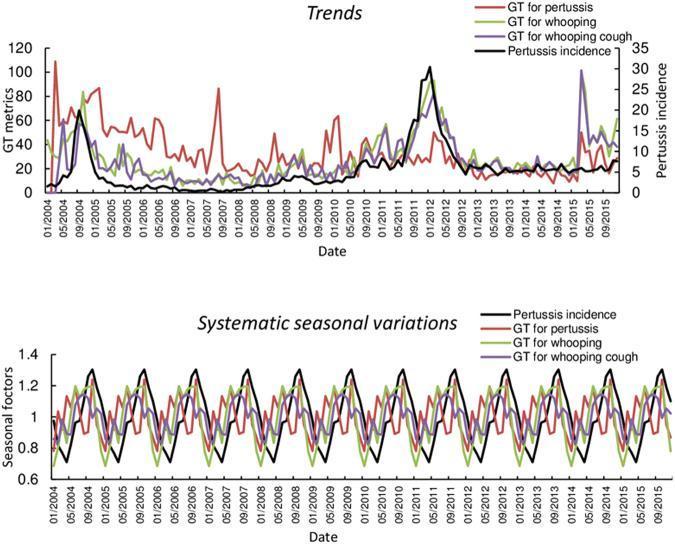
An epidemiological infographic consisting of two line graphs illustrating the relationship between national pertussis (whooping cough) incidence rates and Google Trends (GT) data in Australia from 2004 to 2015. The top graph, labeled 'Trends', shows the longitudinal progression of four metrics: pertussis incidence (black line), and GT search metrics for 'pertussis' (red), 'whooping' (green), and 'whooping cough' (purple). Significant peaks in clinical incidence are visible around 2004–2005 and a major surge in 2011–2012, showing visual correlation with search volume spikes. The bottom graph, labeled 'Systematic seasonal variations', displays seasonal factors on a scale of 0.6 to 1.4. It reveals a clear cyclical wave pattern for all metrics, indicating synchronized annual seasonality where incidence and search queries peak and trough during specific months of the year. This comparison chart serves as an educational tool for digital epidemiology, demonstrating how internet search behavior can mirror public health surveillance data for infectious respiratory diseases.
Pertussis (Whooping Cough) - Microbiology
The Organism
- Sherris & Ryan's Medical Microbiology, 8th Ed.
Growth and Culture
-
Morphology: Gram-negative coccobacillus, 0.5-1.0 μm
-
Growth: Slow (3-7 days), requires special media
-
Medium: Bordet-Gengou medium (potato-blood-glycerol agar) or Regan-Lowe charcoal agar
- Requires nicotinamide as nutritional supplement
- Contains charcoal or blood to neutralize inhibitory compounds in standard bacteriologic media
- Contains antibiotics (e.g., cephalexin) to suppress normal respiratory flora
-
Environmental survival: Very susceptible to environmental changes; survives only briefly outside the human respiratory tract
-
Organism is strictly aerobic and non-motile
-
Sherris & Ryan's Medical Microbiology, 8th Ed.
Cell Wall and Structure
- Lipopolysaccharide (LPS) - differs significantly from typical enteric bacteria LPS and is less potent as an endotoxin
- Outer membrane proteins (OMPs) - including pertactin, an important adhesin and vaccine antigen
- Filamentous hemagglutinin (FHA) - an outer surface filamentous protein that extends from the cell body; it binds amino acid sequences (RGD sequences) found on host cell integrins
- Pili (fimbriae) - act as adhesins along with FHA and pertactin
Adhesins (Colonization Factors)
| Adhesin | Nature | Function |
|---|---|---|
| Filamentous Hemagglutinin (FHA) | Large surface filament | Binds RGD sequences on host cell integrins (primary adhesin) |
| Pertactin (Prn) | OMP (~69 kDa) | Adhesin; binds integrin; vaccine antigen |
| Pili / Fimbriae (FIM 2, FIM 3) | Surface appendages | Adhesion; role in maintaining infection |
| Pertussis toxin (PT) binding subunit | B oligomer of PT | Also contributes to initial attachment |
- Harrison's Principles of Internal Medicine, 22nd Ed.; Sherris & Ryan's Medical Microbiology
Virulence Factors and Toxins
1. Pertussis Toxin (PT) - the "signature" toxin
- An A-B type exotoxin (1 A subunit + 5 B subunits arranged as B oligomer)
- The B oligomer mediates binding to host cell surfaces (and contributes to adhesion)
- The A subunit (S1) is an ADP-ribosyltransferase that modifies the Giα inhibitory G-protein - this locks the G-protein in the GDP-bound (inactive) state, preventing it from inhibiting adenylate cyclase - resulting in elevated cAMP in target cells
- Lymphocytosis - PT blocks lymphocyte recirculation from lymph nodes (a hallmark: WBC can exceed 30,000-100,000/μL in severe cases)
- Histamine sensitization - patients become sensitized to histamine
- Enhanced insulin secretion (promotes hypoglycemia)
- Immunosuppression - paralysis of neutrophils and macrophages; early in disease PT downregulates immune responses prolonging infection; later it upregulates inflammation potentially enhancing bacterial shedding
- The specific biologic effect depends on which G-protein-coupled receptor system is disrupted in the particular host cell type affected
2. Adenylate Cyclase Toxin (ACT / CyaA)
- Bifunctional toxin: combines adenylate cyclase enzyme activity with hemolysin activity
- Binds to CR3 (CD11b/CD18) on immune cells (neutrophils, macrophages, NK cells)
- Once inside the cell, it is activated by calmodulin to produce supraphysiologic levels of cAMP
- This inhibits the antibacterial functions of macrophages and neutrophils (impairs chemotaxis, oxidative burst, phagocytosis) → local immunosuppression that enhances bacterial survival
- Also called CyaA
3. Tracheal Cytotoxin (TCT)
- A peptidoglycan fragment (disaccharide-tetrapeptide monomer released during cell wall turnover)
- Acts locally on the ciliated respiratory epithelium
- Inhibits ciliary motion → ciliostasis
- Stimulates production of IL-1 and nitric oxide (NO) in epithelial cells → directly injures ciliated cells → leads to the progressive extrusion and destruction of ciliated epithelial cells
- This is the primary cause of the denuded mucosa devoid of cilia that underlies the persistent cough
4. Dermonecrotic Toxin (DNT)
- Heat-labile toxin
- Causes local tissue necrosis at the site of infection
- Less well characterized than PT and TCT
5. Filamentous Hemagglutinin (FHA)
- Considered both an adhesin and a virulence factor
- Promotes anti-inflammatory responses (stimulates IL-10) which helps the bacteria evade initial immune clearance
| Factor | Mechanism | Effect |
|---|---|---|
| PT (Pertussis Toxin) | ADP-ribosylates Giα → ↑cAMP | Lymphocytosis, histamine sensitization, immune paralysis, insulin secretion |
| ACT (Adenylate Cyclase Toxin) | Binds CR3, calmodulin-activated → ↑cAMP | Kills/paralyzes macrophages and neutrophils |
| TCT (Tracheal Cytotoxin) | Peptidoglycan fragment → IL-1, NO | Ciliated cell destruction, ciliostasis |
| DNT (Dermonecrotic Toxin) | Local necrosis | Local tissue damage |
| FHA | Integrin-binding adhesin | Colonization, anti-inflammatory |
| Pertactin | OMP adhesin | Colonization |
| Pili (FIM 2, 3) | Surface adhesins | Colonization |
Pathogenesis - Step by Step
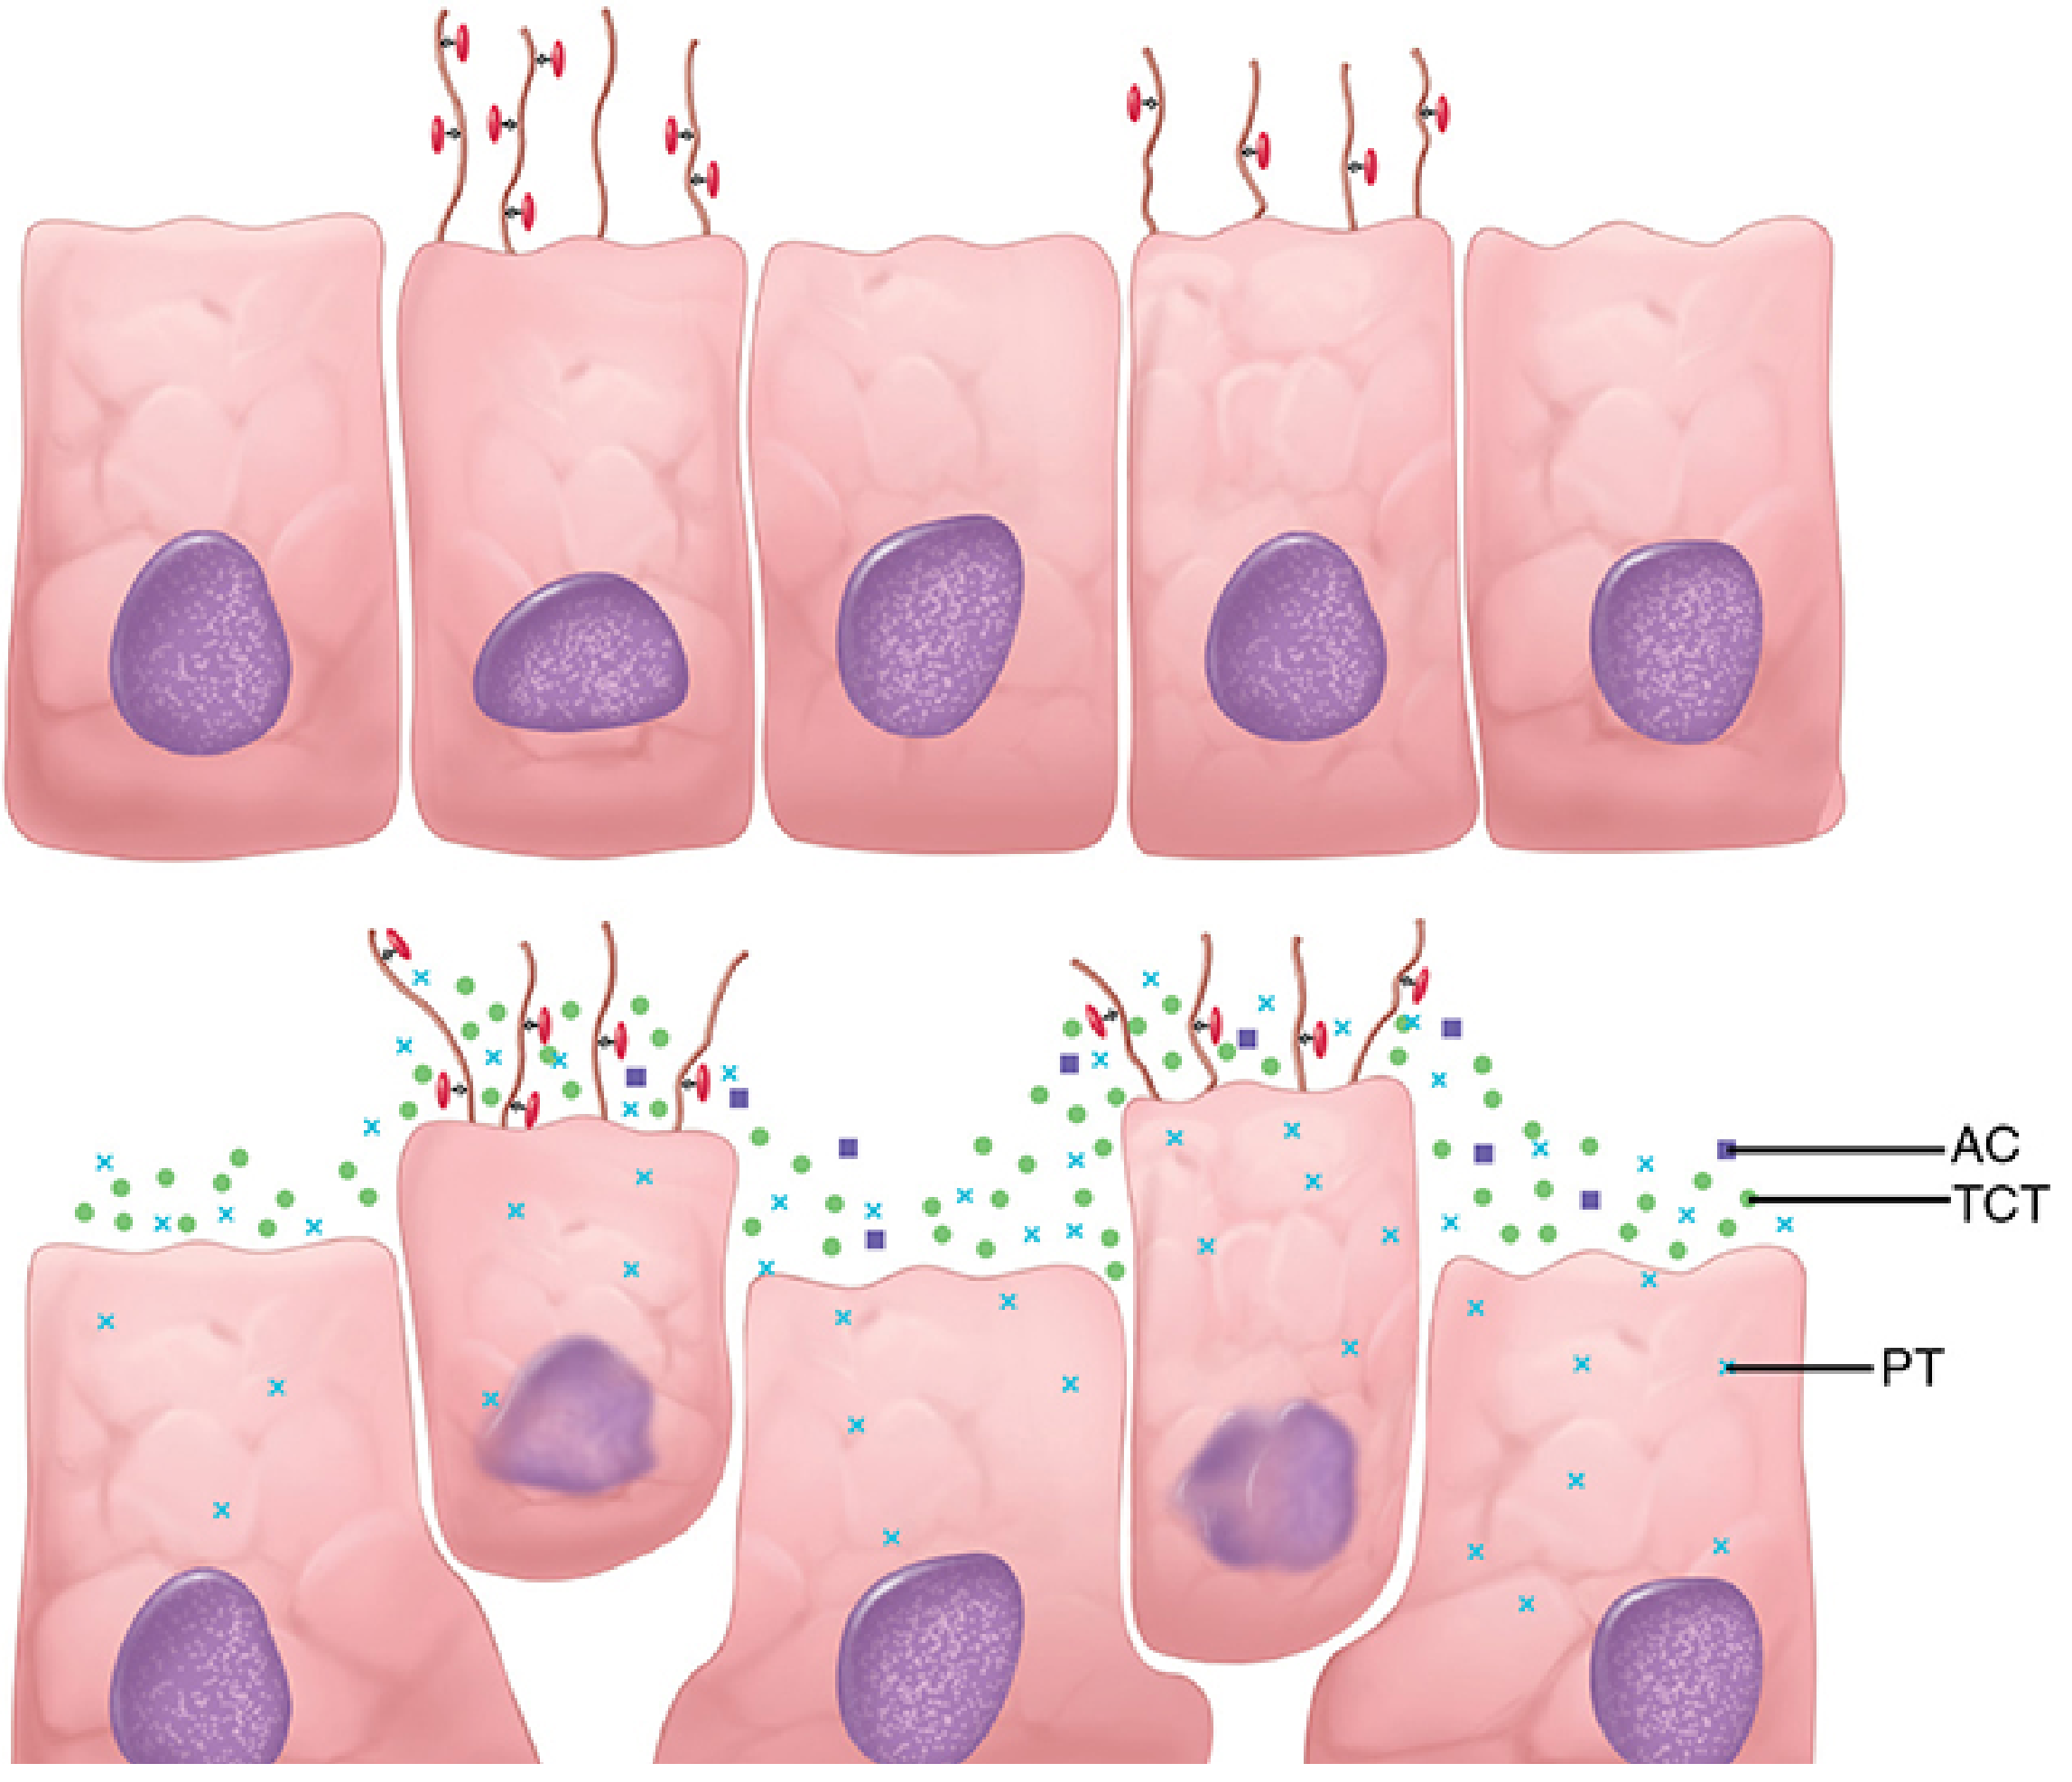
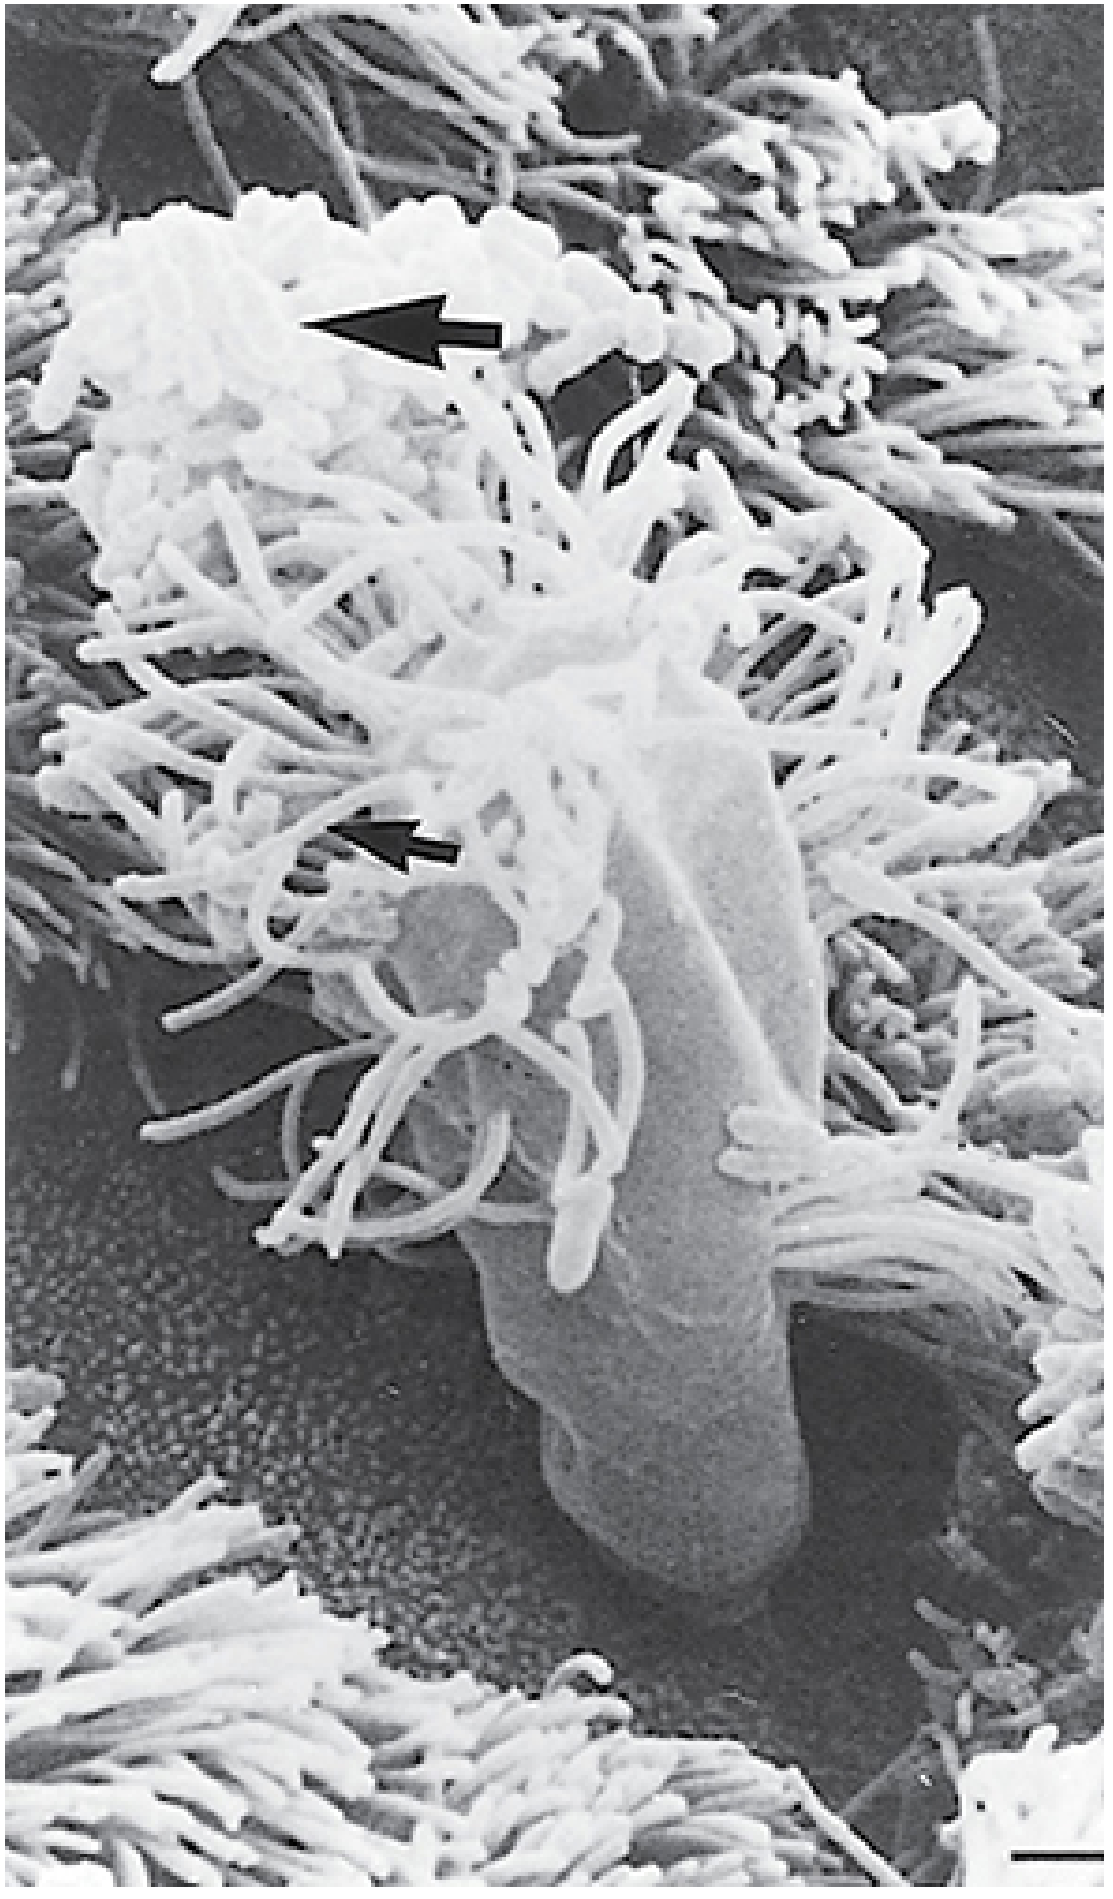
- Sherris & Ryan's Medical Microbiology, 8th Ed.; Goldman-Cecil Medicine
Genetic Regulation of Virulence
-
A two-component regulatory system (BvgA/BvgS) controls expression of at least 20 unlinked chromosomal virulence genes
-
Expression is modulated by temperature, ionic conditions, and nicotinic acid
-
The process is sequential: adhesins (FHA, pili) are expressed first, followed by toxins (PT, AC) - allowing bacteria to attach before deploying damaging factors
-
This ordered gene expression helps the organism adapt stepwise to diverse conditions throughout the respiratory tract
-
Sherris & Ryan's Medical Microbiology, 8th Ed.
Epidemiology and Transmission
-
Pertussis remains endemic even in highly vaccinated countries, with cases occurring in 3-5 year cycles
-
Transmission is primarily by aerosol droplets from both symptomatic and asymptomatic hosts
-
Asymptomatic infection (estimated at 56% of tested household contacts) contributes significantly to transmission
-
In unimmunized populations, peak incidence is in preschool years. In highly immunized populations, the peak has shifted to infants <1 year (who have not completed the 3-dose primary series)
-
Severe morbidity and mortality are almost entirely restricted to infants - in the US 2000-2017, infants <2 months accounted for 84% of pertussis deaths
-
Adolescents and adults serve as major reservoirs due to waning vaccine immunity
-
Harrison's Principles of Internal Medicine, 22nd Ed.
Clinical Stages
Stage 1: Catarrhal (1-2 weeks)
- Profuse mucoid rhinorrhea, low-grade fever, malaise, sneezing, anorexia
- Most communicable - large numbers of organisms present in nasopharynx
- Clinically indistinguishable from a common cold
Stage 2: Paroxysmal (2-4 weeks or longer)
- Episodes of paroxysmal coughing (up to 15-25 rapid coughs in one expiration)
- Followed by the inspiratory whoop (forceful inspiratory gasp against a narrowed glottis as air is breathed in after exhausting all reserve)
- Post-tussive vomiting is common
- Cyanosis can occur during severe paroxysms
- In infants: apnea may occur instead of the whoop
- Marked lymphocytosis - a hallmark (WBC 15,000-100,000/μL, predominantly lymphocytes)
Stage 3: Convalescent (weeks to months)
- Gradual resolution; paroxysms decrease in frequency and severity
- Intercurrent respiratory infections may trigger recurrence of paroxysmal coughing
Immunity
-
Both humoral and cell-mediated immunity are important
-
Immunity after natural infection is not lifelong - seroepidemiologic evidence shows waning; subclinical re-infection periodically boosts immunity
-
Natural infection and whole-cell vaccines elicit a TH1/TH17-predominant response
-
Acellular vaccines stimulate a TH2-biased response - this may explain the faster waning of protection (within 2-4 years after the 5th/6th dose vs. 10-12 years for whole-cell vaccines)
-
Antibodies to PT, FHA, pertactin, and fimbriae are all protective in animal models
-
Harrison's Principles of Internal Medicine, 22nd Ed.
Diagnosis
| Method | Details |
|---|---|
| Culture (gold standard) | Bordet-Gengou or Regan-Lowe agar; takes 3-7 days; best in early catarrhal phase when organisms are abundant |
| PCR | Most sensitive method; preferred in later stages; detects B. pertussis-specific DNA from nasopharyngeal swab |
| DFA (Direct Fluorescent Antibody) | Less sensitive than culture or PCR; rapid but limited use |
| Serology | Anti-PT IgG (single high titer or paired samples); useful in later disease and epidemiologic studies; not useful acutely |
| CBC | Shows marked lymphocytosis (not neutrophilia) - a distinguishing feature |
Treatment
| Drug | Notes |
|---|---|
| Azithromycin (preferred) | Drug of choice, especially in infants; 5-day course |
| Clarithromycin | Alternative macrolide |
| Erythromycin | Effective but poorly tolerated; risk of infantile hypertrophic pyloric stenosis in neonates <1 month |
| Trimethoprim-sulfamethoxazole (TMP-SMX) | Alternative in macrolide-intolerant patients |
- Antibiotics are most effective in the catarrhal phase - they eradicate the organism and reduce transmission
- In the paroxysmal phase, antibiotics do not significantly alter the clinical course but reduce communicability
- Chemoprophylaxis with azithromycin is recommended for all close contacts regardless of vaccination status
Vaccination
-
DTwP (whole-cell): Highly effective but more reactogenic; longer-lasting TH1/TH17 immunity; reduces mucosal carriage
-
DTaP/Tdap (acellular): Contains PT toxoid, FHA, pertactin, and fimbriae (vaccine formulation varies); safer but immunity wanes faster (TH2-biased); does not prevent mucosal carriage as effectively
-
Maternal Tdap in pregnancy (27-36 weeks): Augments infant passive IgG immunity - highly effective at reducing infant pertussis
-
Infant baboons immunized with acellular vaccines remain contagious and spread infection to cage mates - supporting the importance of whole-cell vaccines for herd immunity
-
Goldman-Cecil Medicine; Harrison's Principles of Internal Medicine, 22nd Ed.
- Gram-negative coccobacillus; grows on Bordet-Gengou / Regan-Lowe agar (3-7 days)
- Non-invasive - all pathology mediated by toxins (PT, ACT, TCT)
- PT: A-B toxin → ADP-ribosylates Giα → lymphocytosis, histamine sensitization, insulin release, immune paralysis
- ACT: calmodulin-activated → supraphysiologic cAMP → kills neutrophils/macrophages
- TCT: peptidoglycan fragment → destroys ciliated cells (explains persistent cough)
- Three clinical stages: catarrhal (most infectious) → paroxysmal (whoop + lymphocytosis) → convalescent
- Treatment: azithromycin (drug of choice)
- BvgA/BvgS two-component system regulates virulence gene expression
5 marks answer according to apurba Sastry
Apurba Sastry pertussis Bordetella 5 marks microbiology exam answer
Pertussis (Whooping Cough) - 5 Marks Answer
Causative Agent
- Bordetella pertussis - Gram-negative, small coccobacillus
- Strict aerobe; non-motile; non-sporing
- No known animal reservoir - human is the only host (an important exam fact from Apurba Sastry, p. 352)
Cultural Characters
- Fastidious, slow-growing (3-7 days)
- Medium: Bordet-Gengou medium (potato-blood-glycerol agar) OR Regan-Lowe medium (charcoal-horse blood-cephalexin) - preferred due to longer shelf life
- Incubated at 35-37°C aerobically in moist environment
- Colonies: small, shiny, "mercury droplet" appearance (bisected pearl colonies) on Bordet-Gengou
Virulence Factors (the most exam-heavy section)
| Virulence Factor | Action |
|---|---|
| Pertussis toxin (PT) | A-B toxin; ADP-ribosylates Giα protein → causes lymphocytosis, histamine sensitization, enhanced insulin secretion |
| Filamentous hemagglutinin (FHA) | Primary adhesin; binds to integrin on ciliated epithelium |
| Pertactin | Outer membrane protein adhesin; key vaccine antigen |
| Fimbriae (FIM 2, FIM 3) | Adhesins; promote tracheal colonization |
| Adenylate cyclase toxin (ACT) | Enters phagocytes via CR3; calmodulin-activated → ↑cAMP → inhibits phagocyte killing |
| Tracheal cytotoxin (TCT) | Peptidoglycan fragment; destroys ciliated epithelial cells → ciliostasis and denuded mucosa |
| Dermonecrotic toxin (DNT) | Local tissue necrosis |
- Virulence genes regulated by BvgA/BvgS two-component system - expression is sequential (adhesins first, then toxins)
Pathogenesis
- Organisms inhaled → attach to ciliated epithelium of nasopharynx and trachea via FHA, pertactin, fimbriae, PT
- TCT and DNT cause local damage → ciliated cells are destroyed and extruded → denuded epithelium → impaired mucociliary clearance → persistent cough
- ACT inhibits macrophage/neutrophil function → local immunosuppression → bacterial survival
- PT is absorbed systemically → marked lymphocytosis (WBC can reach 30,000-100,000/μL), histamine sensitization, enhanced insulin secretion
- Organism does NOT invade bloodstream - disease is entirely toxin-mediated
Clinical Features - Three Stages
| Stage | Duration | Features |
|---|---|---|
| Catarrhal | 1-2 weeks | Profuse mucoid rhinorrhea, low-grade fever, malaise; most infectious stage |
| Paroxysmal | 2-4 weeks | Paroxysmal cough → inspiratory whoop → post-tussive vomiting; cyanosis; apnea in infants; marked lymphocytosis |
| Convalescent | Weeks-months | Gradual resolution of cough |
Laboratory Diagnosis
| Test | Details |
|---|---|
| Culture | Bordet-Gengou / Regan-Lowe medium; 3-7 days; gold standard; best in catarrhal phase |
| PCR (NAAT) | Most sensitive and specific; preferred in later stages; identifies B. pertussis DNA |
| DFA (Direct Fluorescent Antibody) | Rapid but less sensitive; declining use |
| Serology | Anti-PT IgG (single high titer or 4-fold rise); useful in adolescents/adults with later disease |
| CBC | Marked lymphocytosis (not neutrophilia) - a hallmark diagnostic clue |
Treatment and Prophylaxis
- Drug of choice: Azithromycin (5-day course; preferred especially in infants)
- Alternatives: Clarithromycin, Erythromycin (avoid in neonates <1 month - risk of hypertrophic pyloric stenosis), TMP-SMX
- Antibiotics work best in catarrhal phase; in paroxysmal phase they reduce communicability but do not shorten illness
- Chemoprophylaxis: Azithromycin for all close contacts
Vaccination (Acellular Pertussis Vaccine - aP / DTaP)
- Pertussis toxoid (inactivated PT) - present in ALL formulations
- Filamentous hemagglutinin (FHA)
- Pertactin
- Agglutinogens (fimbriae) 1, 2, 3 (in some preparations)
- No animal reservoir - B. pertussis is exclusively a human pathogen
- Most communicable: catarrhal stage
- Hallmark lab finding: lymphocytosis (not neutrophilia)
- Specimen: nasopharyngeal swab
- DOC: Azithromycin
- Best diagnostic test: PCR (NAAT)
- Acellular vaccine must contain: PT toxoid + FHA (minimum)
Make a ppt with images
Bordetella pertussis gram negative coccobacillus microscopy
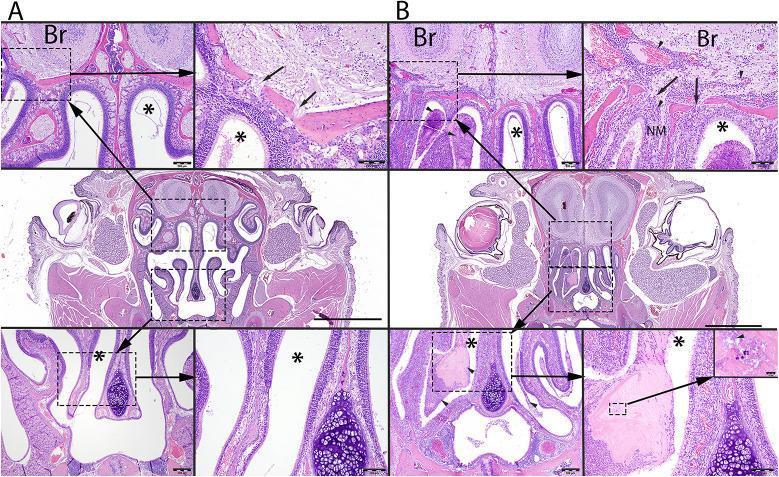
This composite image presents light microscopy findings of Hematoxylin and Eosin (HE)-stained coronal sections of a mouse nasal cavity and olfactory bulb (Br). Panel A shows a control group with a clear, open nasal meatus (*) and a well-defined cribriform plate (arrows) separating the nasal cavity from the brain neuropil. Panel B illustrates the histopathology following Bordetella pertussis challenge, characterized by severe rhinitis. Key diagnostic features in Panel B include the accumulation of dense mucopurulent exudate (arrowheads) within the nasal meatus, composed of neutrophils, proteinaceous debris, and bacteria. High-magnification views of the cribriform plate in the infected model reveal extensive inflammatory cellular infiltrates extending along perivascular spaces and through the cribriform plate into the olfactory bulb (Br), obscuring the nasal mucosa (NM). The images demonstrate the pathological progression from a clear airway to one obstructed by inflammatory exudate and the potential for infection to spread across the anatomical barrier of the cribriform plate into the central nervous system.
This Comparison Chart displays a matrix of four Prediction Analysis of Microarrays (PAM) heatmaps, comparing antibody recognition of Bordetella pertussis (Bp) epitopes across four study groups: DTPa2 (29 targets), DTPa5 (43 targets), whole cell vaccine (42 targets), and natural infection (32 targets). The visualization represents results from peptide microarray analysis. Each heatmap is organized with hierarchical clustering dendrograms on the top and left axes. The x-axis represents individual patient sera (n=10 per group), and the y-axis represents specific target epitopes. A color-coded scale indicates IgG signal intensity: red represents strong epitope recognition (high fluorescence), while green represents weak or no recognition. The heatmaps demonstrate distinct immunological 'reactome' profiles for each group. For instance, DTPa5 shows a dense cluster of high-intensity recognition (red), while the whole cell and infection groups exhibit more heterogeneous patterns. This data is used to differentiate the humoral immune response induced by various pertussis vaccine formulations compared to natural whooping cough infection.
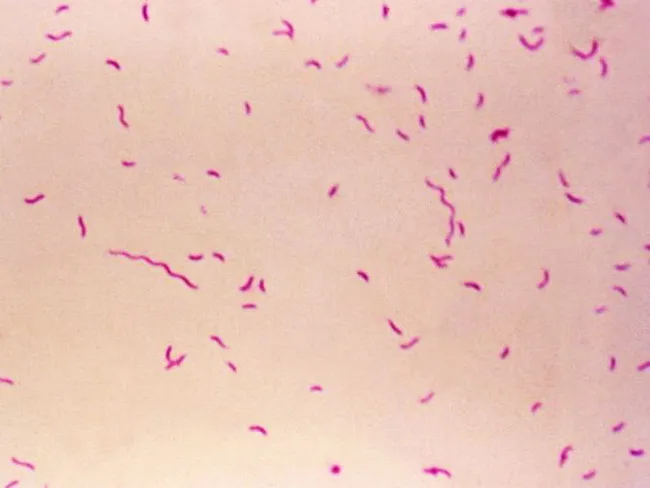
Bright-field light microscopy of a Gram-stained bacterial smear reveals numerous small, slender, curved Gram-negative rods with a characteristic gull-wing appearance consistent with Campylobacter species. The image captures bacteria oriented individually and in small clusters against a pale pink counterstain, illustrating Bacillary morphology typical of enteric pathogens. Gram staining shows purple/blue rods (crystal violet retained by cell wall) with a light pink background from the counterstain (safranin), enabling discrimination from Gram-positive organisms. The organisms appear slender and curved, with a single polar flagellum suggested by motility or alignment in the smear. Specimen type is a bacterial smear obtained from a gastrointestinal sample (feces or culture isolate), prepared for diagnostic microbiology. The imaging modality is bright-field microscopy at high magnification (approximately 1000x with oil immersion), following Gram staining to highlight bacterial cell wall structure. Clinically, detection of Campylobacter species supports infectious gastroenteritis; in the IPSID (immunoproliferative small intestinal disease) context, Campylobacter involvement has been proposed as a pathogenic trigger mirroring Helicobacter pylori's role in gastric MALT lymphoma. Differential diagnoses include Helicobacter, Vibrio, and other curved Gram-negative bacteria. This image serves educational and diagnostic utility for microbiology, clinical pathology, gastroenterology, and infectious disease research.
pertussis whooping cough clinical infant coughing stages
An epidemiological infographic consisting of two line graphs illustrating the relationship between national pertussis (whooping cough) incidence rates and Google Trends (GT) data in Australia from 2004 to 2015. The top graph, labeled 'Trends', shows the longitudinal progression of four metrics: pertussis incidence (black line), and GT search metrics for 'pertussis' (red), 'whooping' (green), and 'whooping cough' (purple). Significant peaks in clinical incidence are visible around 2004–2005 and a major surge in 2011–2012, showing visual correlation with search volume spikes. The bottom graph, labeled 'Systematic seasonal variations', displays seasonal factors on a scale of 0.6 to 1.4. It reveals a clear cyclical wave pattern for all metrics, indicating synchronized annual seasonality where incidence and search queries peak and trough during specific months of the year. This comparison chart serves as an educational tool for digital epidemiology, demonstrating how internet search behavior can mirror public health surveillance data for infectious respiratory diseases.
A four-panel stacked line graph illustrating the STL (Seasonal-Trend decomposition using LOESS) time-series analysis of weekly pertussis (whooping cough) cases from 2015 to 2019. The top panel, 'data', shows the raw observed weekly case numbers, fluctuating between approximately 100 and 800 cases. The second panel, 'trend', displays a smoothed non-linear curve indicating an initial decline in 2015, a significant rise throughout 2016 peaking in mid-2017, followed by a steady decline through 2019. The third panel, 'seasonal', highlights a recurring annual oscillatory pattern with distinct peaks in winter months and troughs in spring/summer, demonstrating the disease's seasonal periodicity. The bottom panel, 'remainder', represents the random noise or residuals not captured by trend or seasonality. This epidemiological visualization is used in public health to analyze disease progression, monitor outbreaks, and inform vaccination or triage protocols by distinguishing cyclical patterns from long-term changes in incidence.
Two time-series graphs (a and b) illustrating the epidemiological incidence of whooping cough (pertussis) in Catalonia, Spain, from 1990 to 2010. The y-axis represents the incidence rate per 100,000 population, and the x-axis displays time in four-week periods. Graph 'a' depicts rural counties, showing a significant outbreak peak around 1996 reaching approximately 12 per 100,000. Graph 'b' depicts urban counties, showing higher baseline incidence in the early 1990s followed by a general decline and subsequent smaller peaks. Both graphs identify structural changes (SC) marked as SC1, SC2, and SC3, which indicate significant shifts in the time-series mean or trend, illustrated by red dashed horizontal lines. These structural changes align with epidemiological shifts in disease transmission patterns across two decades. The data serves to compare rural versus urban disease dynamics and identify specific periods of epidemiological transition, supporting public health monitoring and immunization strategy evaluation.
mkdir -p /tmp/workspace/pertussis-ppt && ls /tmp/workspace/
python /tmp/skills/shared/scripts/fetch_images.py \ "https://cdn.orris.care/cdss_images/49d38cde9a3992651593182476968ceb171b1e0388a71f199f66da0054691e9f.png" \ "https://cdn.orris.care/cdss_images/8426b25c5dec7b4f22e4a4f723295873648a2634e18dfa0fbd624bf7989e52a2.png" \ "https://cdn.orris.care/cdss_images/pmc_clinical_VQA_14f7bd8cd4cde816d7111c7f43998f25b6a4a7698b26c13ca0da5be5df07a870.jpg" \ 2>/dev/null | python3 -c "import sys,json; data=json.load(sys.stdin); [print(i, d['url'], 'OK' if d['base64'] else 'FAIL') for i,d in enumerate(data)]"
~/pertussis-ppt/build_ppt.py
import json, subprocess, base64
from io import BytesIO
from pptx import Presentation
from pptx.util import Inches, Pt, Emu
from pptx.dml.color import RGBColor
from pptx.enum.text import PP_ALIGN, MSO_ANCHOR
from pptx.util import Inches, Pt

# ── Color palette ──────────────────────────────────────────────────────────────
DARK_BLUE   = RGBColor(0x0D, 0x3B, 0x66)   # deep navy
MED_BLUE    = RGBColor(0x15, 0x78, 0xC2)   # accent blue
LIGHT_BLUE  = RGBColor(0xD6, 0xEA, 0xF8)   # pale bg
WHITE       = RGBColor(0xFF, 0xFF, 0xFF)
GOLD        = RGBColor(0xF4, 0xD0, 0x3F)
DARK_TEXT   = RGBColor(0x1A, 0x1A, 0x2E)
RED_ACCENT  = RGBColor(0xC0, 0x39, 0x2B)
GREEN_ACCENT= RGBColor(0x1E, 0x8B, 0x4C)

# ── Image URLs ─────────────────────────────────────────────────────────────────
IMAGE_URLS = [
    "https://cdn.orris.care/cdss_images/49d38cde9a3992651593182476968ceb171b1e0388a71f199f66da0054691e9f.png",  # mechanism diagram
    "https://cdn.orris.care/cdss_images/8426b25c5dec7b4f22e4a4f723295873648a2634e18dfa0fbd624bf7989e52a2.png",  # EM image
    "https://cdn.orris.care/cdss_images/pmc_clinical_VQA_14f7bd8cd4cde816d7111c7f43998f25b6a4a7698b26c13ca0da5be5df07a870.jpg",  # histopathology
]

print("Fetching images...")
raw = subprocess.check_output(["python", "/tmp/skills/shared/scripts/fetch_images.py"] + IMAGE_URLS)
imgs = json.loads(raw)
img_data = []
for img in imgs:
    if img["base64"]:
        mime, b64 = img["base64"].split(";base64,", 1)
        img_data.append(BytesIO(base64.b64decode(b64)))
    else:
        img_data.append(None)
print(f"Loaded {sum(1 for x in img_data if x)} images")

# ── Helpers ────────────────────────────────────────────────────────────────────
prs = Presentation()
prs.slide_width  = Inches(13.333)
prs.slide_height = Inches(7.5)
blank = prs.slide_layouts[6]

def add_rect(slide, x, y, w, h, fill_rgb, alpha=None):
    from pptx.oxml.ns import qn
    shape = slide.shapes.add_shape(1, Inches(x), Inches(y), Inches(w), Inches(h))
    shape.line.fill.background()
    fill = shape.fill
    fill.solid()
    fill.fore_color.rgb = fill_rgb
    return shape

def add_text(slide, text, x, y, w, h, size, bold=False, color=WHITE,
             align=PP_ALIGN.LEFT, wrap=True, italic=False, anchor=MSO_ANCHOR.TOP):
    tb = slide.shapes.add_textbox(Inches(x), Inches(y), Inches(w), Inches(h))
    tf = tb.text_frame
    tf.word_wrap = wrap
    tf.vertical_anchor = anchor
    tf.margin_left = 0; tf.margin_right = 0
    tf.margin_top = 0;  tf.margin_bottom = 0
    p = tf.paragraphs[0]
    p.alignment = align
    run = p.add_run()
    run.text = text
    run.font.size  = Pt(size)
    run.font.bold  = bold
    run.font.italic = italic
    run.font.color.rgb = color
    run.font.name  = "Calibri"
    return tb

def add_multiline(slide, lines, x, y, w, h, size, color=DARK_TEXT,
                  bold_first=False, line_spacing=1.15, bullet=True):
    """lines = list of (text, bold) tuples or plain strings"""
    tb = slide.shapes.add_textbox(Inches(x), Inches(y), Inches(w), Inches(h))
    tf = tb.text_frame
    tf.word_wrap = True
    tf.margin_left  = Pt(4)
    tf.margin_right = Pt(4)
    tf.margin_top   = Pt(2)
    tf.margin_bottom= Pt(2)
    first = True
    for item in lines:
        if isinstance(item, tuple):
            text, bold = item
        else:
            text, bold = item, False
        if first:
            p = tf.paragraphs[0]
            first = False
        else:
            p = tf.add_paragraph()
        from pptx.util import Pt as Pt2
        p.space_after = Pt2(3)
        run = p.add_run()
        prefix = "• " if bullet else ""
        run.text = prefix + text
        run.font.size  = Pt(size)
        run.font.bold  = bold
        run.font.color.rgb = color
        run.font.name  = "Calibri"
    return tb

def add_image(slide, img_io, x, y, w, h=None):
    if img_io is None:
        return
    img_io.seek(0)
    if h:
        slide.shapes.add_picture(img_io, Inches(x), Inches(y), Inches(w), Inches(h))
    else:
        slide.shapes.add_picture(img_io, Inches(x), Inches(y), Inches(w))

def header_bar(slide, title, subtitle=None):
    """Blue header bar at top of slide"""
    add_rect(slide, 0, 0, 13.333, 1.2, DARK_BLUE)
    add_rect(slide, 0, 1.2, 13.333, 0.08, GOLD)
    add_text(slide, title, 0.3, 0.1, 12.5, 0.8, 32, bold=True,
             color=WHITE, align=PP_ALIGN.LEFT, anchor=MSO_ANCHOR.MIDDLE)
    if subtitle:
        add_text(slide, subtitle, 0.3, 0.82, 12.5, 0.4, 14,
                 color=GOLD, align=PP_ALIGN.LEFT)

def footer(slide, text="Pertussis | Bordetella pertussis | Apurba Sastry's Medical Microbiology"):
    add_rect(slide, 0, 7.2, 13.333, 0.3, DARK_BLUE)
    add_text(slide, text, 0.3, 7.2, 12.5, 0.3, 10, color=RGBColor(0xAA,0xCC,0xFF),
             align=PP_ALIGN.CENTER, anchor=MSO_ANCHOR.MIDDLE)

# ══════════════════════════════════════════════════════════════════════════════
# SLIDE 1 – Title
# ══════════════════════════════════════════════════════════════════════════════
slide = prs.slides.add_slide(blank)
add_rect(slide, 0, 0, 13.333, 7.5, DARK_BLUE)
add_rect(slide, 0, 2.8, 13.333, 2.4, MED_BLUE)
add_rect(slide, 0, 2.75, 13.333, 0.08, GOLD)
add_rect(slide, 0, 5.12, 13.333, 0.08, GOLD)

add_text(slide, "PERTUSSIS", 0.5, 1.0, 12.3, 1.5, 72, bold=True,
         color=WHITE, align=PP_ALIGN.CENTER, anchor=MSO_ANCHOR.MIDDLE)
add_text(slide, "Whooping Cough", 0.5, 2.4, 12.3, 0.6, 28,
         color=GOLD, align=PP_ALIGN.CENTER)
add_text(slide, "Causative Agent: Bordetella pertussis", 0.5, 2.95, 12.3, 0.7, 22,
         color=WHITE, align=PP_ALIGN.CENTER, anchor=MSO_ANCHOR.MIDDLE)
add_text(slide, "Gram-negative coccobacillus | Strict aerobe | Non-motile | No animal reservoir",
         0.5, 3.55, 12.3, 0.5, 15, color=LIGHT_BLUE, align=PP_ALIGN.CENTER)
add_text(slide, "As per Apurba Sastry's Essentials of Medical Microbiology",
         0.5, 5.3, 12.3, 0.5, 13, color=GOLD, align=PP_ALIGN.CENTER, italic=True)
add_text(slide, "Microbiology | MBBS Second Professional",
         0.5, 6.8, 12.3, 0.5, 13, color=RGBColor(0xAA,0xCC,0xFF), align=PP_ALIGN.CENTER)

# ══════════════════════════════════════════════════════════════════════════════
# SLIDE 2 – Bacteriology & Culture
# ══════════════════════════════════════════════════════════════════════════════
slide = prs.slides.add_slide(blank)
add_rect(slide, 0, 0, 13.333, 7.5, RGBColor(0xF4,0xF6,0xFF))
header_bar(slide, "Bacteriology & Cultural Characteristics")
footer(slide)

# Left panel
add_rect(slide, 0.3, 1.45, 5.8, 5.5, WHITE)
add_rect(slide, 0.3, 1.45, 5.8, 0.45, MED_BLUE)
add_text(slide, "MORPHOLOGY & BIOLOGY", 0.35, 1.47, 5.7, 0.4, 13, bold=True,
         color=WHITE, anchor=MSO_ANCHOR.MIDDLE)
add_multiline(slide, [
    ("Gram-negative coccobacillus (0.5–1.0 µm)", True),
    ("Morphologically similar to Haemophilus", False),
    ("Strict aerobe", True),
    ("Non-motile, non-sporing", False),
    ("Capsule present in virulent phase", False),
    ("Oxidase positive, catalase positive", False),
    ("Nitrate, citrate, urea – NEGATIVE", False),
    ("NO known animal reservoir", True),
    ("Survives only briefly outside human host", False),
], 0.4, 2.0, 5.6, 4.8, 13.5, color=DARK_TEXT)

# Right panel
add_rect(slide, 6.4, 1.45, 6.6, 5.5, WHITE)
add_rect(slide, 6.4, 1.45, 6.6, 0.45, MED_BLUE)
add_text(slide, "CULTURE REQUIREMENTS", 6.45, 1.47, 6.5, 0.4, 13, bold=True,
         color=WHITE, anchor=MSO_ANCHOR.MIDDLE)
add_multiline(slide, [
    ("Media: Bordet-Gengou (BG) medium", True),
    ("   Potato-blood-glycerol agar + penicillin G", False),
    ("Preferred: Regan-Lowe charcoal medium", True),
    ("   Charcoal + horse blood + cephalexin + amphotericin B", False),
    ("   Longer shelf life than BG", False),
    ("Incubation: 35–37°C, 3–7 days (aerobic, moist)", False),
    ("Colonies: Small, shiny 'mercury droplet' / bisected pearl", True),
    ("Identified by immunofluorescence staining", False),
    ("Charcoal/blood neutralises inhibitory compounds", False),
], 6.5, 2.0, 6.4, 4.8, 13.5, color=DARK_TEXT)

# ══════════════════════════════════════════════════════════════════════════════
# SLIDE 3 – Virulence Factors
# ══════════════════════════════════════════════════════════════════════════════
slide = prs.slides.add_slide(blank)
add_rect(slide, 0, 0, 13.333, 7.5, RGBColor(0xF0,0xF4,0xFF))
header_bar(slide, "Virulence Factors", "BvgA/BvgS Two-Component Regulatory System controls all virulence genes")
footer(slide)

# 6 factor boxes in 2 rows × 3 cols
factors = [
    ("Pertussis Toxin (PT)", MED_BLUE,
     "A-B toxin (A1 + B5 oligomer)\n• ADP-ribosylates Giα → ↑cAMP\n• Causes: Lymphocytosis, histamine\n  sensitization, ↑insulin secretion\n• Immunosuppression of macrophages\n• KEY exam toxin"),
    ("Filamentous Hemagglutinin (FHA)", RGBColor(0x11,0x6A,0xA0),
     "Primary adhesin\n• Binds RGD integrin sequences on\n  ciliated epithelium\n• Secreted outside bacterial cell\n• Present in ALL acellular vaccines"),
    ("Tracheal Cytotoxin (TCT)", RED_ACCENT,
     "Peptidoglycan disaccharide fragment\n• Not BvgA/BvgS regulated\n• Induces IL-1 & Nitric Oxide in\n  ciliated cells\n• Destroys & extrudes ciliated cells\n• Causes denuded mucosa → cough"),
    ("Adenylate Cyclase Toxin (ACT/CyaA)", RGBColor(0x7D,0x3C,0x98),
     "Binds CR3 (CD11b) on phagocytes\n• Activated by calmodulin inside cell\n• Supraphysiologic ↑cAMP\n• Inhibits oxidative burst, chemotaxis\n• Kills neutrophils & macrophages"),
    ("Pertactin (Prn)", GREEN_ACCENT,
     "Outer membrane protein (~69 kDa)\n• Adhesin – binds integrins\n• KEY vaccine antigen\n• Pertactin-deficient strains\n  emerging due to vaccine pressure"),
    ("Fimbriae / Pili (FIM 2, FIM 3)", RGBColor(0xD3,0x54,0x00),
     "Surface appendages\n• Adhesins for ciliated epithelium\n• Role in tracheal colonization\n• Present in some acellular\n  vaccine formulations"),
]

cols = [0.25, 4.55, 8.85]
rows = [1.45, 4.35]
box_w, box_h = 4.0, 2.7

for i, (name, color, desc) in enumerate(factors):
    r, c = divmod(i, 3)
    x = cols[c]
    y = rows[r]
    add_rect(slide, x, y, box_w, box_h, WHITE)
    add_rect(slide, x, y, box_w, 0.42, color)
    add_text(slide, name, x+0.1, y+0.02, box_w-0.2, 0.38, 11.5, bold=True,
             color=WHITE, anchor=MSO_ANCHOR.MIDDLE, wrap=True)
    # desc as plain textbox
    tb = slide.shapes.add_textbox(Inches(x+0.1), Inches(y+0.5), Inches(box_w-0.2), Inches(box_h-0.6))
    tf = tb.text_frame; tf.word_wrap = True
    tf.margin_left = 0; tf.margin_right = 0; tf.margin_top = 0; tf.margin_bottom = 0
    for j, line in enumerate(desc.split("\n")):
        p = tf.paragraphs[0] if j == 0 else tf.add_paragraph()
        run = p.add_run(); run.text = line
        run.font.size = Pt(11); run.font.name = "Calibri"
        run.font.color.rgb = DARK_TEXT
        run.font.bold = (j == 0)

# ══════════════════════════════════════════════════════════════════════════════
# SLIDE 4 – Pathogenesis with diagram image
# ══════════════════════════════════════════════════════════════════════════════
slide = prs.slides.add_slide(blank)
add_rect(slide, 0, 0, 13.333, 7.5, RGBColor(0xF8,0xF9,0xFF))
header_bar(slide, "Pathogenesis of Pertussis", "Non-invasive disease — all pathology mediated by toxins")
footer(slide)

# Steps on left
add_rect(slide, 0.25, 1.45, 7.2, 5.7, WHITE)
steps = [
    ("Step 1 – Attachment", "B. pertussis attaches to ciliated bronchial epithelium via FHA, pertactin, fimbriae & PT binding subunit (B oligomer)"),
    ("Step 2 – Toxin Production", "Bacteria immobilize cilia, then secrete TCT (destroys ciliated cells via IL-1/NO) and ACT (kills macrophages/neutrophils via ↑cAMP)"),
    ("Step 3 – Epithelial Destruction", "Ciliated cells progressively extruded → denuded mucosa without ciliary blanket → impaired mucociliary clearance → PERSISTENT COUGH"),
    ("Step 4 – PT Absorption", "PT absorbed into bloodstream → systemic effects: lymphocytosis, histamine sensitization, ↑insulin secretion, immune paralysis"),
    ("KEY POINT", "B. pertussis does NOT invade tissue or bloodstream — disease is ENTIRELY toxin-mediated"),
]
y_pos = 1.55
for title, body in steps:
    is_key = title == "KEY POINT"
    bg = RGBColor(0xFF,0xF3,0xCD) if is_key else LIGHT_BLUE
    tc = RED_ACCENT if is_key else MED_BLUE
    add_rect(slide, 0.3, y_pos, 7.1, 0.25, tc)
    add_text(slide, title, 0.35, y_pos, 7.0, 0.24, 11, bold=True,
             color=WHITE, anchor=MSO_ANCHOR.MIDDLE)
    add_rect(slide, 0.3, y_pos+0.25, 7.1, 0.68, bg)
    tb = slide.shapes.add_textbox(Inches(0.4), Inches(y_pos+0.27), Inches(6.9), Inches(0.64))
    tf = tb.text_frame; tf.word_wrap = True
    tf.margin_left=0;tf.margin_right=0;tf.margin_top=0;tf.margin_bottom=0
    p=tf.paragraphs[0]; run=p.add_run(); run.text=body
    run.font.size=Pt(11.5); run.font.name="Calibri"; run.font.color.rgb=DARK_TEXT
    y_pos += 1.06

# Right: mechanism diagram image
add_text(slide, "Cellular mechanism of epithelial destruction", 7.7, 1.45, 5.3, 0.35, 11.5,
         bold=True, color=MED_BLUE, align=PP_ALIGN.CENTER)
if img_data[0]:
    img_data[0].seek(0)
    slide.shapes.add_picture(img_data[0], Inches(7.6), Inches(1.85), Inches(5.4), Inches(3.6))

add_text(slide, "↑ B. pertussis attaches to cilia → toxin secretion (PT, AC, TCT) → ciliated cell extrusion",
         7.6, 5.5, 5.4, 0.5, 10, color=RGBColor(0x55,0x55,0x55),
         align=PP_ALIGN.CENTER, italic=True, wrap=True)

# EM image below
if img_data[1]:
    img_data[1].seek(0)
    slide.shapes.add_picture(img_data[1], Inches(7.6), Inches(5.1), Inches(2.5), Inches(1.9))
add_text(slide, "SEM: B. pertussis (large arrow)\nattached to cilia (small arrow)", 10.2, 5.1, 2.9, 0.9,
         9.5, color=DARK_TEXT, wrap=True, italic=True)

# ══════════════════════════════════════════════════════════════════════════════
# SLIDE 5 – Clinical Stages
# ══════════════════════════════════════════════════════════════════════════════
slide = prs.slides.add_slide(blank)
add_rect(slide, 0, 0, 13.333, 7.5, RGBColor(0xF0,0xF8,0xFF))
header_bar(slide, "Clinical Features — Three Stages of Pertussis")
footer(slide)

stages = [
    ("1. CATARRHAL STAGE", "1–2 weeks", MED_BLUE, [
        "Profuse mucoid rhinorrhea",
        "Low-grade fever, malaise, sneezing",
        "Anorexia",
        "⚠ MOST COMMUNICABLE STAGE",
        "Indistinguishable from common cold",
        "Large no. of organisms in nasopharynx",
    ]),
    ("2. PAROXYSMAL STAGE", "2–4+ weeks", RED_ACCENT, [
        "Paroxysmal coughing (15–25 rapid coughs)",
        "Followed by INSPIRATORY WHOOP",
        "Post-tussive vomiting",
        "Cyanosis during severe episodes",
        "Apnea in infants (instead of whoop)",
        "MARKED LYMPHOCYTOSIS (15,000–100,000/µL)",
    ]),
    ("3. CONVALESCENT STAGE", "Weeks–months", GREEN_ACCENT, [
        "Gradual resolution of paroxysms",
        "Cough decreases in frequency & severity",
        "Intercurrent infections may trigger recurrence",
        "Immunity develops (not lifelong)",
        "Second attacks tend to be mild",
        "",
    ]),
]

x_starts = [0.25, 4.6, 8.95]
for i, (title, duration, color, bullets) in enumerate(stages):
    x = x_starts[i]
    add_rect(slide, x, 1.45, 4.1, 5.6, WHITE)
    add_rect(slide, x, 1.45, 4.1, 0.6, color)
    add_text(slide, title, x+0.1, 1.47, 3.9, 0.35, 13, bold=True,
             color=WHITE, anchor=MSO_ANCHOR.MIDDLE)
    add_text(slide, f"Duration: {duration}", x+0.1, 1.82, 3.9, 0.25, 11,
             color=GOLD if color==MED_BLUE else WHITE, anchor=MSO_ANCHOR.MIDDLE)
    add_multiline(slide, bullets, x+0.15, 2.15, 3.8, 4.8, 12.5, color=DARK_TEXT)

# Incubation period note
add_rect(slide, 0.25, 7.05, 12.8, 0.2, GOLD)
add_text(slide, "Incubation period: 7–10 days   |   Communicability: Highest in catarrhal stage",
         0.3, 7.05, 12.7, 0.2, 11, color=DARK_TEXT, align=PP_ALIGN.CENTER, anchor=MSO_ANCHOR.MIDDLE)

# ══════════════════════════════════════════════════════════════════════════════
# SLIDE 6 – Laboratory Diagnosis
# ══════════════════════════════════════════════════════════════════════════════
slide = prs.slides.add_slide(blank)
add_rect(slide, 0, 0, 13.333, 7.5, RGBColor(0xF8,0xFB,0xFF))
header_bar(slide, "Laboratory Diagnosis", "Specimen: Nasopharyngeal swab (deep posterior) — NOT throat swab")
footer(slide)

# Table header
add_rect(slide, 0.25, 1.45, 12.8, 0.5, MED_BLUE)
for text, xpos, width in [("TEST", 0.3, 2.5), ("SPECIMEN / TIMING", 2.85, 3.0), ("DETAILS", 5.9, 4.5), ("NOTE", 10.45, 2.5)]:
    add_text(slide, text, xpos, 1.47, width, 0.45, 12, bold=True, color=WHITE, anchor=MSO_ANCHOR.MIDDLE)

rows_data = [
    ("Culture\n(Gold Standard)", "NP swab\nCatarrhal / early\nparoxysmal phase",
     "Bordet-Gengou OR Regan-Lowe medium\nIncubate 35–37°C, 3–7 days aerobically",
     "Specific but insensitive;\nbest in early disease", LIGHT_BLUE),
    ("PCR (NAAT)\n[Most sensitive]", "NP swab\nAny stage (best\nin first 3 wks)",
     "Detects B. pertussis-specific DNA\nMore sensitive than culture",
     "Test of choice in\nlater stages", RGBColor(0xE8,0xF8,0xE8)),
    ("DFA (Direct\nFluorescent Ab)", "NP swab\nEarly disease",
     "Immunofluorescence on direct smear\nRapid but low sensitivity (~50%)",
     "Declining use;\nnot recommended alone", LIGHT_BLUE),
    ("Serology\n(Anti-PT IgG)", "Serum\nLater disease\n(>3 wks)",
     "Single high titer OR 4-fold rise in paired samples\nUseful in adolescents & adults",
     "Not useful acutely;\ngood for epidemiology", RGBColor(0xE8,0xF8,0xE8)),
    ("CBC (Blood\nCount)", "Blood\nParoxysmal phase",
     "Marked LYMPHOCYTOSIS (not neutrophilia)\nWBC 15,000–100,000/µL",
     "Hallmark diagnostic\nclue; due to PT effect", LIGHT_BLUE),
]

y = 1.95
for test, spec, detail, note, bg in rows_data:
    add_rect(slide, 0.25, y, 12.8, 0.8, bg)
    for text, xpos, width in [(test, 0.3, 2.45), (spec, 2.85, 2.95), (detail, 5.9, 4.45), (note, 10.45, 2.5)]:
        tb = slide.shapes.add_textbox(Inches(xpos), Inches(y+0.02), Inches(width), Inches(0.76))
        tf = tb.text_frame; tf.word_wrap = True
        tf.margin_left=Pt(3);tf.margin_right=Pt(2);tf.margin_top=Pt(2);tf.margin_bottom=Pt(2)
        for j, line in enumerate(text.split("\n")):
            p = tf.paragraphs[0] if j==0 else tf.add_paragraph()
            run=p.add_run(); run.text=line
            run.font.size=Pt(11); run.font.name="Calibri"; run.font.color.rgb=DARK_TEXT
            run.font.bold=(j==0 and test==text)
    y += 0.82

# Histopath image
if img_data[2]:
    img_data[2].seek(0)
    slide.shapes.add_picture(img_data[2], Inches(10.5), Inches(5.55), Inches(2.6), Inches(1.7))
add_text(slide, "Histopathology: mucopurulent\nexudate in nasal cavity\n(H&E stain, B. pertussis model)",
         8.0, 5.65, 2.4, 1.55, 9.5, color=DARK_TEXT, italic=True, wrap=True)

# ══════════════════════════════════════════════════════════════════════════════
# SLIDE 7 – Treatment & Vaccination
# ══════════════════════════════════════════════════════════════════════════════
slide = prs.slides.add_slide(blank)
add_rect(slide, 0, 0, 13.333, 7.5, RGBColor(0xF4,0xF8,0xF4))
header_bar(slide, "Treatment, Prophylaxis & Vaccination")
footer(slide)

# Left: Treatment
add_rect(slide, 0.25, 1.45, 6.0, 5.7, WHITE)
add_rect(slide, 0.25, 1.45, 6.0, 0.42, GREEN_ACCENT)
add_text(slide, "TREATMENT", 0.3, 1.47, 5.9, 0.38, 14, bold=True, color=WHITE, anchor=MSO_ANCHOR.MIDDLE)
add_multiline(slide, [
    ("Drug of Choice: AZITHROMYCIN", True),
    ("  • 5-day course; preferred in all ages especially infants", False),
    ("Alternatives:", True),
    ("  • Clarithromycin", False),
    ("  • Erythromycin (avoid in neonates <1 month →", False),
    ("    risk of infantile hypertrophic pyloric stenosis)", False),
    ("  • TMP-SMX (if macrolide-intolerant)", False),
    ("Timing matters:", True),
    ("  • Catarrhal phase: eradicates organism, shortens illness", False),
    ("  • Paroxysmal phase: reduces communicability only,", False),
    ("    does NOT shorten clinical illness", False),
    ("Chemoprophylaxis:", True),
    ("  • Azithromycin for ALL close contacts", False),
    ("  • Regardless of vaccination status", False),
], 0.35, 1.95, 5.8, 5.1, 12.5, color=DARK_TEXT)

# Right: Vaccination
add_rect(slide, 6.5, 1.45, 6.6, 5.7, WHITE)
add_rect(slide, 6.5, 1.45, 6.6, 0.42, MED_BLUE)
add_text(slide, "VACCINATION", 6.55, 1.47, 6.5, 0.38, 14, bold=True, color=WHITE, anchor=MSO_ANCHOR.MIDDLE)
add_multiline(slide, [
    ("Acellular Pertussis Vaccine (DTaP) contains:", True),
    ("  ✓ Pertussis toxoid (PT) — ALL formulations", True),
    ("  ✓ Filamentous hemagglutinin (FHA)", True),
    ("  ✓ Pertactin (Prn) — most formulations", False),
    ("  ✓ Fimbriae (FIM 2, 3) — some formulations", False),
    ("Indian Schedule (DPT): 6, 10, 14 weeks + boosters", True),
    ("Tdap booster: Adolescents 11–12 years", False),
    ("Maternal Tdap: 27–36 weeks pregnancy", True),
    ("  → Passive IgG to protect newborns", False),
    ("Whole-cell (DTwP) vs Acellular (DTaP):", True),
    ("  • DTwP: TH1/TH17 response, longer-lasting", False),
    ("  • DTaP: TH2-biased, wanes in 2–4 years", False),
    ("  • DTwP reduces mucosal carriage better", False),
    ("  • DTaP: safer, less reactogenic", False),
], 6.6, 1.95, 6.4, 5.1, 12.5, color=DARK_TEXT)

# ══════════════════════════════════════════════════════════════════════════════
# SLIDE 8 – Exam Key Points Summary
# ══════════════════════════════════════════════════════════════════════════════
slide = prs.slides.add_slide(blank)
add_rect(slide, 0, 0, 13.333, 7.5, DARK_BLUE)
add_rect(slide, 0, 0, 13.333, 1.3, RGBColor(0x0A,0x29,0x4A))
add_rect(slide, 0, 1.28, 13.333, 0.07, GOLD)
add_text(slide, "HIGH-YIELD EXAM POINTS", 0.3, 0.1, 12.7, 1.1, 34, bold=True,
         color=WHITE, align=PP_ALIGN.CENTER, anchor=MSO_ANCHOR.MIDDLE)
add_text(slide, "As per Apurba Sastry's Essentials of Medical Microbiology", 0.3, 0.95, 12.7, 0.35,
         14, color=GOLD, align=PP_ALIGN.CENTER, italic=True)

points = [
    ("No animal reservoir", "B. pertussis is EXCLUSIVELY a human pathogen — classic Apurba Sastry MCQ point"),
    ("Most communicable stage", "CATARRHAL stage — maximum organisms in nasopharynx"),
    ("Hallmark lab finding", "LYMPHOCYTOSIS (not neutrophilia) — due to Pertussis Toxin effect on Giα"),
    ("Specimen of choice", "NASOPHARYNGEAL SWAB — deep posterior; NOT throat swab"),
    ("Best diagnostic test", "PCR/NAAT — most sensitive & specific; preferred in later stages"),
    ("Drug of choice", "AZITHROMYCIN — 5 days; preferred in infants; reduces communicability"),
    ("Acellular vaccine must contain", "PT toxoid + FHA (minimum); also pertactin + fimbriae in most"),
    ("PT mechanism", "ADP-ribosylates Giα protein → ↑cAMP → lymphocytosis + immune paralysis"),
    ("TCT effect", "Destroys ciliated cells via IL-1/NO → denuded mucosa → persistent cough"),
    ("BvgA/BvgS system", "Two-component regulator — adhesins expressed FIRST, then toxins"),
]

col1 = points[:5]
col2 = points[5:]
for col_pts, x_base in [(col1, 0.25), (col2, 6.85)]:
    y = 1.45
    for key, val in col_pts:
        add_rect(slide, x_base, y, 6.3, 0.98, RGBColor(0x12,0x3A,0x60))
        add_rect(slide, x_base, y, 0.18, 0.98, GOLD)
        add_text(slide, key, x_base+0.25, y+0.03, 5.9, 0.35, 12.5, bold=True,
                 color=GOLD, anchor=MSO_ANCHOR.TOP)
        add_text(slide, val, x_base+0.25, y+0.38, 5.9, 0.55, 11.5,
                 color=LIGHT_BLUE, wrap=True)
        y += 1.05

footer(slide)

# ══════════════════════════════════════════════════════════════════════════════
# SAVE
# ══════════════════════════════════════════════════════════════════════════════
out_path = "/tmp/workspace/pertussis-ppt/Pertussis_Microbiology_Apurba_Sastry.pptx"
buf = BytesIO()
prs.save(buf)
with open(out_path, "wb") as f:
    f.write(buf.getvalue())
print(f"Saved: {out_path}")
print(f"Slides: {len(prs.slides)}")
cd /tmp/workspace/pertussis-ppt && python build_ppt.py
Pertussis Microbiology Apurba Sastry
Presentation · PPTX
| Slide | Content |
|---|---|
| 1 | Title slide - Pertussis / Whooping Cough |
| 2 | Bacteriology & Cultural Characteristics (Bordet-Gengou, Regan-Lowe) |
| 3 | Virulence Factors - 6 color-coded boxes (PT, FHA, TCT, ACT, Pertactin, Fimbriae) |
| 4 | Pathogenesis with textbook mechanism diagram + SEM electron micrograph |
| 5 | Three Clinical Stages - color-coded columns |
| 6 | Laboratory Diagnosis table + histopathology image |
| 7 | Treatment, Prophylaxis & Vaccination |
| 8 | High-yield Exam Points (Apurba Sastry style, dark theme) |
Make ppt on COVID virus according to Apurba Sastry
SARS-CoV-2 coronavirus structure spike protein electron microscopy
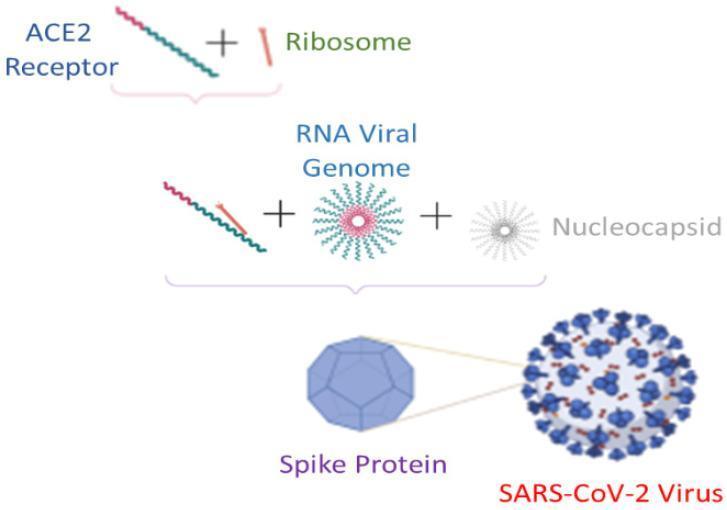
This pathophysiology diagram illustrates the process of SARS-CoV-2 viral self-assembly and structure formation. The visual identifies key molecular components, starting with the interaction between the ACE2 receptor and a ribosome. The pathway progresses to show the synthesis and assembly of the RNA viral genome and the nucleocapsid. Centrally, the diagram focuses on the 'Spike Protein,' which is depicted as a blue, multifaceted polygonal structure. The final stage shows the assembled 'SARS-CoV-2 Virus,' represented as a spherical gray particle with blue spike proteins protruding uniformly from its surface. The illustration utilizes a symbolic flowchart format to teach the relationship between host cell components and viral structural proteins. This content is relevant for immunology and virology, specifically demonstrating the morphological features of the coronavirus and its dependence on host cellular machinery for assembly.
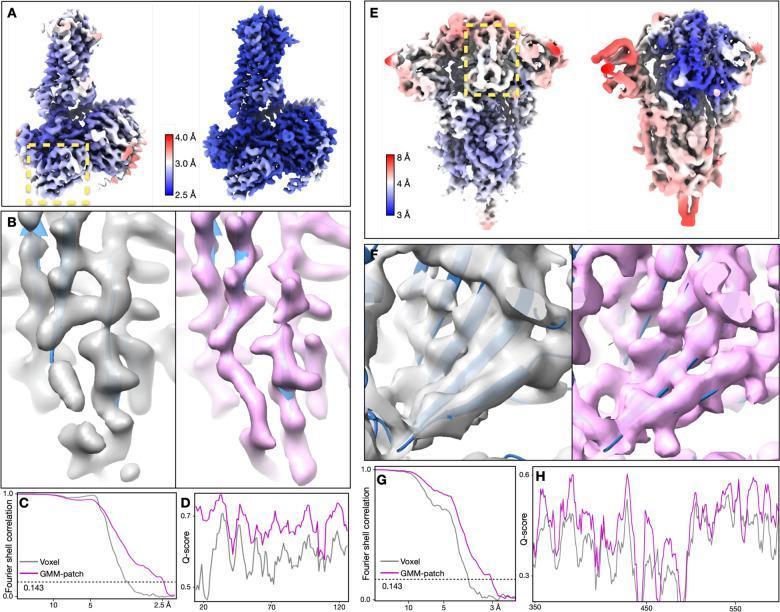
This figure demonstrates structural refinement of Cryo-Electron Microscopy (Cryo-EM) datasets for the GPCR (EMPIAR-10786) and SARS-CoV-2 spike protein (EMPIAR-10492). Panels A and E display 3D surface reconstructions comparing original angle assignments to patch-by-patch and focused refinement results. The models are color-coded by local resolution (Å), where blue represents higher resolution (approx. 2.5–3 Å) and red represents lower resolution (4–8 Å). The refined maps show a significant shift toward blue, indicating improved structural resolvability. Panels B and F provide high-magnification views of real space features, contrasting the original reconstruction (gray) with the refined structure (pink). The refined pink maps exhibit superior density separation and connectivity, particularly in beta-strands and side-chain definitions. Quantitative assessment is provided in panels C, D, G, and H through Fourier Shell Correlation (FSC) curves and Q-score plots. These charts show that GMM-patch refinement (pink line) consistently outperforms standard voxel-based methods (gray line) by extending the resolution threshold and increasing the Q-score across the protein sequence, indicating more accurate atomic modeling.
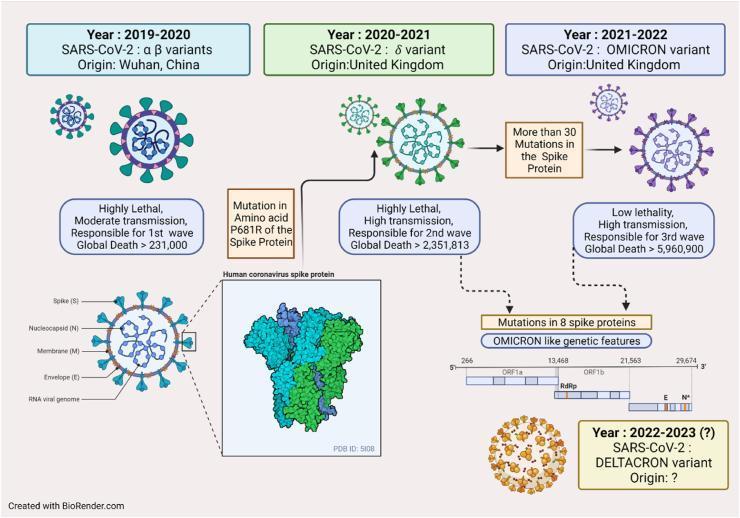
Educational infographic detailing the chronological evolution and pathophysiology of SARS-CoV-2 variants from 2019 to 2023. The diagram illustrates three main stages: the Alpha/Beta variants (2019-2020), the Delta variant (2020-2021) characterized by the P681R spike protein mutation, and the Omicron variant (2021-2022) featuring over 30 mutations in the spike protein. A cross-sectional anatomical diagram of the virion labels the Spike (S), Nucleocapsid (N), Membrane (M), Envelope (E), and RNA viral genome. A molecular inset displays the 3D structure of the human coronavirus spike protein (PDB ID: 5I08). The graphic compares clinical outcomes across variants, noting shifts from 'highly lethal' with moderate transmission in early waves to 'low lethality' with high transmission in the Omicron wave. A genomic map at the bottom shows the ORF1a, ORF1b, RdRp, E, and N gene regions. The infographic concludes with the hypothetical emergence of 'Deltacron' (2022-2023), combining Delta and Omicron features. The content targets medical students and researchers studying viral mutation, pathogenesis, and infectious disease epidemiology.
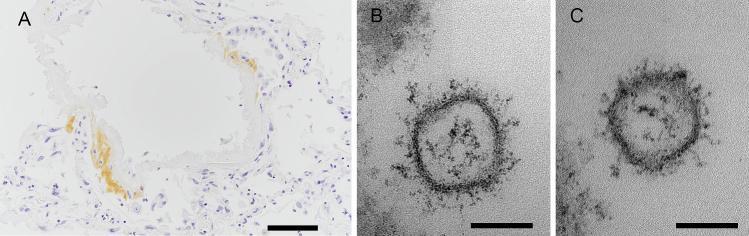
This composite figure demonstrates diagnostic evidence of SARS-CoV-2 infection within lung tissue using immunohistochemistry (IHC) and electron microscopy (EM). Image A (scale bar 100 μm) is an IHC-stained light microscopy section of the right lung. It reveals human lung architecture with clear alveolar spaces; positive brown chromogen immunoreactivity is localized to the hyaline membranes lining the alveolar walls, indicating the presence of SARS-CoV-2 nucleocapsid protein. This finding is characteristic of the exudative phase of diffuse alveolar damage (DAD) in COVID-19. Images B and C (scale bar 100 nm) are high-magnification transmission electron micrographs showing individual viral particles in the extracellular space. The virions are roughly spherical, measuring approximately 100 nm in diameter. Key ultrastructural features include a distinct outer lipid envelope and prominent surface projections (spike proteins), creating a classic 'corona' appearance. The internal electron-dense material represents the viral ribonucleoprotein complex. Together, these images illustrate the correlation between histopathological antigen localization and direct ultrastructural visualization of virions in severe respiratory viral infection.
COVID-19 lung pathology CT scan pneumonia
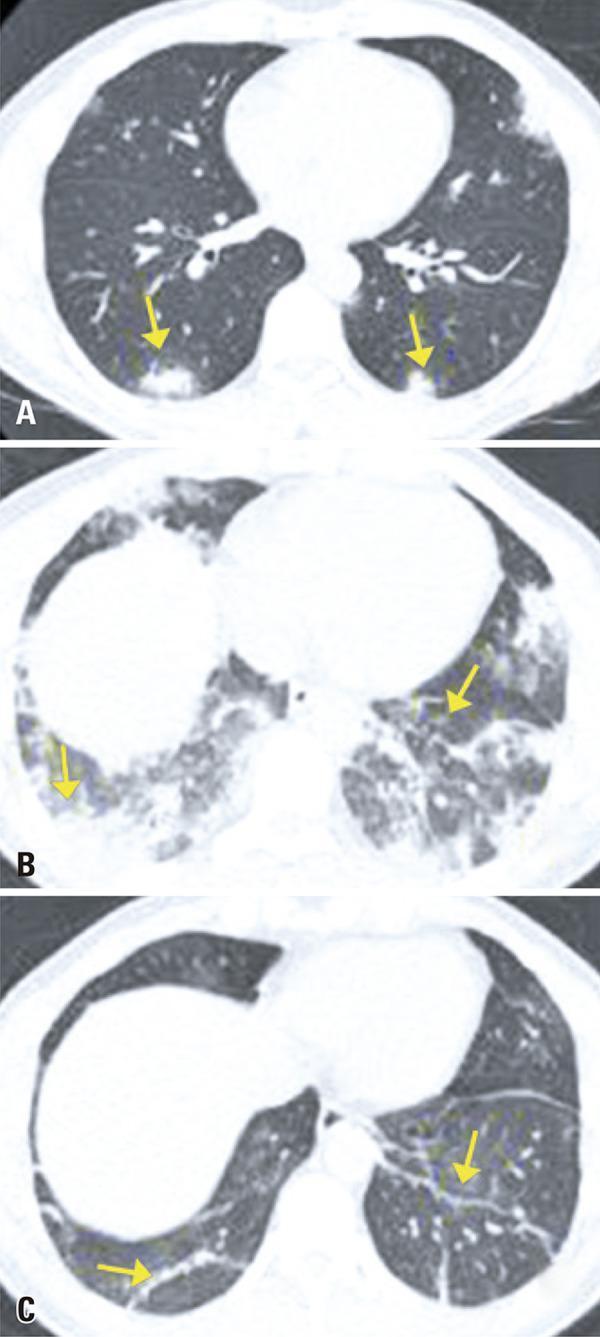
This diagnostic image set consists of three axial chest CT scans (A, B, and C) illustrating the temporal progression of COVID-19 pneumonia in a 44-year-old patient. Scan A (Day 1) demonstrates early-stage pathology characterized by multifocal, peripheral, and subpleural consolidations, primarily in the lower lobes. Scan B (Day 5) shows the peak 'progressive' phase, with a significant increase in the extent and density of pulmonary opacities. The predominant pattern is diffuse consolidation and ground-glass opacities occupying large portions of the lung parenchyma, obscuring normal vascular and interstitial markings. Scan C (Day 10) represents the 'absorption' or late phase, showing a marked reduction in the size and density of consolidations. Residual findings include sparse parenchymal bands and architectural distortion in the peripheral lower fields. This sequence serves as a clinical timeline for viral pneumonia evolution, highlighting the transition from focal inflammation to peak consolidation and subsequent partial resolution with residual linear scarring.
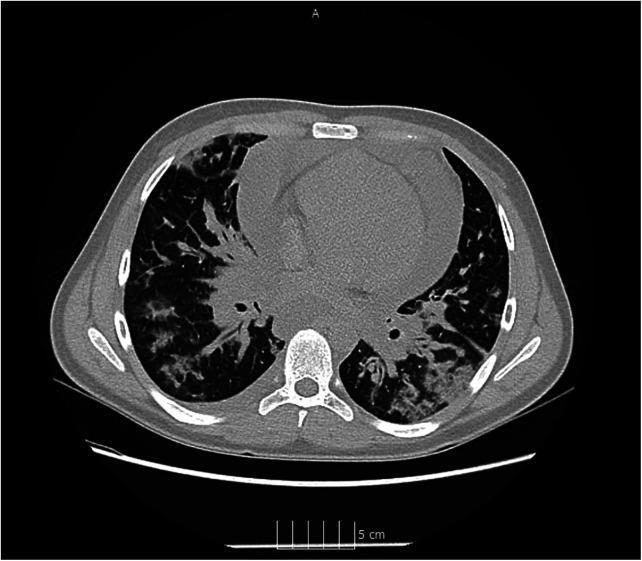
This diagnostic axial CT scan of the chest reveals significant pulmonary and cardiac pathology consistent with severe COVID-19 pneumonia and associated complications. The lung parenchyma shows bilateral, multifocal areas of ground-glass opacities (GGO) and thickened interlobular and intralobular septa, creating a 'crazy-paving' pattern typical of viral interstitial pneumonia. These densifications are distributed across both lungs with a predominant peripheral and posterior involvement. Centrally, the heart is surrounded by a large, circumferential pericardial effusion, visualized as a hypodense fluid layer approximately 26 mm in width encircling the ventricles. The presence of this significant effusion in the context of clinical hypotension and tachycardia suggests cardiac tamponade. This image serves as a high-level educational example of the thoracic complications of SARS-CoV-2, demonstrating both progressive lung damage and life-threatening extrapulmonary cardiovascular involvement.
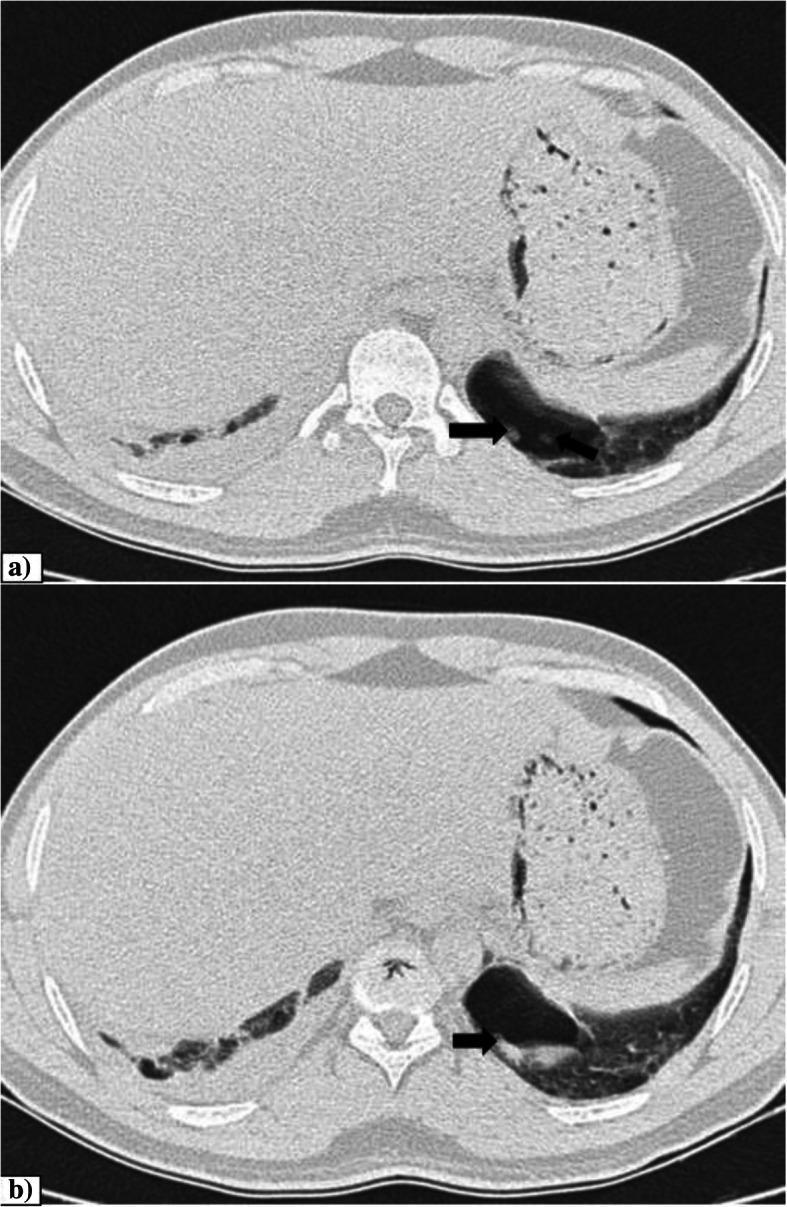
Two contiguous axial CT thorax images (a and b) at the level of the lower lobes demonstrating pulmonary pathology in a patient with COVID-19 pneumonia. The primary finding is a thin-walled, air-filled cavity located in the posterior basal segment of the left lower lobe. Within this cavity, there is a dependent soft tissue component of hemorrhagic density (indicated by black arrows), consistent with intra-cavitary blood clots or hemorrhage. Additionally, the images show a right-sided pleural effusion and peripheral ground-glass opacities with architectural distortion in both lung bases, typical of viral pneumonia progression. The stomach and liver are visible in the upper abdominal portion of the scan. This diagnostic imaging highlights an uncommon complication of necrotizing processes or parenchymal damage in severe respiratory infections, presenting clinically with hemoptysis.
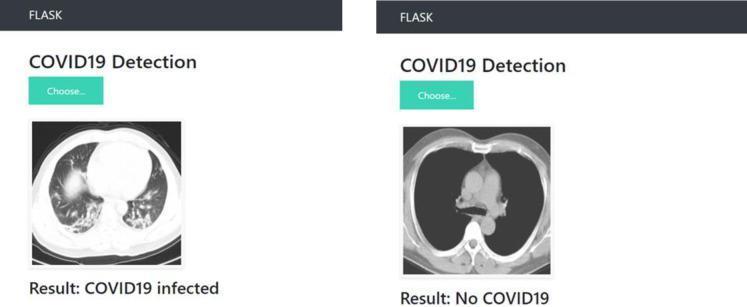
This comparison chart displays two axial computed tomography (CT) scans of the human chest within a web-based diagnostic application interface. The left panel shows a CT scan labeled 'COVID19 infected,' demonstrating significant pulmonary pathology. Key findings include bilateral, peripheral, and basal ground-glass opacities (GGO) with patchy distribution and some areas of subpleural consolidation, which are characteristic of viral pneumonia. These opacities appear as hazy, increased lung density that does not obscure underlying vascular structures. In contrast, the right panel shows a CT scan labeled 'No COVID19,' representing a normal diagnostic image. This scan shows clear, air-filled lung parenchyma with uniform low density and sharply defined pulmonary vessels and mediastinal structures. The visual comparison serves as an educational tool for identifying radiological hallmarks of COVID-19 pneumonia versus healthy lung tissue. The content is suitable for intermediate medical education, focusing on diagnostic radiology and pulmonary infectious diseases.
COVID-19 ACE2 receptor viral entry pathogenesis mechanism
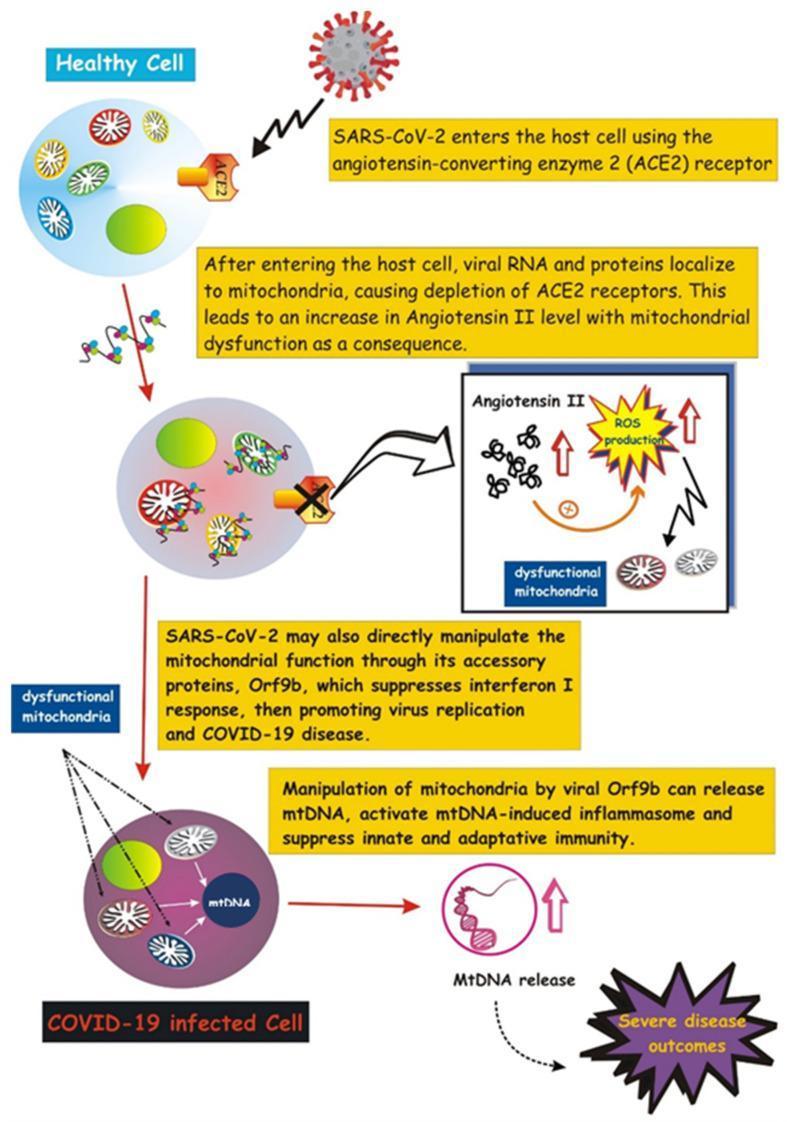
A pathophysiology diagram illustrating the involvement of mitochondria in COVID-19 pathogenesis. The schematic compares a 'Healthy Cell' to a 'COVID-19 Infected Cell' through a sequential signaling pathway. (1) Entry: SARS-CoV-2 virions bind to the surface ACE2 receptor to enter the host cell. (2) Early Infection: Viral RNA and proteins localize to mitochondria, causing ACE2 receptor depletion and elevated Angiotensin II levels. (3) Mechanism: This elevation triggers mitochondrial dysfunction and Reactive Oxygen Species (ROS) production, shown within a detailed box featuring 'dysfunctional mitochondria'. (4) Progression: The viral accessory protein Orf9b directly manipulates mitochondrial function, suppressing the interferon I response and promoting viral replication. (5) Outcome: Mitochondrial manipulation results in the release of mitochondrial DNA (mtDNA), which activates the inflammasome and suppresses innate and adaptive immunity, ultimately leading to 'Severe disease outcomes'. The visual differentiates the healthy state (clear internal organelles) from the infected state (darkened cytoplasm, structural mitochondrial damage, and molecular release).
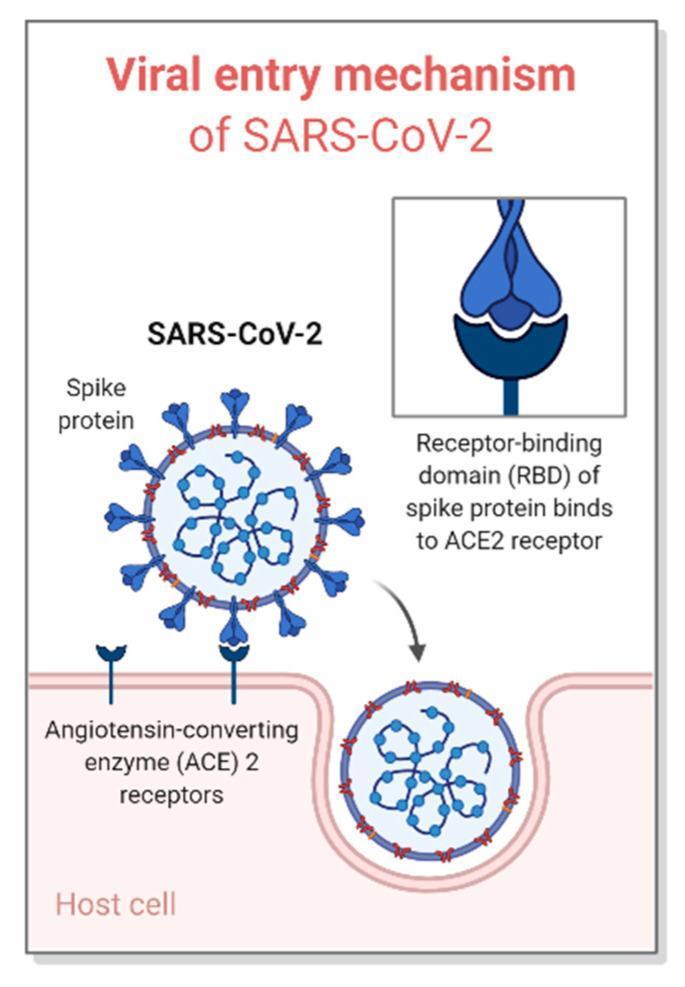
This pathophysiology diagram illustrates the viral entry mechanism of SARS-CoV-2 into a human host cell. The diagram identifies the primary structural components of the SARS-CoV-2 virion, including the lipid membrane envelope and the protruding Spike (S) proteins. A high-magnification inset focuses on the molecular interaction where the Receptor-Binding Domain (RBD) of the spike protein binds specifically to the Angiotensin-Converting Enzyme 2 (ACE2) receptor on the host cell membrane. The ACE2 receptors are depicted as Y-shaped transmembrane proteins embedded in the host cell surface (epithelial lining). The schematic further illustrates the dynamic process of viral penetration, showing the virion being internalized into the host cell via receptor-mediated endocytosis after successful binding. This visual material is designed for medical education regarding virology and infectious disease pathogenesis, specifically highlighting the key role of the S-protein-ACE2 axis in COVID-19 infection.
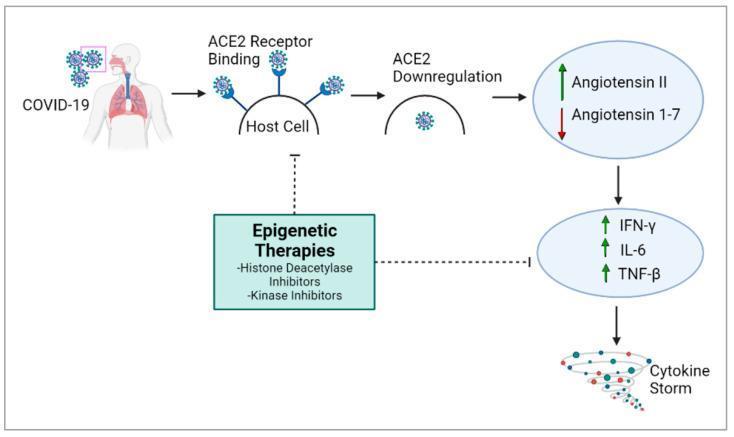
This pathophysiology diagram illustrates the cellular pathway of SARS-CoV-2 (COVID-19) infection and the development of a cytokine storm. The process begins with the virus entering the respiratory system and binding to ACE2 receptors on the host cell membrane. Following viral entry, there is a marked downregulation of ACE2, leading to a biochemical imbalance: an increase in Angiotensin II levels and a decrease in Angiotensin 1-7. This shift triggers the upregulation of proinflammatory cytokines, specifically IFN-̳, IL-6, and TNF-̲, which visually culminate in a depicted 'Cytokine Storm.' The diagram also highlights potential medical interventions via 'Epigenetic Therapies,' including Histone Deacetylase Inhibitors and Kinase Inhibitors. These therapies are shown to potentially inhibit both the initial ACE2 receptor binding and the subsequent inflammatory cytokine production, suggesting a mechanism for mitigating severe COVID-19 pathology.
COVID-19 cytokine storm immune response ARDS severe disease
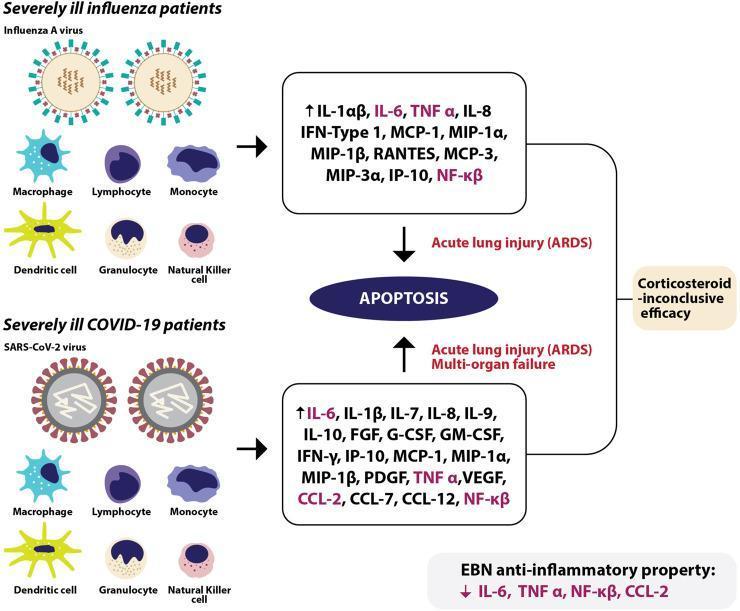
A comparative medical illustration detailing the immunopathology of severe Influenza A and COVID-19 (SARS-CoV-2). The diagram identifies common immune cell types involved in both infections, including macrophages, lymphocytes, monocytes, dendritic cells, granulocytes, and natural killer cells. It lists profiles of elevated cytokines and chemokines (cytokine storm) for both conditions. Severely ill influenza patients show increases in IL-1αβ, IL-6, TNF-α, IL-8, IFN-Type 1, and various MCP/MIP markers, leading to acute respiratory distress syndrome (ARDS) via apoptosis. Severely ill COVID-19 patients exhibit a broader cytokine profile including IL-1β, IL-6 through IL-10, G-CSF, GM-CSF, IFN-γ, and VEGF, resulting in ARDS, apoptosis, and multi-organ failure. The diagram notes the 'inconclusive efficacy' of corticosteroids for these conditions and highlights the anti-inflammatory potential of Edible Bird's Nest (EBN) in reducing specific markers like IL-6, TNF-α, NF-κβ, and CCL-2. This educational resource is designed for immunology and infectious disease study, illustrating disease mechanisms and therapeutic targets.
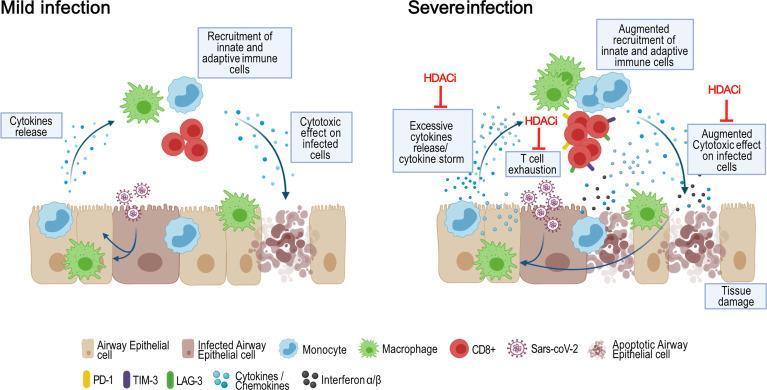
This pathophysiology diagram provides a comparative schematic of the immune response in 'Mild' versus 'Severe' COVID-19 (SARS-CoV-2) infection, highlighting potential therapeutic targets for Histone Deacetylase inhibitors (HDACi). The 'Mild infection' panel illustrates a controlled response where infected airway epithelial cells release cytokines and chemokines, recruiting innate (monocytes, macrophages) and adaptive (CD8+ T cells) immune cells. This results in targeted cytotoxicity and viral clearance. In contrast, the 'Severe infection' panel depicts a dysfunctional response characterized by a 'cytokine storm' (excessive cytokine release), augmented recruitment of immune cells, and significant T cell exhaustion (indicated by PD-1, TIM-3, and LAG-3 markers). This severe state leads to widespread apoptosis of airway epithelial cells and systemic tissue damage. The diagram identifies specific points where HDACi can intervene to modulate the pathology: inhibiting excessive cytokine release, reducing T cell exhaustion, and mitigating augmented cytotoxic effects on lung tissue. Key signaling molecules shown include Type I interferons (IFN ̑α/β) and various pro-inflammatory cytokines.
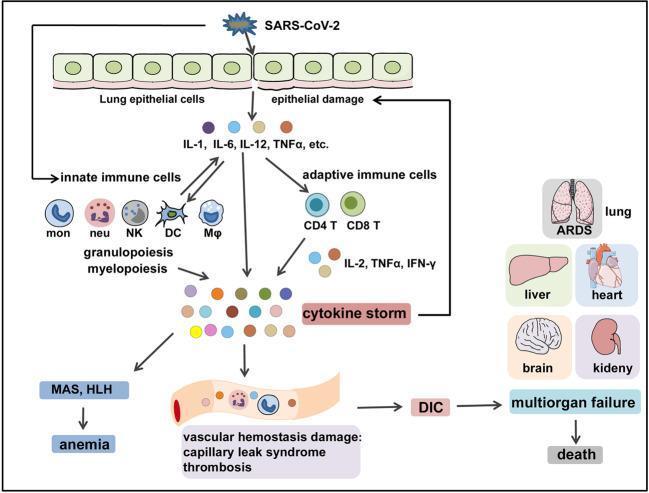
A pathophysiology diagram illustrating the immunopathological cascade of COVID-19 Cytokine Storm (COVID-CS). The process begins with SARS-CoV-2 infecting lung epithelial cells, leading to epithelial damage and the release of pro-inflammatory cytokines (IL-1, IL-6, IL-12, TNFα). This triggers a crosstalk between the innate immune system (monocytes, neutrophils, NK cells, dendritic cells, and macrophages) and adaptive immune system (CD4+ and CD8+ T cells), inducing emergency granulopoiesis and myelopoiesis. The resulting sustained hyperinflammation, labeled as a 'cytokine storm' (comprising IL-2, TNFα, IFN-γ), creates a positive feedback loop of further epithelial damage. Systemic effects shown include Macrophage Activation Syndrome (MAS), Hemophagocytic Lymphohistiocytosis (HLH), and anemia. Vascular hemostasis damage is depicted leading to capillary leak syndrome, thrombosis, and Disseminated Intravascular Coagulation (DIC). The diagram culminates in clinical manifestations including Acute Respiratory Distress Syndrome (ARDS) and multiorgan failure involving the lung, liver, heart, brain, and kidney, eventually leading to death.
mkdir -p /tmp/workspace/covid-ppt && python /tmp/skills/shared/scripts/fetch_images.py \ "https://cdn.orris.care/cdss_images/pmc_clinical_VQA_a275dd96400386e3b831d1ca96d2632a9c58248fe673745f3ccb780ddc731c8e.jpg" \ "https://cdn.orris.care/cdss_images/pmc_clinical_VQA_fcb36cd84ce86f7b40d0dfdcdca0ba3298be5b8a11584709c9d70613e467c402.jpg" \ "https://cdn.orris.care/cdss_images/pmc_clinical_VQA_d20b515184651d3f841bf40f1e14c472f29711aa98ecd92f15ae87f0d8d7f715.jpg" \ "https://cdn.orris.care/cdss_images/pmc_clinical_VQA_39f3bd9dabd1415d09d3506206509e052fea54ec3c71e7e6dc6dd79f5f2486e5.jpg" \ "https://cdn.orris.care/cdss_images/pmc_clinical_VQA_fdeeaac10ea9f4f92b6dc6da0e47133760ce1655cfbc5599b7bd1794e72aae7a.jpg" \ 2>/dev/null | python3 -c "import sys,json; data=json.load(sys.stdin); [print(i, 'OK' if d['base64'] else 'FAIL') for i,d in enumerate(data)]"
~/covid-ppt/build_covid_ppt.py
import json, subprocess, base64
from io import BytesIO
from pptx import Presentation
from pptx.util import Inches, Pt, Emu
from pptx.dml.color import RGBColor
from pptx.enum.text import PP_ALIGN, MSO_ANCHOR

# ── Palette ────────────────────────────────────────────────────────────────────
NAVY        = RGBColor(0x07, 0x28, 0x48)
TEAL        = RGBColor(0x00, 0x7B, 0x83)
LIGHT_TEAL  = RGBColor(0xCC, 0xEE, 0xF0)
WHITE       = RGBColor(0xFF, 0xFF, 0xFF)
GOLD        = RGBColor(0xF4, 0xC84F & 0xFF, 0x1C)
GOLD        = RGBColor(0xF4, 0xC8, 0x1C)
DARK_TEXT   = RGBColor(0x1A, 0x1A, 0x2E)
RED         = RGBColor(0xC0, 0x39, 0x2B)
GREEN       = RGBColor(0x1E, 0x8B, 0x4C)
ORANGE      = RGBColor(0xD3, 0x54, 0x00)
PURPLE      = RGBColor(0x6C, 0x35, 0x83)
SLATE       = RGBColor(0xF2, 0xF6, 0xF9)

IMAGE_URLS = [
    "https://cdn.orris.care/cdss_images/pmc_clinical_VQA_a275dd96400386e3b831d1ca96d2632a9c58248fe673745f3ccb780ddc731c8e.jpg",  # 0 variants infographic
    "https://cdn.orris.care/cdss_images/pmc_clinical_VQA_fcb36cd84ce86f7b40d0dfdcdca0ba3298be5b8a11584709c9d70613e467c402.jpg",  # 1 ACE2 entry diagram
    "https://cdn.orris.care/cdss_images/pmc_clinical_VQA_d20b515184651d3f841bf40f1e14c472f29711aa98ecd92f15ae87f0d8d7f715.jpg",  # 2 CT scan progression
    "https://cdn.orris.care/cdss_images/pmc_clinical_VQA_39f3bd9dabd1415d09d3506206509e052fea54ec3c71e7e6dc6dd79f5f2486e5.jpg",  # 3 EM + IHC lung
    "https://cdn.orris.care/cdss_images/pmc_clinical_VQA_fdeeaac10ea9f4f92b6dc6da0e47133760ce1655cfbc5599b7bd1794e72aae7a.jpg",  # 4 cytokine storm diagram
]

print("Fetching images...")
raw = subprocess.check_output(["python", "/tmp/skills/shared/scripts/fetch_images.py"] + IMAGE_URLS)
imgs = json.loads(raw)
img_data = []
for img in imgs:
    if img["base64"]:
        mime, b64 = img["base64"].split(";base64,", 1)
        img_data.append(BytesIO(base64.b64decode(b64)))
    else:
        img_data.append(None)
print(f"Loaded {sum(1 for x in img_data if x)}/{len(img_data)} images")

# ── Setup ──────────────────────────────────────────────────────────────────────
prs = Presentation()
prs.slide_width  = Inches(13.333)
prs.slide_height = Inches(7.5)
blank = prs.slide_layouts[6]

# ── Helper functions ──────────────────────────────────────────────────────────
def rect(slide, x, y, w, h, color):
    s = slide.shapes.add_shape(1, Inches(x), Inches(y), Inches(w), Inches(h))
    s.line.fill.background()
    s.fill.solid()
    s.fill.fore_color.rgb = color
    return s

def txt(slide, text, x, y, w, h, size, bold=False, color=WHITE,
        align=PP_ALIGN.LEFT, italic=False, anchor=MSO_ANCHOR.TOP, wrap=True):
    tb = slide.shapes.add_textbox(Inches(x), Inches(y), Inches(w), Inches(h))
    tf = tb.text_frame
    tf.word_wrap = wrap
    tf.vertical_anchor = anchor
    tf.margin_left = 0; tf.margin_right = 0
    tf.margin_top = 0;  tf.margin_bottom = 0
    p = tf.paragraphs[0]
    p.alignment = align
    r = p.add_run()
    r.text = text
    r.font.size   = Pt(size)
    r.font.bold   = bold
    r.font.italic = italic
    r.font.color.rgb = color
    r.font.name   = "Calibri"
    return tb

def bullets(slide, lines, x, y, w, h, size, color=DARK_TEXT, use_bullet=True):
    tb = slide.shapes.add_textbox(Inches(x), Inches(y), Inches(w), Inches(h))
    tf = tb.text_frame
    tf.word_wrap = True
    tf.margin_left  = Pt(3)
    tf.margin_right = Pt(3)
    tf.margin_top   = Pt(2)
    tf.margin_bottom= Pt(2)
    first = True
    for item in lines:
        bold = False
        if isinstance(item, tuple):
            text, bold = item
        else:
            text = item
        p = tf.paragraphs[0] if first else tf.add_paragraph()
        first = False
        p.space_after = Pt(2)
        r = p.add_run()
        r.text = ("• " if use_bullet else "") + text
        r.font.size  = Pt(size)
        r.font.bold  = bold
        r.font.color.rgb = color
        r.font.name  = "Calibri"
    return tb

def header(slide, title, subtitle=None):
    rect(slide, 0, 0, 13.333, 1.25, NAVY)
    rect(slide, 0, 1.25, 13.333, 0.07, GOLD)
    txt(slide, title, 0.35, 0.1, 12.6, 0.85, 32, bold=True,
        color=WHITE, align=PP_ALIGN.LEFT, anchor=MSO_ANCHOR.MIDDLE)
    if subtitle:
        txt(slide, subtitle, 0.35, 0.88, 12.6, 0.38, 13,
            color=GOLD, align=PP_ALIGN.LEFT, italic=True)

def footer(slide, note="COVID-19 | SARS-CoV-2 | As per Apurba Sastry's Essentials of Medical Microbiology"):
    rect(slide, 0, 7.22, 13.333, 0.28, NAVY)
    txt(slide, note, 0.3, 7.22, 12.7, 0.28, 10, color=RGBColor(0xAA,0xCC,0xFF),
        align=PP_ALIGN.CENTER, anchor=MSO_ANCHOR.MIDDLE)

def add_pic(slide, img_io, x, y, w, h=None):
    if img_io is None: return
    img_io.seek(0)
    if h:
        slide.shapes.add_picture(img_io, Inches(x), Inches(y), Inches(w), Inches(h))
    else:
        slide.shapes.add_picture(img_io, Inches(x), Inches(y), Inches(w))

def label(slide, text, x, y, w, h, bg, fg=WHITE, size=11):
    rect(slide, x, y, w, h, bg)
    txt(slide, text, x+0.05, y, w-0.1, h, size, bold=True, color=fg,
        align=PP_ALIGN.CENTER, anchor=MSO_ANCHOR.MIDDLE)

# ══════════════════════════════════════════════════════════════════════════════
# SLIDE 1 — Title
# ══════════════════════════════════════════════════════════════════════════════
s = prs.slides.add_slide(blank)
rect(s, 0, 0, 13.333, 7.5, NAVY)
rect(s, 0, 2.5, 13.333, 2.6, TEAL)
rect(s, 0, 2.44, 13.333, 0.09, GOLD)
rect(s, 0, 5.0,  13.333, 0.09, GOLD)

txt(s, "COVID-19", 0.5, 0.55, 12.3, 1.6, 80, bold=True,
    color=WHITE, align=PP_ALIGN.CENTER, anchor=MSO_ANCHOR.MIDDLE)
txt(s, "Coronavirus Disease 2019", 0.5, 2.0, 12.3, 0.55, 26,
    color=GOLD, align=PP_ALIGN.CENTER)
txt(s, "Causative Agent: SARS-CoV-2  |  β-Coronavirus  |  Enveloped, +ssRNA Virus",
    0.5, 2.6, 12.3, 0.55, 19, color=WHITE, align=PP_ALIGN.CENTER,
    anchor=MSO_ANCHOR.MIDDLE)
txt(s, "Single-Stranded RNA Virus  |  Genome: ~30 kb (largest RNA virus genome)",
    0.5, 3.15, 12.3, 0.45, 15, color=LIGHT_TEAL, align=PP_ALIGN.CENTER)
txt(s, "Declared WHO Pandemic: March 11, 2020",
    0.5, 3.62, 12.3, 0.4, 14, color=GOLD, align=PP_ALIGN.CENTER)
txt(s, "As per Apurba Sastry's Essentials of Medical Microbiology",
    0.5, 5.2, 12.3, 0.45, 14, color=GOLD, align=PP_ALIGN.CENTER, italic=True)
txt(s, "Microbiology  |  MBBS Second Professional",
    0.5, 5.7, 12.3, 0.4, 13, color=RGBColor(0xAA,0xCC,0xFF), align=PP_ALIGN.CENTER)

# ══════════════════════════════════════════════════════════════════════════════
# SLIDE 2 — Taxonomy, Structure & Morphology
# ══════════════════════════════════════════════════════════════════════════════
s = prs.slides.add_slide(blank)
rect(s, 0, 0, 13.333, 7.5, SLATE)
header(s, "Taxonomy, Structure & Morphology of SARS-CoV-2")
footer(s)

# Left: Taxonomy & classification
rect(s, 0.25, 1.45, 5.9, 5.7, WHITE)
rect(s, 0.25, 1.45, 5.9, 0.42, NAVY)
txt(s, "TAXONOMY & CLASSIFICATION", 0.3, 1.47, 5.8, 0.38, 12.5, bold=True,
    color=WHITE, anchor=MSO_ANCHOR.MIDDLE)
bullets(s, [
    ("Family: Coronaviridae", True),
    ("Subfamily: Coronavirinae", False),
    ("Genus: Betacoronavirus (β-CoV)", True),
    ("Sub-genus: Sarbecovirus", False),
    ("Species: SARS-CoV-2 (novel coronavirus)", True),
    "",
    ("Other β-CoVs: SARS-CoV-1, MERS-CoV", True),
    ("Shares ~80% genome identity with SARS-CoV-1", False),
    ("Shares ~50% genome identity with MERS-CoV", False),
    "",
    ("Animal reservoir: Horseshoe bats (presumed)", True),
    ("Possible intermediate host before human spread", False),
], 0.35, 1.95, 5.7, 5.1, 12.5, color=DARK_TEXT)

# Right: Structural proteins
rect(s, 6.4, 1.45, 6.65, 5.7, WHITE)
rect(s, 6.4, 1.45, 6.65, 0.42, TEAL)
txt(s, "VIRAL STRUCTURE — 4 STRUCTURAL PROTEINS", 6.45, 1.47, 6.55, 0.38, 12.5,
    bold=True, color=WHITE, anchor=MSO_ANCHOR.MIDDLE)

struct_items = [
    ("S — Spike Glycoprotein", TEAL,
     "Most important; has RBD (Receptor Binding Domain)\nBinds ACE2 receptor on host cells\nS1 subunit: binds ACE2 | S2 subunit: membrane fusion\nCleaved by TMPRSS2 & cathepsin L\nTarget of ALL vaccines & monoclonal antibodies"),
    ("N — Nucleocapsid Protein", NAVY,
     "Surrounds the RNA genome\nHelical nucleocapsid\nTarget of antigen (rapid) diagnostic tests"),
    ("M — Membrane Protein", RGBColor(0x1E,0x8B,0x4C),
     "Most abundant structural protein\nMaintains viral shape\nCentral organizer of assembly"),
    ("E — Envelope Protein", ORANGE,
     "Small, involved in viral assembly\nPlays role in pathogenesis\nIon channel activity"),
]
y_s = 1.95
for name, col, desc in struct_items:
    rect(s, 6.45, y_s, 6.5, 0.28, col)
    txt(s, name, 6.5, y_s, 6.4, 0.27, 12, bold=True, color=WHITE, anchor=MSO_ANCHOR.MIDDLE)
    tb = s.shapes.add_textbox(Inches(6.5), Inches(y_s+0.3), Inches(6.4), Inches(0.8))
    tf = tb.text_frame; tf.word_wrap = True
    tf.margin_left=Pt(2);tf.margin_right=Pt(2);tf.margin_top=Pt(1);tf.margin_bottom=Pt(1)
    for j, line in enumerate(desc.split("\n")):
        p = tf.paragraphs[0] if j==0 else tf.add_paragraph()
        r = p.add_run(); r.text = "• " + line
        r.font.size=Pt(11); r.font.name="Calibri"; r.font.color.rgb=DARK_TEXT
    y_s += 1.2

# ══════════════════════════════════════════════════════════════════════════════
# SLIDE 3 — Epidemiology & Transmission
# ══════════════════════════════════════════════════════════════════════════════
s = prs.slides.add_slide(blank)
rect(s, 0, 0, 13.333, 7.5, RGBColor(0xF0,0xF4,0xFF))
header(s, "Epidemiology & Transmission",
       "First reported: Wuhan, Hubei province, China — December 2019 | WHO Pandemic declared: March 11, 2020")
footer(s)

# Timeline box
rect(s, 0.25, 1.42, 7.1, 5.75, WHITE)
rect(s, 0.25, 1.42, 7.1, 0.42, NAVY)
txt(s, "EPIDEMIOLOGY TIMELINE", 0.3, 1.44, 7.0, 0.38, 13, bold=True,
    color=WHITE, anchor=MSO_ANCHOR.MIDDLE)

timeline = [
    ("Dec 2019", "Cluster of viral pneumonia cases in Wuhan, China", TEAL),
    ("Jan 11-12, 2020", "Genomic sequence of SARS-CoV-2 published by Chinese scientists", NAVY),
    ("Jan 20-21, 2020", "Human-to-human transmission confirmed; 1st US case (Washington State)", ORANGE),
    ("Feb 2020", "Spread to Asia, North America, Europe, Middle East, Africa", RGBColor(0x6C,0x35,0x83)),
    ("Mar 11, 2020", "WHO declared COVID-19 a PANDEMIC — 219 countries & territories affected", RED),
    ("Ongoing", "Variants emerging: Alpha, Beta, Gamma, Delta (India), Omicron", RGBColor(0x1E,0x8B,0x4C)),
]
y_t = 1.92
for date, event, col in timeline:
    rect(s, 0.3, y_t, 1.6, 0.7, col)
    txt(s, date, 0.32, y_t, 1.56, 0.7, 10.5, bold=True, color=WHITE,
        align=PP_ALIGN.CENTER, anchor=MSO_ANCHOR.MIDDLE, wrap=True)
    rect(s, 1.92, y_t, 5.3, 0.7, RGBColor(0xF8,0xF9,0xFF))
    txt(s, event, 2.0, y_t+0.05, 5.1, 0.6, 11.5, color=DARK_TEXT, wrap=True)
    y_t += 0.8

# Right: Transmission box
rect(s, 7.55, 1.42, 5.5, 5.75, WHITE)
rect(s, 7.55, 1.42, 5.5, 0.42, TEAL)
txt(s, "TRANSMISSION", 7.6, 1.44, 5.4, 0.38, 13, bold=True,
    color=WHITE, anchor=MSO_ANCHOR.MIDDLE)
bullets(s, [
    ("Route: Respiratory droplets (primary)", True),
    ("  Coughing/sneezing → droplets land on\n  nose, eyes, face of another person", False),
    ("Aerosol transmission also demonstrated", True),
    ("  Fine respiratory droplets can be inhaled", False),
    ("Fomite transmission (indirect)", True),
    ("  Hand-to-face after touching contaminated\n  surfaces", False),
    ("UNIQUE FEATURE:", True),
    ("  Asymptomatic infected persons transmit virus", False),
    ("Viral stability on surfaces:", True),
    ("  Aerosol: 2–4 hours", False),
    ("  Plastic: 72 hours", False),
    ("  Steel: 48 hours", False),
    ("  Cardboard: 24 hours", False),
    ("  Copper: 8 hours", False),
], 7.65, 1.92, 5.3, 5.1, 12, color=DARK_TEXT)

# Variant infographic image
# (will be on slide 5 to save space)

# ══════════════════════════════════════════════════════════════════════════════
# SLIDE 4 — Pathogenesis (with ACE2 entry image)
# ══════════════════════════════════════════════════════════════════════════════
s = prs.slides.add_slide(blank)
rect(s, 0, 0, 13.333, 7.5, RGBColor(0xF8,0xF9,0xFF))
header(s, "Pathogenesis of COVID-19",
       "Non-cytopathic initially; damage = viral + immune-mediated (cytokine storm)")
footer(s)

# Steps column
steps = [
    (TEAL,   "Step 1 — Entry",
     "Respiratory tract → nasopharyngeal/oropharyngeal cells are initial targets. Spike RBD binds ACE2 receptor."),
    (NAVY,   "Step 2 — S protein cleavage",
     "Cellular TMPRSS2 & cathepsin L cleave S1/S2. S2 mediates viral envelope fusion with cell membrane → endosomal entry."),
    (ORANGE, "Step 3 — Replication",
     "Viral genome released in cytoplasm → translated into polyprotein → cleaved by host & viral proteases into RdRp, ExoN, and nonstructural proteins. Subgenomic RNAs → structural proteins."),
    (PURPLE, "Step 4 — Assembly & Release",
     "Virus assembled in cytoplasm; acquires envelope from ER-Golgi membranes (with Spike, M, E proteins); released by exocytosis."),
    (RED,    "Step 5 — Immune Response & Damage",
     "IFN-I suppressed by SARS-CoV-2 NSPs. Proinflammatory cytokines (IL-1β, IL-6, TNF-α) → cytokine storm in severe cases → ARDS, DIC, multi-organ failure."),
]
y_p = 1.45
for col, title, body in steps:
    rect(s, 0.25, y_p, 7.2, 0.27, col)
    txt(s, title, 0.3, y_p, 7.1, 0.26, 11.5, bold=True, color=WHITE, anchor=MSO_ANCHOR.MIDDLE)
    rect(s, 0.25, y_p+0.27, 7.2, 0.72, RGBColor(0xF0,0xF4,0xFF))
    tb = s.shapes.add_textbox(Inches(0.35), Inches(y_p+0.3), Inches(7.0), Inches(0.67))
    tf = tb.text_frame; tf.word_wrap = True
    tf.margin_left=Pt(2);tf.margin_right=Pt(2);tf.margin_top=Pt(1);tf.margin_bottom=Pt(1)
    p = tf.paragraphs[0]; r = p.add_run(); r.text = body
    r.font.size=Pt(11); r.font.name="Calibri"; r.font.color.rgb=DARK_TEXT
    y_p += 1.04

# Right: ACE2 entry image
txt(s, "SARS-CoV-2 Viral Entry via ACE2 Receptor", 7.65, 1.45, 5.4, 0.38, 11.5,
    bold=True, color=TEAL, align=PP_ALIGN.CENTER)
add_pic(s, img_data[1], 7.6, 1.85, 5.45, 3.3)
txt(s, "Spike RBD → ACE2 binding → TMPRSS2 cleavage → membrane fusion → viral entry",
    7.6, 5.18, 5.4, 0.45, 10, color=RGBColor(0x55,0x55,0x55),
    italic=True, align=PP_ALIGN.CENTER, wrap=True)

# Cytokine storm image
txt(s, "Cytokine Storm Cascade:", 7.65, 5.68, 5.4, 0.3, 11, bold=True, color=RED, align=PP_ALIGN.CENTER)
add_pic(s, img_data[4], 7.6, 5.98, 5.45, 1.22)

# ══════════════════════════════════════════════════════════════════════════════
# SLIDE 5 — Variants + ACE2 target organs
# ══════════════════════════════════════════════════════════════════════════════
s = prs.slides.add_slide(blank)
rect(s, 0, 0, 13.333, 7.5, SLATE)
header(s, "SARS-CoV-2 Variants & ACE2 Target Organs",
       "Mutations in Spike RBD → ↑ACE2 affinity → ↑infectivity & transmissibility")
footer(s)

# Left: variants table
rect(s, 0.25, 1.45, 6.5, 5.7, WHITE)
rect(s, 0.25, 1.45, 6.5, 0.42, NAVY)
txt(s, "VARIANTS OF CONCERN (VOC)", 0.3, 1.47, 6.4, 0.38, 13, bold=True,
    color=WHITE, anchor=MSO_ANCHOR.MIDDLE)

# Table header row
for text, xp, wp in [("VARIANT", 0.3, 1.5), ("PANGO", 1.82, 1.4), ("ORIGIN", 3.25, 1.6), ("KEY FEATURES", 4.87, 1.75)]:
    rect(s, xp, 1.95, wp, 0.35, TEAL)
    txt(s, text, xp+0.05, 1.95, wp-0.1, 0.35, 10.5, bold=True, color=WHITE,
        align=PP_ALIGN.CENTER, anchor=MSO_ANCHOR.MIDDLE)

variants = [
    ("Alpha (α)",   "B.1.1.7",  "UK",          "↑transmissibility; N501Y mutation",        RGBColor(0xE8,0xF4,0xFF)),
    ("Beta (β)",    "B.1.351",  "S. Africa",   "Immune escape; E484K mutation",             WHITE),
    ("Gamma (γ)",   "P.1",      "Brazil",      "Similar to Beta; E484K + K417T",            RGBColor(0xE8,0xF4,0xFF)),
    ("Delta (δ)",   "B.1.617.2","India",       "P681R mutation; very high transmissibility",WHITE),
    ("Omicron (ο)", "B.1.1.529","S. Africa",   ">30 spike mutations; high immune escape;\nhigh transmission, lower severity", RGBColor(0xE8,0xF4,0xFF)),
    ("D614G",       "Multiple", "Global",      "First dominant mutation; ↑viral load in\nupper RT; ↑human-to-human spread", WHITE),
]
y_v = 2.35
for var, pango, origin, feat, bg in variants:
    row_h = 0.65 if "\n" in feat else 0.52
    for text, xp, wp in [(var, 0.3, 1.5), (pango, 1.82, 1.4), (origin, 3.25, 1.6)]:
        rect(s, xp, y_v, wp, row_h, bg)
        txt(s, text, xp+0.05, y_v+0.02, wp-0.1, row_h-0.04, 11,
            color=DARK_TEXT, anchor=MSO_ANCHOR.MIDDLE, align=PP_ALIGN.CENTER, wrap=True)
    rect(s, 4.87, y_v, 1.75, row_h, bg)
    tb = s.shapes.add_textbox(Inches(4.92), Inches(y_v+0.02), Inches(1.65), Inches(row_h-0.04))
    tf = tb.text_frame; tf.word_wrap=True
    tf.margin_left=Pt(2);tf.margin_right=Pt(2);tf.margin_top=Pt(1);tf.margin_bottom=Pt(1)
    for j, line in enumerate(feat.split("\n")):
        p = tf.paragraphs[0] if j==0 else tf.add_paragraph()
        r = p.add_run(); r.text = line
        r.font.size=Pt(10); r.font.name="Calibri"; r.font.color.rgb=DARK_TEXT
    y_v += row_h + 0.03

# Right: variants infographic image + ACE2 target organs
txt(s, "SARS-CoV-2 Variant Evolution & Structure", 7.0, 1.45, 6.1, 0.38, 11.5,
    bold=True, color=NAVY, align=PP_ALIGN.CENTER)
add_pic(s, img_data[0], 6.95, 1.85, 6.1, 3.4)

# ACE2 organ targets
rect(s, 6.95, 5.35, 6.1, 1.8, WHITE)
rect(s, 6.95, 5.35, 6.1, 0.32, TEAL)
txt(s, "ACE2 RECEPTOR — TARGET ORGANS", 7.0, 5.37, 6.0, 0.28, 11, bold=True,
    color=WHITE, anchor=MSO_ANCHOR.MIDDLE)
bullets(s, [
    ("Lungs (alveolar type II cells) — PRIMARY target", True),
    ("Heart (myocardial cells)", False),
    ("Kidneys (tubular cells)", False),
    ("Intestine (enterocytes, cholangiocytes)", False),
    ("Blood vessels (endothelial cells)", False),
    ("Brain, testes, bladder urothelial cells", False),
], 7.0, 5.72, 6.0, 1.35, 11, color=DARK_TEXT)

# ══════════════════════════════════════════════════════════════════════════════
# SLIDE 6 — Clinical Features
# ══════════════════════════════════════════════════════════════════════════════
s = prs.slides.add_slide(blank)
rect(s, 0, 0, 13.333, 7.5, RGBColor(0xF0,0xF8,0xFF))
header(s, "Clinical Features of COVID-19",
       "Incubation period: 2–14 days (median 5–6 days)  |  Symptom onset: within ~11.5 days")
footer(s)

# 3 severity columns
sev_data = [
    ("MILD / MODERATE\n(~80% of cases)", TEAL, [
        ("Fever or chills", False),
        ("Dry cough", True),
        ("Shortness of breath", False),
        ("Fatigue, myalgia", False),
        ("Headache", False),
        ("Anosmia / Ageusia", True),
        ("  (Loss of smell/taste — ~10%)", False),
        ("Sore throat, rhinorrhea", False),
        ("Nausea, vomiting, diarrhea", False),
        ("Maculopapular / urticarial rash", False),
    ]),
    ("SEVERE\n(~15% of cases)", ORANGE, [
        ("Persistent breathlessness", True),
        ("Chest pain/pressure", True),
        ("Viral pneumonia", True),
        ("Hypoxemia (SpO₂ <94%)", False),
        ("New confusion / altered sensorium", False),
        ("Bluish lips or face (cyanosis)", False),
        ("Inability to stay awake", False),
        ("Ground-glass opacities on CT", True),
        ("High D-dimer, elevated CRP, LDH", False),
    ]),
    ("CRITICAL\n(~5% of cases)", RED, [
        ("ARDS — Acute Respiratory Distress Syndrome", True),
        ("Septic shock", False),
        ("Multi-organ dysfunction", True),
        ("Cytokine storm", True),
        ("Pulmonary hypertension", False),
        ("Thrombosis (large & small vessels)", True),
        ("DIC (Disseminated Intravascular\n Coagulation)", False),
        ("Neurological: stroke, encephalopathy", False),
        ("Myocarditis, pericardial effusion", False),
    ]),
]
x_c = [0.25, 4.6, 8.95]
for i, (title, color, pts) in enumerate(sev_data):
    x = x_c[i]
    rect(s, x, 1.45, 4.1, 5.65, WHITE)
    rect(s, x, 1.45, 4.1, 0.62, color)
    txt(s, title, x+0.1, 1.47, 3.9, 0.58, 13.5, bold=True,
        color=WHITE, align=PP_ALIGN.CENTER, anchor=MSO_ANCHOR.MIDDLE, wrap=True)
    bullets(s, pts, x+0.15, 2.12, 3.8, 4.9, 12.5, color=DARK_TEXT)

# Risk factors footer strip
rect(s, 0.25, 7.05, 12.8, 0.22, RGBColor(0xFF,0xF0,0xD0))
txt(s, "Risk factors for severe disease: Age >60 yrs, Obesity, Diabetes, HTN, CVD, CKD, Malignancy, Immunocompromise",
    0.3, 7.05, 12.7, 0.22, 10.5, color=DARK_TEXT,
    align=PP_ALIGN.CENTER, anchor=MSO_ANCHOR.MIDDLE)

# ══════════════════════════════════════════════════════════════════════════════
# SLIDE 7 — Special Conditions: Long COVID, MIS-C, CT findings
# ══════════════════════════════════════════════════════════════════════════════
s = prs.slides.add_slide(blank)
rect(s, 0, 0, 13.333, 7.5, SLATE)
header(s, "Complications, Long COVID & Imaging Findings")
footer(s)

# Left panel: special conditions
rect(s, 0.25, 1.45, 6.2, 5.7, WHITE)

rect(s, 0.25, 1.45, 6.2, 0.38, RED)
txt(s, "LONG COVID / PASC (Post-Acute Sequelae of SARS-CoV-2)", 0.3, 1.47, 6.1, 0.34, 11.5,
    bold=True, color=WHITE, anchor=MSO_ANCHOR.MIDDLE)
bullets(s, [
    ("Fatigue, body aches, shortness of breath", False),
    ("Brain fog (difficulty concentrating)", False),
    ("Inability to exercise, headache, sleep disturbance", False),
    ("May last weeks to months after acute illness", False),
    ("Possible chronic damage: lungs, heart, kidneys, brain", True),
], 0.35, 1.88, 5.9, 1.5, 12, color=DARK_TEXT)

rect(s, 0.25, 3.44, 6.2, 0.35, PURPLE)
txt(s, "MIS-C — Multisystem Inflammatory Syndrome in Children", 0.3, 3.45, 6.1, 0.32, 11.5,
    bold=True, color=WHITE, anchor=MSO_ANCHOR.MIDDLE)
bullets(s, [
    ("Post-COVID inflammatory syndrome in children", False),
    ("Features: myocarditis, shock", False),
    ("Similar to Kawasaki disease — coronary artery aneurysms", True),
    ("Managed with IVIG + steroids", False),
], 0.35, 3.84, 5.9, 1.1, 12, color=DARK_TEXT)

rect(s, 0.25, 4.98, 6.2, 0.35, ORANGE)
txt(s, "OTHER COMPLICATIONS", 0.3, 4.99, 6.1, 0.32, 11.5, bold=True,
    color=WHITE, anchor=MSO_ANCHOR.MIDDLE)
bullets(s, [
    ("Bacterial superinfections (secondary pneumonia)", False),
    ("Guillain-Barré syndrome (acute flaccid myelitis)", True),
    ("Stroke, encephalopathy, peripheral neuropathy", False),
    ("Pulmonary fibrosis (post-ARDS)", False),
    ("Thromboembolism (PE, DVT)", True),
], 0.35, 5.38, 5.9, 1.72, 12, color=DARK_TEXT)

# Right: CT scan image
txt(s, "CT Chest — COVID-19 Pneumonia Progression", 6.65, 1.45, 6.4, 0.38, 11.5,
    bold=True, color=NAVY, align=PP_ALIGN.CENTER)
add_pic(s, img_data[2], 6.6, 1.85, 6.45, 3.5)
txt(s, "Day 1: Peripheral consolidations  |  Day 5: Peak ground-glass opacities  |  Day 10: Resolution",
    6.6, 5.38, 6.45, 0.42, 10, color=RGBColor(0x44,0x44,0x44),
    italic=True, align=PP_ALIGN.CENTER, wrap=True)

# IHC/EM image below
add_pic(s, img_data[3], 6.6, 5.82, 3.2, 1.38)
txt(s, "IHC + EM: SARS-CoV-2\nnucleoprotein in alveolar\nhyaline membranes (DAD)",
    9.82, 5.85, 3.2, 1.3, 9.5, color=DARK_TEXT, italic=True, wrap=True)

# ══════════════════════════════════════════════════════════════════════════════
# SLIDE 8 — Laboratory Diagnosis
# ══════════════════════════════════════════════════════════════════════════════
s = prs.slides.add_slide(blank)
rect(s, 0, 0, 13.333, 7.5, RGBColor(0xF8,0xFB,0xFF))
header(s, "Laboratory Diagnosis of COVID-19",
       "Specimen: Nasopharyngeal swab (NPS) — preferred  |  Also: oropharyngeal swab, BAL, sputum")
footer(s)

# Table
rect(s, 0.25, 1.45, 12.8, 0.45, NAVY)
for text, xp, wp in [("TEST", 0.3, 3.0), ("SPECIMEN", 3.35, 2.5), ("DETAILS", 5.9, 4.7), ("NOTE", 10.65, 2.25)]:
    txt(s, text, xp, 1.47, wp, 0.41, 12, bold=True, color=WHITE,
        align=PP_ALIGN.CENTER, anchor=MSO_ANCHOR.MIDDLE)

rows = [
    ("RT-PCR\n(Gold Standard)", "NPS/OPS\nBAL, sputum", "Detects SARS-CoV-2 RNA (genes: RdRp, E, N, ORF1ab)\nMost sensitive & specific; results in 4–6 hrs", "Test of choice\nfor active infection", RGBColor(0xE0,0xF0,0xFF)),
    ("Rapid Antigen Test\n(RAT)", "NPS\nNasal swab", "Detects nucleocapsid (N) protein\nResults in 15–30 minutes; less sensitive\nConfirm negatives by RT-PCR if high suspicion", "Point-of-care;\nscreen & triage", WHITE),
    ("BioFire RP2.1 Panel\n(NAT-based)", "NPS", "Nucleic acid–based multiplex panel\nDetects 15 viral + 4 bacterial pathogens\nIncludes common cold CoVs + SARS-CoV-2\nFDA emergency use authorization", "Useful in ICU/\nrespiratory panels", RGBColor(0xE0,0xF0,0xFF)),
    ("Serology\n(Antibody Test)", "Serum/Blood", "Detects anti-Spike or anti-N IgG/IgM\nNOT for diagnosing current infection\nUseful for: seroprevalence, past exposure, vaccine response", "Epidemiology &\nsurveillance only", WHITE),
    ("CBC (Blood Count)", "Blood", "Lymphopenia (hallmark of severe COVID-19)\nNeutrophilia in severe/bacterial co-infection\nElevated D-dimer, CRP, LDH, ferritin in severe disease", "Lymphopenia =\nbad prognostic sign", RGBColor(0xE0,0xF0,0xFF)),
]
y_t = 1.95
for test, spec, detail, note, bg in rows:
    rh = 0.82
    for text, xp, wp in [(test, 0.3, 3.0), (spec, 3.35, 2.5), (detail, 5.9, 4.7), (note, 10.65, 2.25)]:
        rect(s, xp, y_t, wp, rh, bg)
        tb = s.shapes.add_textbox(Inches(xp+0.05), Inches(y_t+0.03), Inches(wp-0.1), Inches(rh-0.06))
        tf = tb.text_frame; tf.word_wrap=True
        tf.margin_left=Pt(2);tf.margin_right=Pt(2);tf.margin_top=Pt(1);tf.margin_bottom=Pt(1)
        for j, line in enumerate(text.split("\n")):
            p = tf.paragraphs[0] if j==0 else tf.add_paragraph()
            r = p.add_run(); r.text = line
            r.font.size=Pt(11); r.font.name="Calibri"; r.font.color.rgb=DARK_TEXT
            r.font.bold=(j==0 and text==test)
    y_t += rh + 0.02

# ══════════════════════════════════════════════════════════════════════════════
# SLIDE 9 — Treatment & Prevention
# ══════════════════════════════════════════════════════════════════════════════
s = prs.slides.add_slide(blank)
rect(s, 0, 0, 13.333, 7.5, RGBColor(0xF2,0xFB,0xF4))
header(s, "Treatment, Prevention & Vaccination")
footer(s)

# Left: Treatment
rect(s, 0.25, 1.45, 6.0, 5.7, WHITE)
rect(s, 0.25, 1.45, 6.0, 0.38, GREEN)
txt(s, "TREATMENT", 0.3, 1.47, 5.9, 0.34, 14, bold=True, color=WHITE, anchor=MSO_ANCHOR.MIDDLE)
bullets(s, [
    ("Antivirals:", True),
    ("  Remdesivir — RNA-dependent RNA polymerase inhibitor;", False),
    ("  approved for hospitalized patients", False),
    ("  Molnupiravir / Paxlovid (nirmatrelvir+ritonavir) —", False),
    ("  oral antivirals for high-risk outpatients", False),
    ("Anti-inflammatory:", True),
    ("  Dexamethasone — reduces mortality in severe cases", False),
    ("  requiring supplemental oxygen / ventilation", False),
    ("Monoclonal Antibodies (mAb):", True),
    ("  Target: Spike glycoprotein", False),
    ("  Bamlanivimab, Casirivimab + Imdevimab", False),
    ("  For high-risk patients (FDA EUA)", False),
    ("Supportive / ICU Care:", True),
    ("  Supplemental O₂, prone positioning,", False),
    ("  Intubation & mechanical ventilation (critical)", False),
    ("  Anticoagulation for thromboprophylaxis", False),
    ("  Current guidelines: covid19treatmentguidelines.nih.gov", False),
], 0.35, 1.9, 5.8, 5.1, 12, color=DARK_TEXT)

# Right: Vaccines
rect(s, 6.5, 1.45, 6.6, 5.7, WHITE)
rect(s, 6.5, 1.45, 6.6, 0.38, NAVY)
txt(s, "VACCINES & PREVENTION", 6.55, 1.47, 6.5, 0.34, 14, bold=True,
    color=WHITE, anchor=MSO_ANCHOR.MIDDLE)
bullets(s, [
    ("Vaccine types authorized:", True),
    ("  1. mRNA vaccines — Pfizer-BioNTech (BNT162b2),", False),
    ("     Moderna (mRNA-1273)", False),
    ("     Encode SARS-CoV-2 Spike glycoprotein", True),
    ("     2-dose primary series + booster", False),
    ("  2. Viral vector vaccine — J&J/Janssen", False),
    ("     Replication-incompetent adenovirus vector", False),
    ("     Encodes Spike protein", False),
    ("  3. Protein subunit — Novavax (NVX-CoV2373)", False),
    ("     Recombinant spike + Matrix-M adjuvant", False),
    "",
    ("Preventive measures:", True),
    ("  Wear mask / face shield", False),
    ("  Social distancing (6 feet from others)", False),
    ("  Avoid crowded, poorly ventilated places", False),
    ("  Hand wash with soap & water", False),
    ("  Hand sanitizer with ≥60% ethanol", True),
    ("  Disinfect frequently touched surfaces", False),
    ("  Cover cough/sneeze", False),
], 6.6, 1.9, 6.4, 5.1, 12, color=DARK_TEXT)

# ══════════════════════════════════════════════════════════════════════════════
# SLIDE 10 — High-Yield Exam Summary
# ══════════════════════════════════════════════════════════════════════════════
s = prs.slides.add_slide(blank)
rect(s, 0, 0, 13.333, 7.5, NAVY)
rect(s, 0, 0, 13.333, 1.28, RGBColor(0x05,0x1C,0x35))
rect(s, 0, 1.25, 13.333, 0.07, GOLD)
txt(s, "HIGH-YIELD EXAM POINTS — COVID-19", 0.3, 0.1, 12.7, 0.95, 32, bold=True,
    color=WHITE, align=PP_ALIGN.CENTER, anchor=MSO_ANCHOR.MIDDLE)
txt(s, "As per Apurba Sastry's Essentials of Medical Microbiology  |  MBBS Exam Ready",
    0.3, 0.95, 12.7, 0.33, 13, color=GOLD, align=PP_ALIGN.CENTER, italic=True)

points = [
    ("Causative agent", "SARS-CoV-2 — β-Coronavirus, enveloped, +ssRNA (~30 kb)"),
    ("Classification", "Family: Coronaviridae | Genus: Betacoronavirus | Sub-genus: Sarbecovirus"),
    ("Structural proteins", "Spike (S), Nucleocapsid (N), Membrane (M), Envelope (E)"),
    ("Receptor binding", "Spike RBD → ACE2 receptor | Cleaved by TMPRSS2 & Cathepsin L"),
    ("Unique feature", "Asymptomatic transmission — patients spread virus without symptoms"),
    ("Viral stability", "Aerosol: 2–4 h | Plastic: 72 h | Steel: 48 h | Cardboard: 24 h | Copper: 8 h"),
    ("Gold standard Dx", "RT-PCR (NPS) — detects viral RNA; RdRp / E / N / ORF1ab genes"),
    ("Hallmark lab finding", "Lymphopenia (not neutrophilia) — bad prognostic marker in severe COVID"),
    ("Treatment (antiviral)", "Remdesivir (RdRp inhibitor) + Dexamethasone (anti-inflammatory)"),
    ("Vaccine target", "ALL COVID vaccines target the Spike glycoprotein"),
]
col1, col2 = points[:5], points[5:]
for col_pts, x_base in [(col1, 0.25), (col2, 6.85)]:
    y = 1.42
    for key, val in col_pts:
        rect(s, x_base, y, 6.3, 0.99, RGBColor(0x0E,0x3A,0x62))
        rect(s, x_base, y, 0.17, 0.99, GOLD)
        txt(s, key, x_base+0.24, y+0.03, 5.9, 0.34, 12.5, bold=True, color=GOLD)
        txt(s, val, x_base+0.24, y+0.38, 5.9, 0.57, 11.5,
            color=LIGHT_TEAL, wrap=True)
        y += 1.04

footer(s)

# ══════════════════════════════════════════════════════════════════════════════
# SAVE
# ══════════════════════════════════════════════════════════════════════════════
out = "/tmp/workspace/covid-ppt/COVID19_SARS_CoV2_Apurba_Sastry.pptx"
buf = BytesIO()
prs.save(buf)
with open(out, "wb") as f:
    f.write(buf.getvalue())
print(f"Saved: {out}")
print(f"Slides: {len(prs.slides)}")
cd /tmp/workspace/covid-ppt && python build_covid_ppt.py
COVID19 SARS CoV2 Apurba Sastry
Presentation · PPTX
| Slide | Content |
|---|---|
| 1 | Title slide - COVID-19 / SARS-CoV-2 |
| 2 | Taxonomy, Structure & Morphology (4 structural proteins: S, N, M, E) |
| 3 | Epidemiology Timeline (Dec 2019 → Pandemic) + Transmission routes |
| 4 | Pathogenesis (5 steps: Entry → S cleavage → Replication → Assembly → Cytokine storm) with ACE2 entry diagram + cytokine storm cascade image |
| 5 | Variants of Concern table (Alpha to Omicron) + variant infographic + ACE2 target organs |
| 6 | Clinical Features (Mild 80% / Severe 15% / Critical 5%) |
| 7 | Long COVID, MIS-C, Complications + CT chest progression images + IHC/EM lung pathology |
| 8 | Laboratory Diagnosis (RT-PCR, RAT, BioFire, Serology, CBC) |
| 9 | Treatment (Remdesivir, Dexamethasone, mAb) + Vaccination (mRNA, viral vector, protein subunit) |
| 10 | High-Yield Exam Points (dark blue summary, Apurba Sastry style) |