
Biochemical changes in nephrotic syndrome
"nephrotic syndrome" AND "biochemical" AND "pathophysiology"
nephrotic syndrome biochemical changes pathophysiology diagram
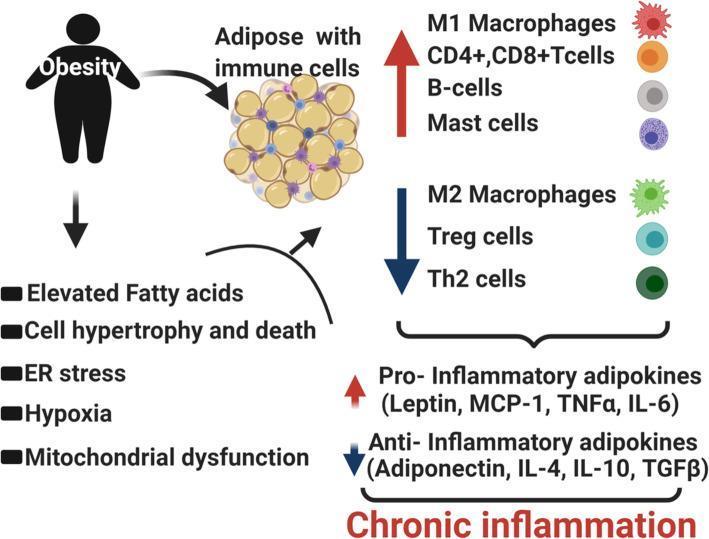
This pathophysiology diagram illustrates the transition from obesity to chronic inflammation through alterations in adipose tissue and immune cell composition. The visual depicts a silhouette representing obesity linked to adipose tissue containing immune cells. It details five key metabolic drivers: elevated fatty acids, cell hypertrophy and death, endoplasmic reticulum (ER) stress, hypoxia, and mitochondrial dysfunction. The diagram maps a shift in the immune landscape, showing an increase (upward arrow) in pro-inflammatory populations, including M1 macrophages, CD4+/CD8+ T-cells, B-cells, and mast cells. Conversely, it shows a decrease (downward arrow) in anti-inflammatory populations, specifically M2 macrophages, Treg cells, and Th2 cells. The lower portion categorizes adipokines: pro-inflammatory factors (Leptin, MCP-1, TNFα, IL-6) are shown to be elevated, while anti-inflammatory factors (Adiponectin, IL-4, IL-10, TGFβ) are diminished. The culmination of these cellular and biochemical changes is identified as the driver of local and systemic chronic inflammation, relevant to metabolic syndrome and inflammatory disease complications.
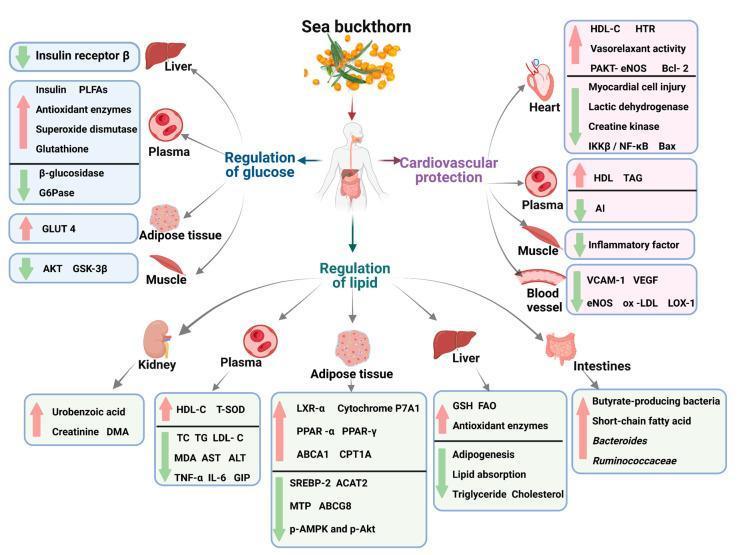
A comprehensive medical pathophysiology diagram illustrating the multi-organ effects of sea buckthorn on metabolic syndrome. The central figure depicts a human body with arrows branching toward three primary physiological targets: Regulation of Glucose, Cardiovascular Protection, and Regulation of Lipids. The diagram uses color-coded arrows (red for increase, green for decrease) to show molecular and biochemical changes. Cardiovascular protection pathways highlight decreased myocardial cell injury and inflammatory markers (IKK̢̢β/NF-κB) with increased vasorelaxant activity and HDL-C. Glucose regulation involves upregulated GLUT4 in adipose tissue and downregulated insulin receptor β in the liver. Lipid regulation effects are shown across the intestines, liver, adipose tissue, plasma, and kidneys, detailing the upregulation of fatty acid oxidation (FAO) and antioxidant enzymes while downregulating adipogenesis, lipid absorption, and systemic cholesterol/triglyceride levels. The illustration serves as an educational summary of how bioactive substances in sea buckthorn modulate metabolic markers and inflammatory pathways in chronic disease contexts.
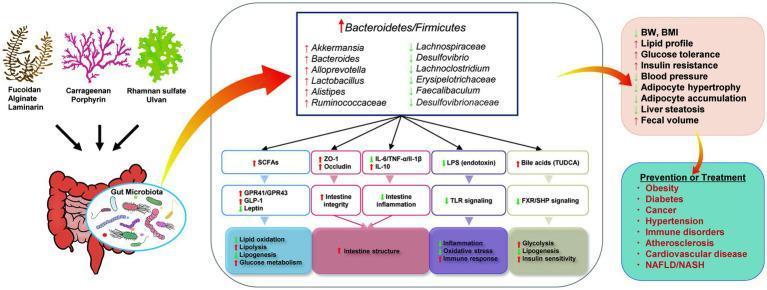
This pathophysiology diagram illustrates the mechanisms by which seaweed-derived bioactive components modulate the gut microbiota to improve metabolic syndrome. The flow begins with bioactive compounds (Fucoidan, Alginate, Laminarin, Carrageenan, Porphyrin, Rhamnan sulfate, and Ulvan) interacting with the gut microbiota. This interaction leads to an increased Bacteroidetes/Firmicutes ratio, specifically increasing beneficial genera like Akkermansia, Bacteroides, and Lactobacillus, while decreasing harmful groups such as Lachnospiraceae and Desulfovibrio. The central panel details subsequent biochemical pathways: increased SCFAs, bile acids (TUDCA), and intestinal tight junction proteins (ZO-1, Occludin), alongside decreased inflammatory markers (IL-6, TNF-α, LPS) and TLR signaling. These changes result in systemic effects: improved intestinal integrity, reduced oxidative stress, enhanced insulin sensitivity, and modulated lipid metabolism. Clinical outcomes shown include decreased BMI, blood pressure, and liver steatosis, as well as improved glucose tolerance. The final panel suggests these mechanisms facilitate the prevention or treatment of obesity, diabetes, hypertension, atherosclerosis, and NAFLD/NASH.
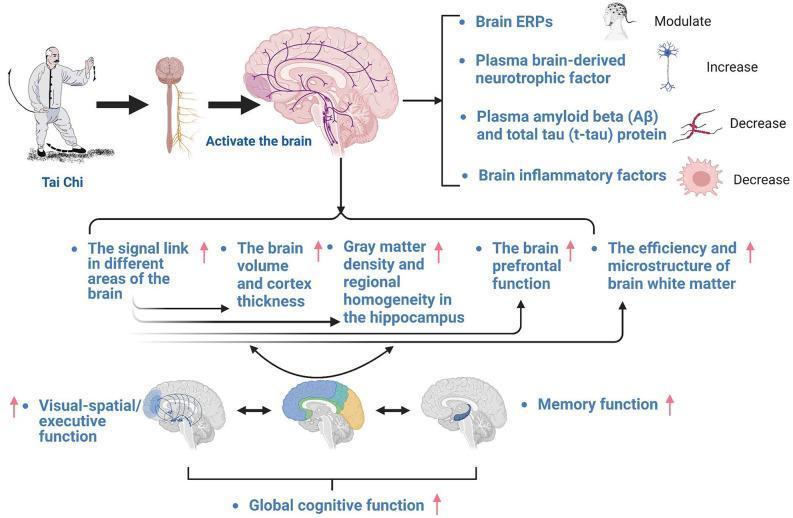
This pathophysiology diagram illustrates the hypothesized neural and biochemical mechanisms of Tai Chi in treating mild cognitive impairment (MCI). The flowchart begins with Tai Chi practice leading to brain activation, which triggers four primary biochemical and neurophysiological changes: modulation of brain Event-Related Potentials (ERPs), increased levels of plasma brain-derived neurotrophic factor, and decreased levels of both plasma amyloid beta (Aβ)/total tau (t-tau) proteins and brain inflammatory factors. These physiological shifts are linked to several structural and functional improvements: enhanced signal connectivity between brain regions, increased brain volume and cortex thickness, higher gray matter density and regional homogeneity in the hippocampus, improved prefrontal function, and enhanced white matter efficiency/microstructure. The diagram concludes by showing how these structural changes correlate with improved visual-spatial/executive function and memory function, collectively leading to an overall enhancement in global cognitive function. The illustration uses brain cross-sections and icons to represent neuroanatomical regions like the hippocampus and prefrontal cortex.
Biochemical Changes in Nephrotic Syndrome
1. Proteinuria
- Albumin accounts for >80% of excreted proteins
- Immunoglobulins are the second most copiously lost protein
- Selectivity of proteinuria matters clinically:
- Highly selective: mostly low-MW proteins (albumin, transferrin) - typical of minimal change disease
- Poorly selective: higher-MW globulins also lost - typical of focal segmental glomerulosclerosis, membranous nephropathy
2. Hypoalbuminemia
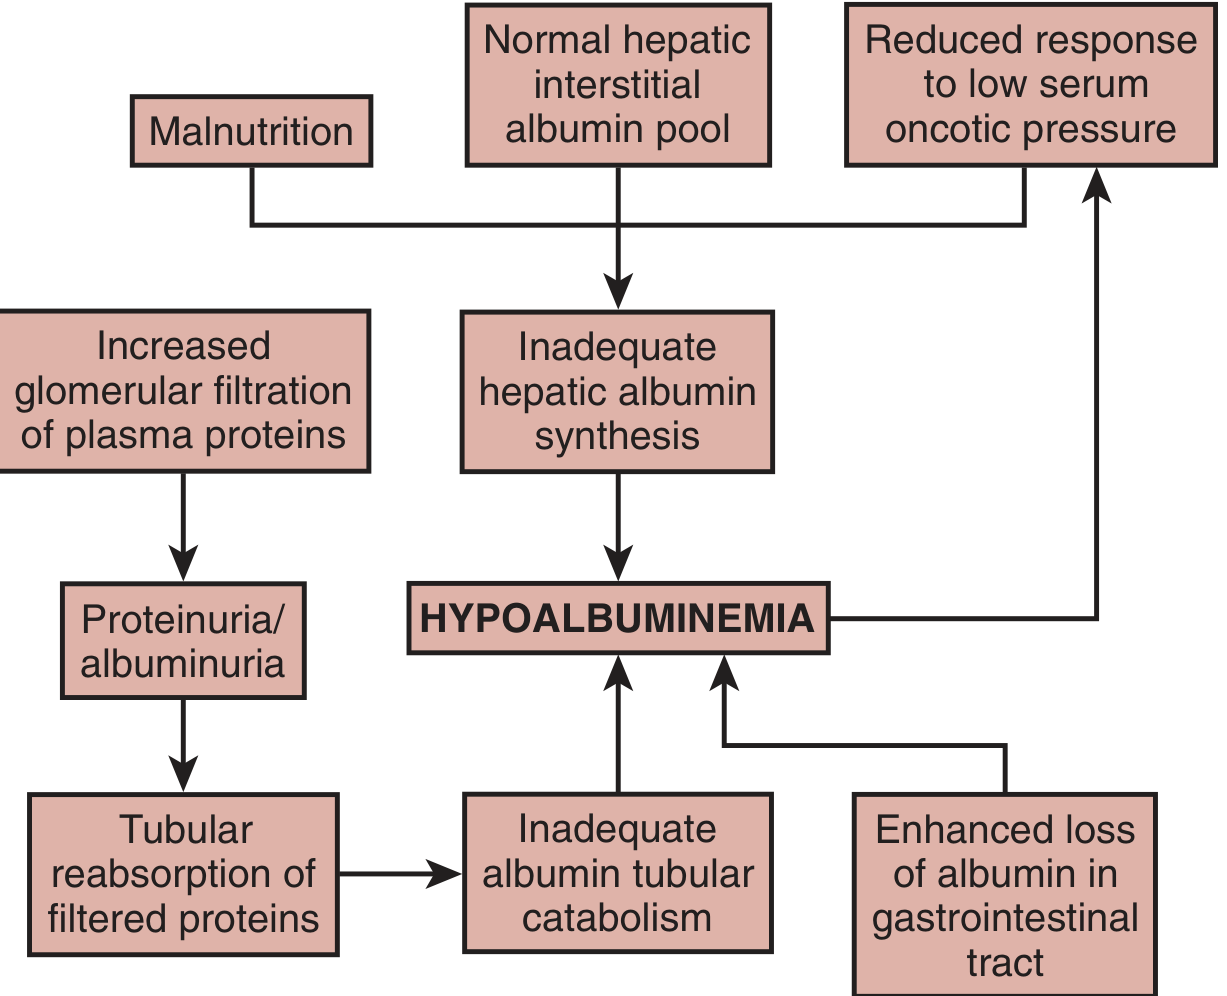
| Mechanism | Detail |
|---|---|
| Urinary loss | Direct albuminuria depletes the circulating pool |
| Inadequate hepatic synthesis | Liver can increase production up to 3-fold, but this is insufficient. The oncotic pressure stimulus for more synthesis is blunted by a "reduced response to low serum oncotic pressure" |
| Increased catabolism | Renal tubular reabsorption of filtered albumin with subsequent catabolism is increased; GI albumin loss is also enhanced |
| Malnutrition | Contributes in chronic disease |
3. Edema and Sodium/Water Retention
- Low plasma oncotic pressure (due to hypoalbuminemia) → fluid shifts to interstitial space → reduced effective circulating volume → stimulates RAAS → aldosterone-driven Na/water retention
- Typical in minimal change disease (contracted plasma volume, elevated renin/aldosterone)
- Primary intrinsic renal Na retention at the collecting duct (enhanced ENaC and Na-K-ATPase activity) → expanded plasma volume → overflow edema
- Blunted natriuretic response to ANP: enhanced phosphodiesterase activity in collecting duct cells accelerates cGMP breakdown, rendering the tubule unresponsive
- Typical in most other causes (expanded plasma volume, suppressed RAAS)
4. Hyperlipidemia and Lipiduria
Overproduction
- Low oncotic pressure upregulates hepatic lipoprotein synthesis (HMG-CoA reductase activity is elevated)
- Since albumin and lipoproteins share a common hepatic secretory pathway, the compensatory increase in albumin synthesis drives parallel lipoprotein overproduction
- Serum cholesterol levels are inversely proportional to serum albumin levels
Impaired Catabolism/Clearance
- Reduced activity of lipoprotein lipase (LPL) and hepatic triglyceride lipase
- Reduced clearance of chylomicrons (CM) and VLDL
- Urinary loss of apolipoproteins that normally activate LPL (e.g., apo C-II)
- Elevated apo C-III:apo C-II ratio inhibits LPL further
Lipid Profile Changes
| Lipid/Lipoprotein | Change |
|---|---|
| Total cholesterol | ↑↑ (can exceed 500 mg/dL) |
| LDL | ↑↑ |
| VLDL | ↑ |
| IDL | ↑ |
| Triglycerides | Variable ↑ (mainly in severe nephrosis) |
| Lipoprotein(a) | ↑ |
| Apo B, C-II, E | ↑ |
| Apo C-III:C-II ratio | ↑ (promotes hypertriglyceridemia) |
| HDL | Normal or ↓ (urinary HDL loss in severe proteinuria) |
| Free fatty acids | Normal, but less bound to albumin |
-
Free fat
-
Oval fat bodies (tubular cells that have reabsorbed lipoproteins, then detached from the BM)
-
Fatty casts under polarized light showing "Maltese cross" pattern
-
Robbins, Cotran & Kumar Pathologic Basis of Disease, p. 844; Comprehensive Clinical Nephrology, 7th Ed.
5. Coagulation Abnormalities and Thrombophilia
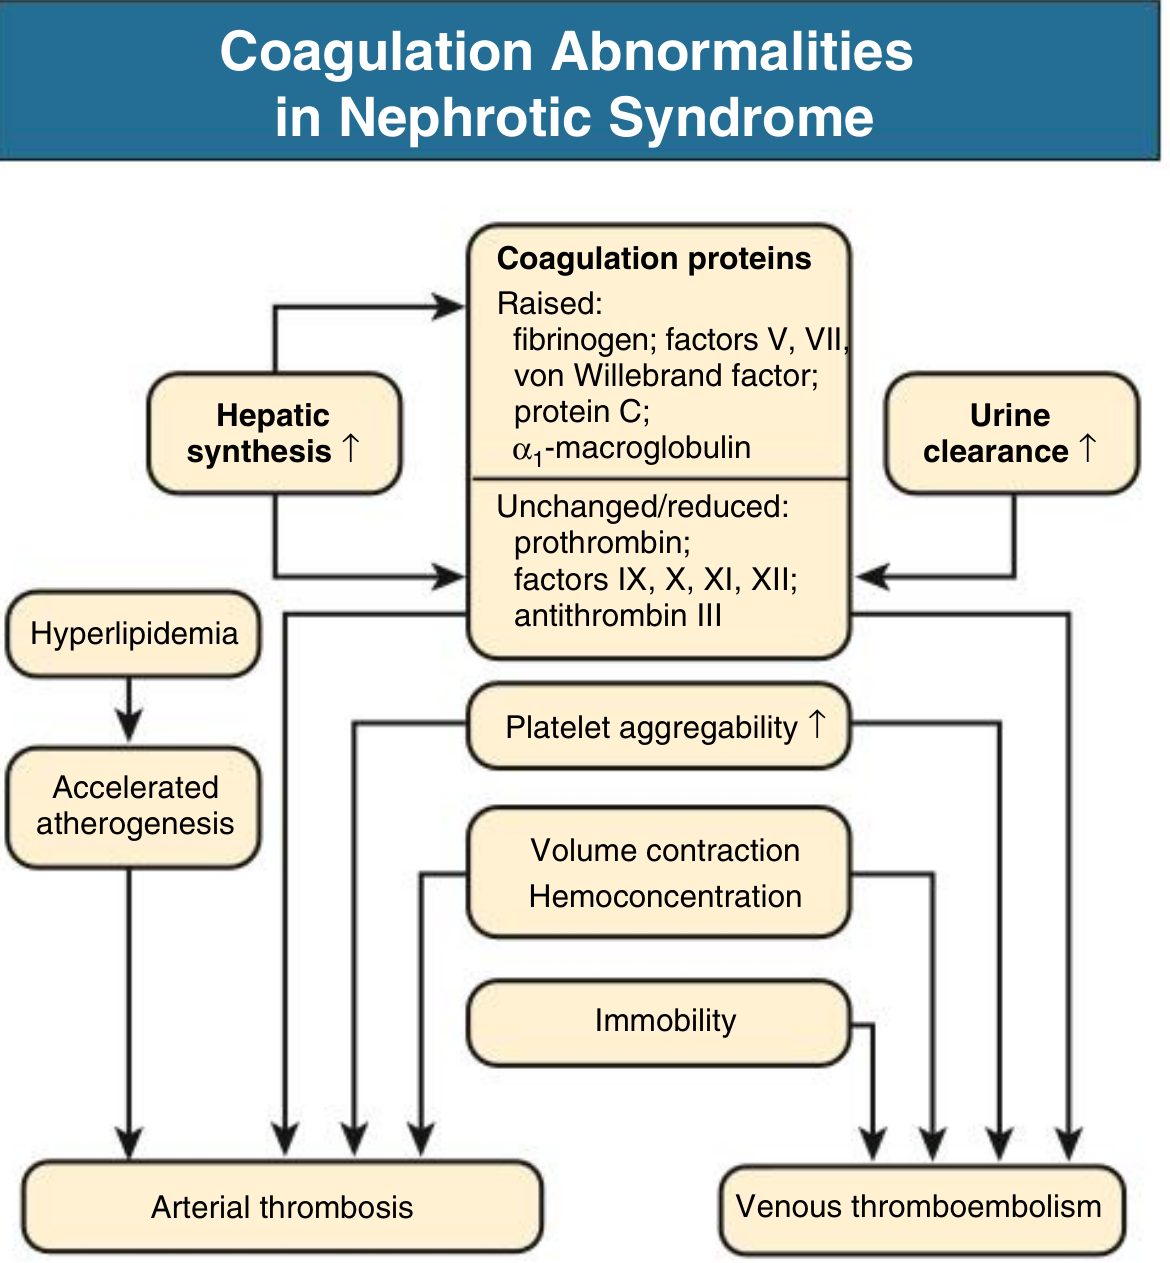
- Fibrinogen
- Factors V, VII, VIII
- Von Willebrand factor
- Protein C
- alpha-1-macroglobulin
- Antithrombin III (AT-III) - key loss; smaller molecule, readily filtered
- Factors IX, X, XI, XII
- Prothrombin
-
Up to 10% of adults and 2% of children experience clinical thromboembolism
-
Risk increases markedly when serum albumin <2 g/dL
-
Renal vein thrombosis occurs in 8-50% when sought systematically (most common in membranous nephropathy)
-
Pulmonary embolism is a major complication
-
Comprehensive Clinical Nephrology, 7th Ed., p. 241; Brenner & Rector's The Kidney
6. Susceptibility to Infection
- Loss of complement factors (properdin factor B, C3, C5) impairs opsonization
- Reduced phagocytic function
7. Other Protein Losses and Their Consequences
| Protein Lost | Consequence |
|---|---|
| Transferrin | Microcytic anemia resistant to iron therapy |
| Thyroid-binding globulin (TBG) | Low T4; but free T4 normal (euthyroid sick pattern) |
| Vitamin D-binding protein | Hypocalcemia, secondary hyperparathyroidism, metabolic bone disease |
| Ceruloplasmin | Low serum copper |
| Hormone-binding proteins | Altered drug and hormone kinetics |
| Antithrombin III | Thrombophilia (see above) |
| IgG | Susceptibility to infection |
Summary Table
| Abnormality | Key Change | Mechanism |
|---|---|---|
| Proteinuria | >3.5 g/day | Glomerular barrier disruption |
| Hypoalbuminemia | <3 g/dL | Urinary loss + inadequate hepatic synthesis |
| Edema | Pitting, periorbital | Underfill (low oncotic pressure) ± overfill (renal Na retention) |
| Hyperlipidemia | ↑↑ LDL, cholesterol, VLDL | Hepatic overproduction + impaired catabolism |
| Lipiduria | Oval fat bodies, fatty casts | Lipoprotein glomerular leakage |
| Hypercoagulability | ↑ fibrinogen, ↓ AT-III | Hepatic overproduction of procoagulants + urinary loss of anticoagulants |
| Immunodeficiency | Low IgG | Urinary immunoglobulin loss |
| Hypocalcemia | ↓ Ca²⁺ | Loss of vitamin D-binding protein |
| Anemia | Microcytic | Loss of transferrin |