
Ecg interpretation in detail and easy words
Reading File
Now let me search the medical library for ECG interpretation content, in parallel with a web search.
Finding Sources
Finding Sources
Searching the Web
ECG interpretation step by step easy guide P wave QRS T wave
Now let me read the key textbook sections on ECG - from Harrison's and Braunwald's (the gold standards):
Reading File
Reading File
Let me get the main ECG content from Harrison's (which has the detailed systematic approach) and also search for specific ECG components:
Reading File
Finding Sources
Excellent - let me now read the Goldman-Cecil and Costanzo sections which look like the most beginner-friendly detailed content:
Reading File
Reading File
I now have rich content. Let me also grab the ECG diagram images and the Harrison's systematic approach section:
Loading Image
Loading Image
Reading File
I have everything I need to write a thorough, easy-to-understand ECG guide with textbook diagrams. Let me compile the full answer now.
ECG Interpretation - A Complete, Easy Guide
An ECG (electrocardiogram) is simply a recording of the electrical activity of the heart picked up by electrodes placed on your skin. Every heartbeat produces a tiny electrical signal, and the ECG traces those signals as waves on paper. Here is how to read one from scratch.
1. The ECG Paper - Understanding the Grid
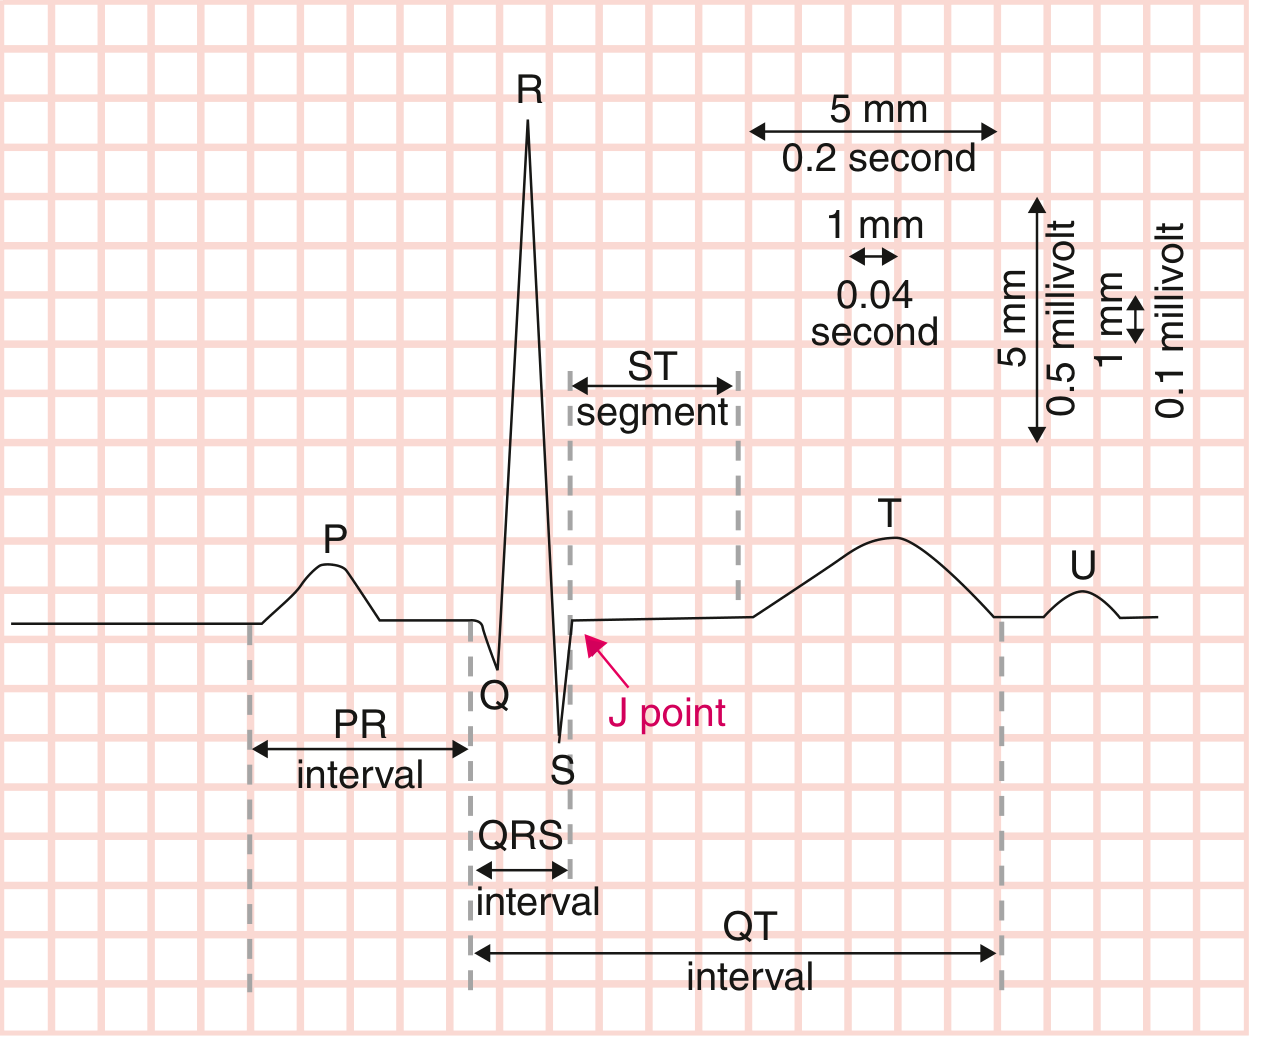
The graph has two axes:
- Horizontal axis = Time. Each tiny small box = 0.04 seconds. Each large box (5 small boxes) = 0.20 seconds.
- Vertical axis = Voltage (amplitude). Each small box = 0.1 millivolt (mV). Each large box = 0.5 mV.
The standard paper runs at 25 mm per second. This is how you measure the duration of every wave.
2. The Waves - What Each One Means

Think of each heartbeat as a story in 3 acts:
P Wave - "The Atria Wake Up"
- Represents depolarization (electrical activation) of the atria (the upper chambers).
- Looks like a small, smooth bump.
- Normal: less than 0.12 sec wide (3 small boxes), less than 2.5 mm tall.
- If the P wave is wide or notched: the atria may be enlarged.
- If there are no P waves: could be atrial fibrillation (A-fib).
PR Interval - "The Signal Waits at the Gate"
- Measured from the start of P to the start of QRS.
- This is the time it takes for the electrical signal to travel from the atria down through the AV node (the gatekeeper) into the ventricles.
- Normal: 0.12 - 0.20 seconds (3 to 5 small boxes).
- Too short (<0.12 sec): signal bypassing the AV node (e.g., Wolff-Parkinson-White syndrome).
- Too long (>0.20 sec): AV block (1st degree heart block - signal delayed).
- Getting progressively longer until a beat is dropped: 2nd degree Mobitz I (Wenckebach).
- Consistently long + dropped beats: 2nd degree Mobitz II.
- No relationship between P waves and QRS: 3rd degree (complete) heart block - very serious.
QRS Complex - "The Ventricles Fire"
- Represents depolarization (contraction activation) of the ventricles (the large pumping chambers).
- It looks like a sharp spike - the biggest wave on the ECG.
- The Q is the first downward deflection, R is the upward peak, S is the downward deflection after R.
- Normal: less than 0.12 sec (3 small boxes wide).
- Ventricles are big, but depolarize quickly because the His-Purkinje system (a super-fast highway) carries the signal at high speed.
- Wide QRS (>0.12 sec): signal traveling slowly through the ventricles - called a bundle branch block, or could be a ventricular origin beat.
- Pathological Q waves: if a Q wave is wider than 1 small box or deeper than 1/3 the height of the QRS - suggests old myocardial infarction (heart attack).
ST Segment - "The Heart Holds Its Breath"
- The flat line between the end of S and the start of T.
- Represents the period when the ventricles are all depolarized but not yet repolarizing.
- Normally sits on the isoelectric (flat) baseline - called the J point.
- ST Elevation: the segment rises above baseline - sign of acute heart attack (STEMI - ST elevation MI) or pericarditis.
- ST Depression: the segment dips below baseline - sign of myocardial ischemia (insufficient blood flow) or non-STEMI.
T Wave - "The Heart Recovers"
- Represents repolarization (recovery) of the ventricles.
- Normally a smooth, rounded, upright wave (in most leads).
- Inverted T waves: ischemia, ventricular strain, bundle branch block.
- Tall/peaked T waves: early ischemia, or hyperkalemia (high potassium - can be life-threatening).
- Flat T waves: hypokalemia (low potassium), ischemia.
QT Interval - "Total Recovery Time"
- Measured from the start of Q to the end of T.
- Represents the total time for ventricles to depolarize and repolarize.
- Normal: roughly 0.35-0.45 seconds (varies with heart rate - use the corrected QTc).
- Prolonged QT: risk of dangerous arrhythmia called Torsades de Pointes (can cause sudden death). Causes: drugs (many antibiotics, antipsychotics), low magnesium/potassium, congenital.
U Wave - "The Quiet Afterthought"
- A small bump after the T wave, not always visible.
- Prominent U waves suggest hypokalemia (low potassium).
3. The 12 Leads - Different Camera Angles
A standard ECG has 12 leads, each looking at the heart from a different direction. Think of 12 different cameras filming the same event from different angles:
| Lead Group | What They See |
|---|---|
| I, II, III | Overall heart from the front (limb leads) |
| aVR, aVL, aVF | Augmented limb leads - right arm, left arm, left leg view |
| V1, V2 | Right side of the heart |
| V3, V4 | Septal/anterior wall |
| V5, V6 | Lateral left ventricle |
This matters hugely for locating a heart attack:
- ST elevation in V1-V4 = anterior wall MI (LAD artery blocked)
- ST elevation in II, III, aVF = inferior wall MI (RCA artery blocked)
- ST elevation in I, aVL, V5-V6 = lateral wall MI (LCx artery blocked)
4. Heart Rate - How to Calculate It
Method 1 (Regular rhythm):
Pick an R wave that falls on a big line. Then count the big boxes to the next R wave. Divide 300 by that number.
Example: 3 big boxes between R waves = 300 ÷ 3 = 100 bpm
The classic shortcut: 300 - 150 - 100 - 75 - 60 - 50 (for 1, 2, 3, 4, 5, 6 big boxes between R waves).
Method 2 (Irregular rhythm):
Count the number of QRS complexes in a 10-second strip, multiply by 6.
- Normal rate: 60-100 bpm
- Bradycardia: <60 bpm
- Tachycardia: >100 bpm
5. Rhythm - Is It Regular?
Look at the R-R intervals (distance between successive R waves). Mark them out on paper. Are they all equal?
- Regular: same R-R intervals throughout - normal sinus rhythm, or a regular arrhythmia.
- Regularly irregular: a pattern to the irregularity (e.g., dropped beats in 2nd degree block).
- Irregularly irregular: no pattern at all - classic for atrial fibrillation (A-fib).
6. The Axis - Is the Heart Pointing the Right Direction?
The mean QRS axis is the overall direction the electrical wave travels through the ventricles. Normally it points down and to the left (the direction of the big left ventricle).
Quick method - look at leads I and aVF:
| Lead I | Lead aVF | Axis |
|---|---|---|
| Upright | Upright | Normal (-30° to +90°) |
| Upright | Inverted | Left axis deviation (LAD) - left bundle branch block, LVH |
| Inverted | Upright | Right axis deviation (RAD) - right heart strain, RVH, PE |
| Both inverted | Both inverted | Extreme axis - very abnormal |
7. A Systematic Checklist for Every ECG
Harrison's Principles of Internal Medicine recommends 14 things to check every time. Here is a simplified version:
- Rate - 60-100 bpm?
- Rhythm - Regular? Any P waves?
- P wave - Present and normal shape?
- PR interval - 0.12-0.20 sec?
- QRS duration - Less than 0.12 sec?
- QRS axis - Normal?
- QRS voltage - Low voltage? High voltage (LVH)?
- R-wave progression - Does R grow V1→V6?
- Q waves - Any pathological Q waves?
- ST segments - Elevated or depressed?
- T waves - Upright and normal?
- QT interval - Prolonged?
- U waves - Prominent?
- Compare with old ECG - Any new changes?
8. Common Abnormalities at a Glance
| Finding | What It Means |
|---|---|
| No P waves + irregularly irregular rhythm | Atrial fibrillation |
| Saw-tooth baseline at 300 bpm + regular | Atrial flutter |
| Wide QRS + no P waves + rate 100-250 | Ventricular tachycardia |
| ST elevation in consecutive leads | Acute STEMI (heart attack) |
| Pathological Q waves | Old MI (scarred tissue) |
| Prolonged QT | Risk of dangerous arrhythmia |
| Delta wave (slurred QRS upstroke) | WPW syndrome |
| Wide QRS with RBBB pattern (rSR' in V1) | Right bundle branch block |
| Wide QRS with LBBB pattern | Left bundle branch block |
| Tall peaked T waves | Hyperkalemia |
| U waves + flat T | Hypokalemia |
| Sinus bradycardia | Heart rate <60, P before every QRS |
Key Normal Values - Quick Reference
| Parameter | Normal Range |
|---|---|
| Heart rate | 60-100 bpm |
| PR interval | 0.12-0.20 sec (3-5 small boxes) |
| QRS duration | <0.12 sec (<3 small boxes) |
| QT interval (corrected) | <0.44 sec (men), <0.46 sec (women) |
| P wave duration | <0.12 sec |
| P wave amplitude | <2.5 mm |
Sources: Goldman-Cecil Medicine (26th ed.), Costanzo Physiology (7th ed.), Harrison's Principles of Internal Medicine (22nd ed.), Braunwald's Heart Disease (12th ed.)
Axis digrams
Let me find the best ECG axis diagrams from the medical textbooks right away.
Searching sources...
Finding Sources
Finding Sources
Reading File
Reading File
Reading File
I have the image URLs. Let me fetch all the key axis diagrams simultaneously:
Loading Image
Loading Image
Reading File
Reading File
Now let me fetch the left axis deviation and right axis deviation ECG diagrams:
Loading Image
Loading Image
Finding Sources
I now have all the diagrams needed. Let me also get the hexaxial diagram from Harrison's:
Finding Sources
I have everything needed. Here is a complete, diagram-rich explanation of ECG axis:
ECG Axis - Diagrams and Easy Explanation
What Is the "Axis"?
The electrical axis is simply the average direction the electrical wave travels through the ventricles during each heartbeat. Think of it like an arrow pointing in the direction most of the heart muscle is depolarizing. Because the left ventricle is much bigger and is tilted down-left in the chest, the normal axis points down and to the left.
The Einthoven Triangle + Reference System
This diagram from Ganong's Medical Physiology shows the core concept - the Einthoven triangle (leads I, II, III around the body) and the reference axes used to measure the angle:
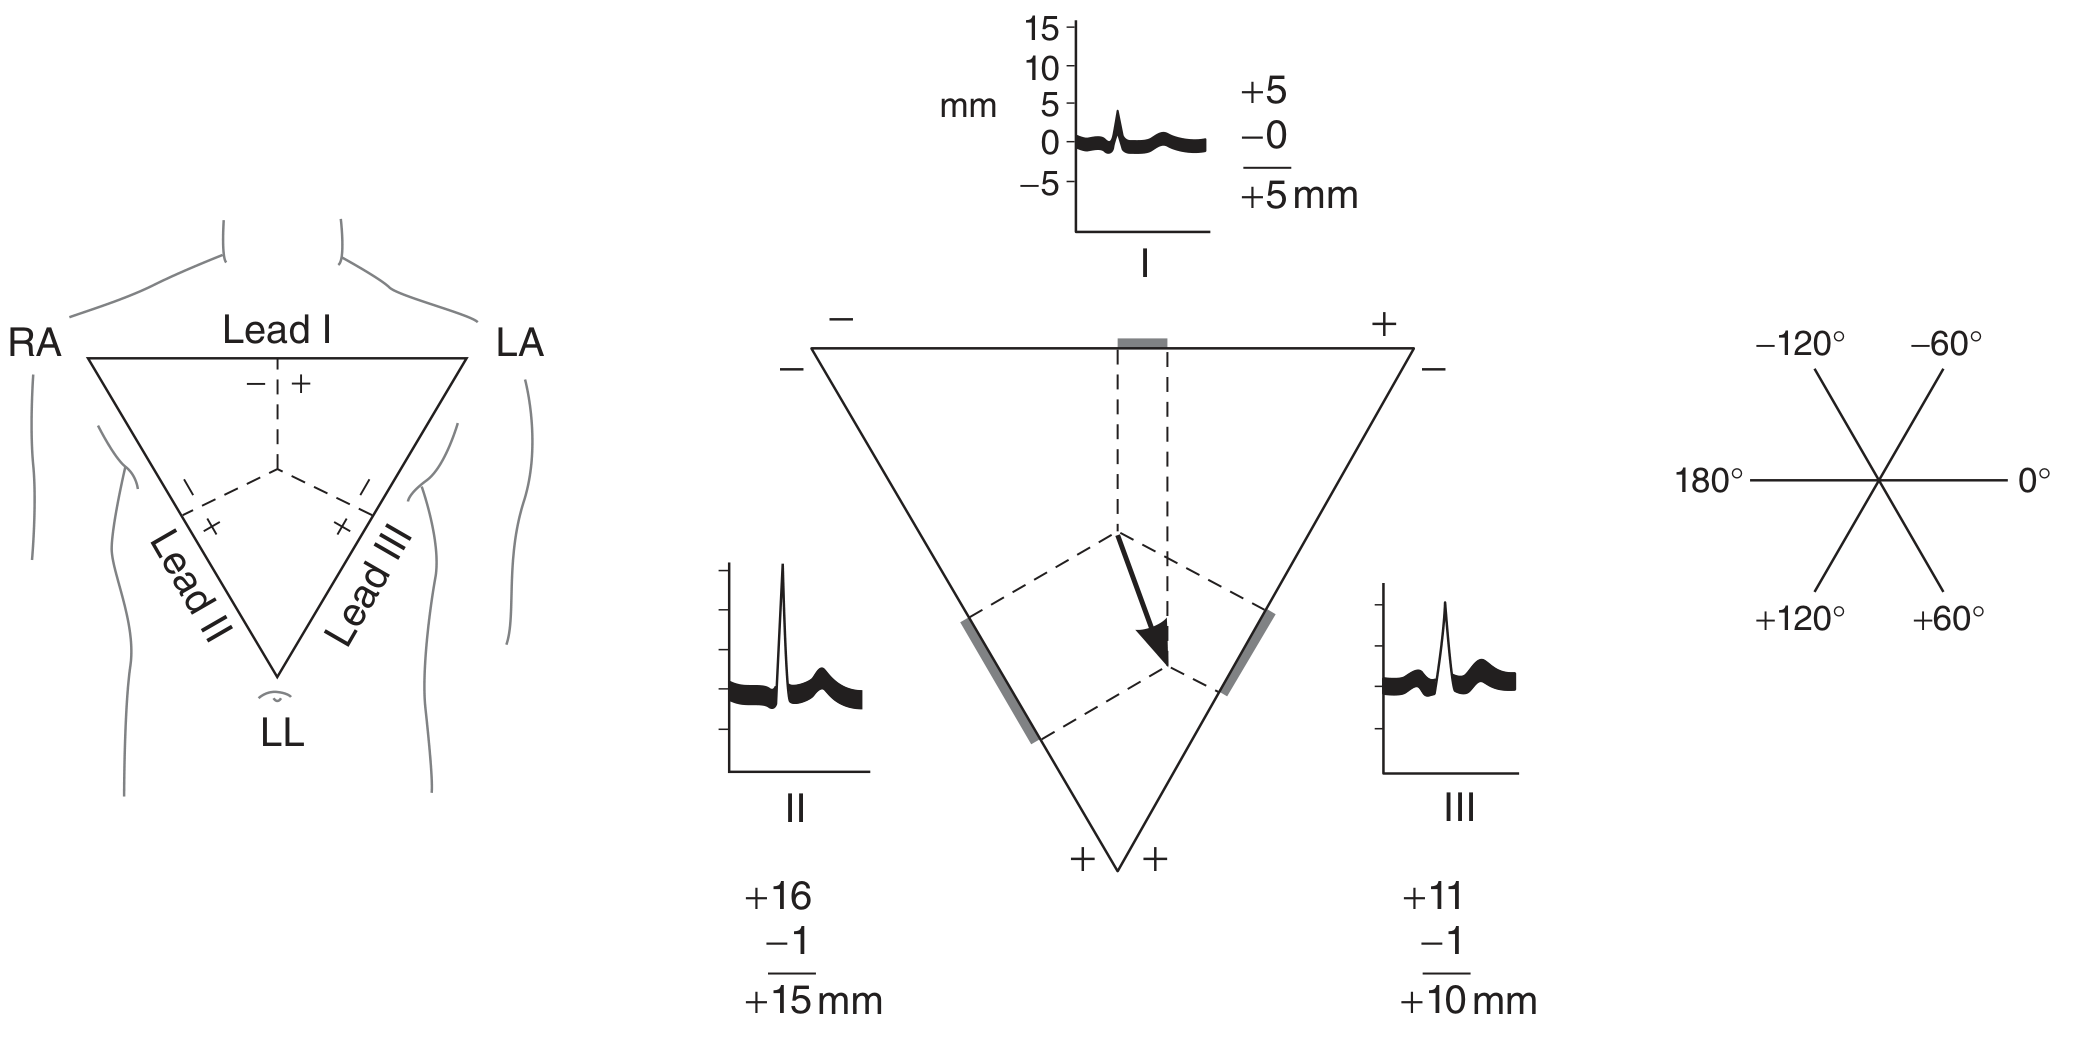
- Left side: The Einthoven triangle - right arm (RA), left arm (LA), left leg (LL) form the 3 corners
- Middle: How you plot the mean QRS vector using leads I, II, and III together
- Right side: The degree reference system (0° on the right, +60° bottom right, +120° bottom left, 180° on the left, -120° top left, -60° top right)
How to Calculate the Axis (Guyton & Hall Method)
This diagram from Guyton & Hall Textbook of Medical Physiology shows the vector math in action - a normal axis of 59°:
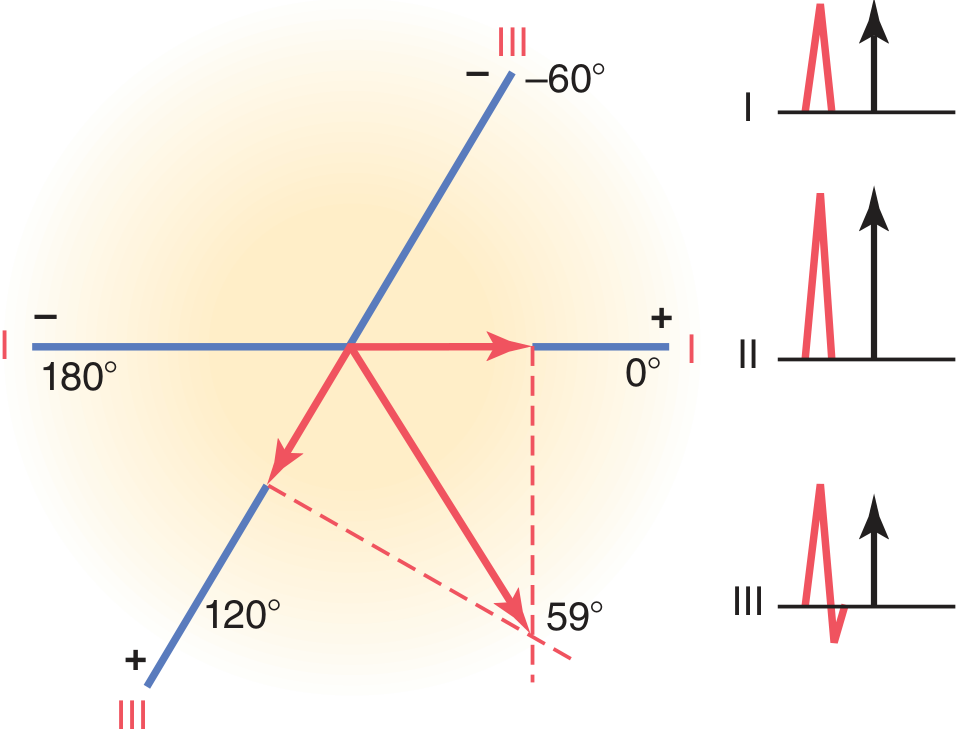
How to read it:
- Lead I net deflection (R - S) = +5 mm → plotted on the Lead I axis (horizontal)
- Lead III net deflection = +10 mm → plotted on the Lead III axis (diagonal)
- Draw perpendiculars from each measurement, where they intersect = the mean electrical axis arrow
- Result here: the arrow points to ~59° - normal!
Normal vs. Abnormal Axis - The Quick Rule
| What you see | Axis | Normal? |
|---|---|---|
| Lead I up, aVF up | Normal (-30° to +90°) | ✅ Yes |
| Lead I up, aVF down | Left Axis Deviation (LAD) | ❌ <-30° |
| Lead I down, aVF up | Right Axis Deviation (RAD) | ❌ >+90° |
| Lead I down, aVF down | Extreme/Northwest axis | ❌ Very abnormal |
Left Axis Deviation (LAD) - From Guyton & Hall
This is a real ECG of left ventricular hypertrophy (LVH) from hypertension, with the vector analysis below showing the axis pulled to about -15° (upper left quadrant):
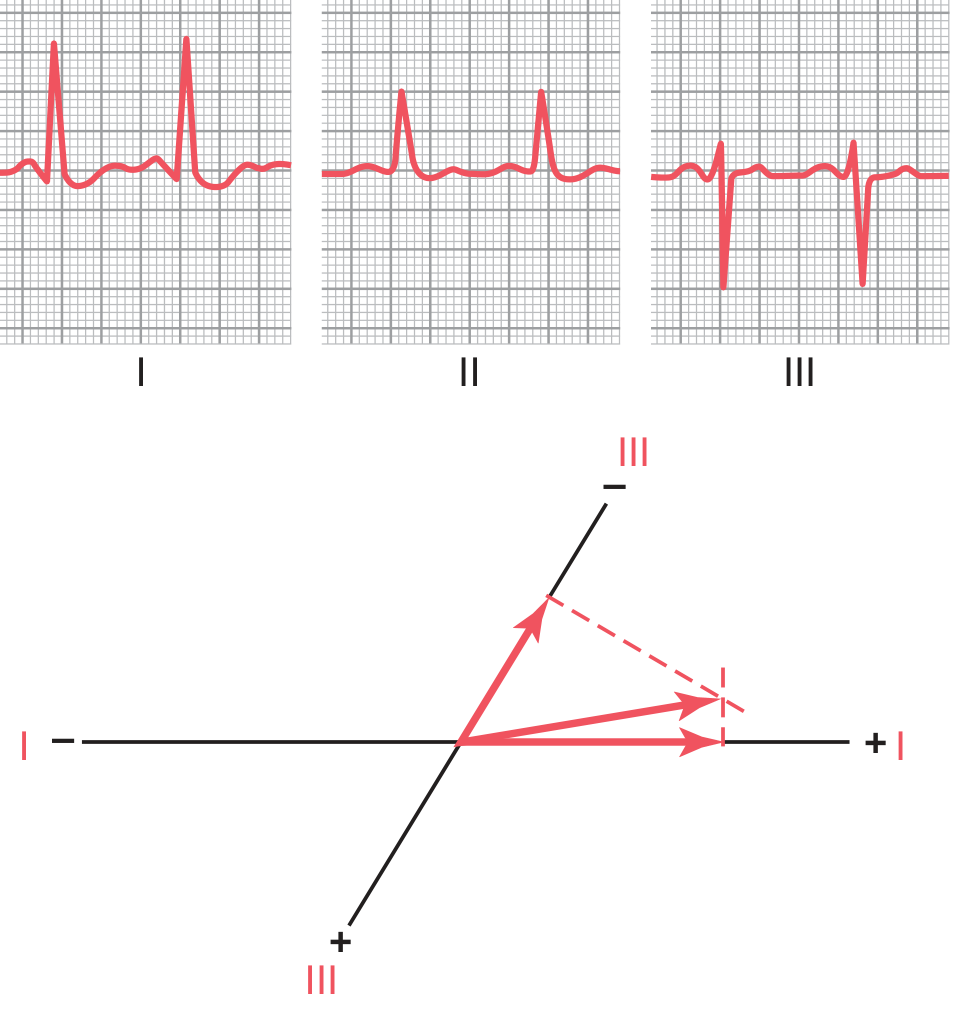
What you see on the ECG:
- Lead I: tall upright R wave
- Lead II: smaller upright complex
- Lead III: predominantly downward (negative) QRS
The axis arrow pulls up and to the left because the enlarged left ventricle dominates the electrical activity.
Causes of LAD (more negative than -30°):
- Left ventricular hypertrophy (hypertension, aortic stenosis)
- Left anterior fascicular block (LAFB)
- Left bundle branch block (LBBB)
- Inferior MI (loss of inferior forces)
- Wolff-Parkinson-White syndrome
Right Axis Deviation (RAD) - From Guyton & Hall
This is a real ECG of right ventricular hypertrophy from pulmonary valve stenosis, with the axis deviated all the way to 170°:
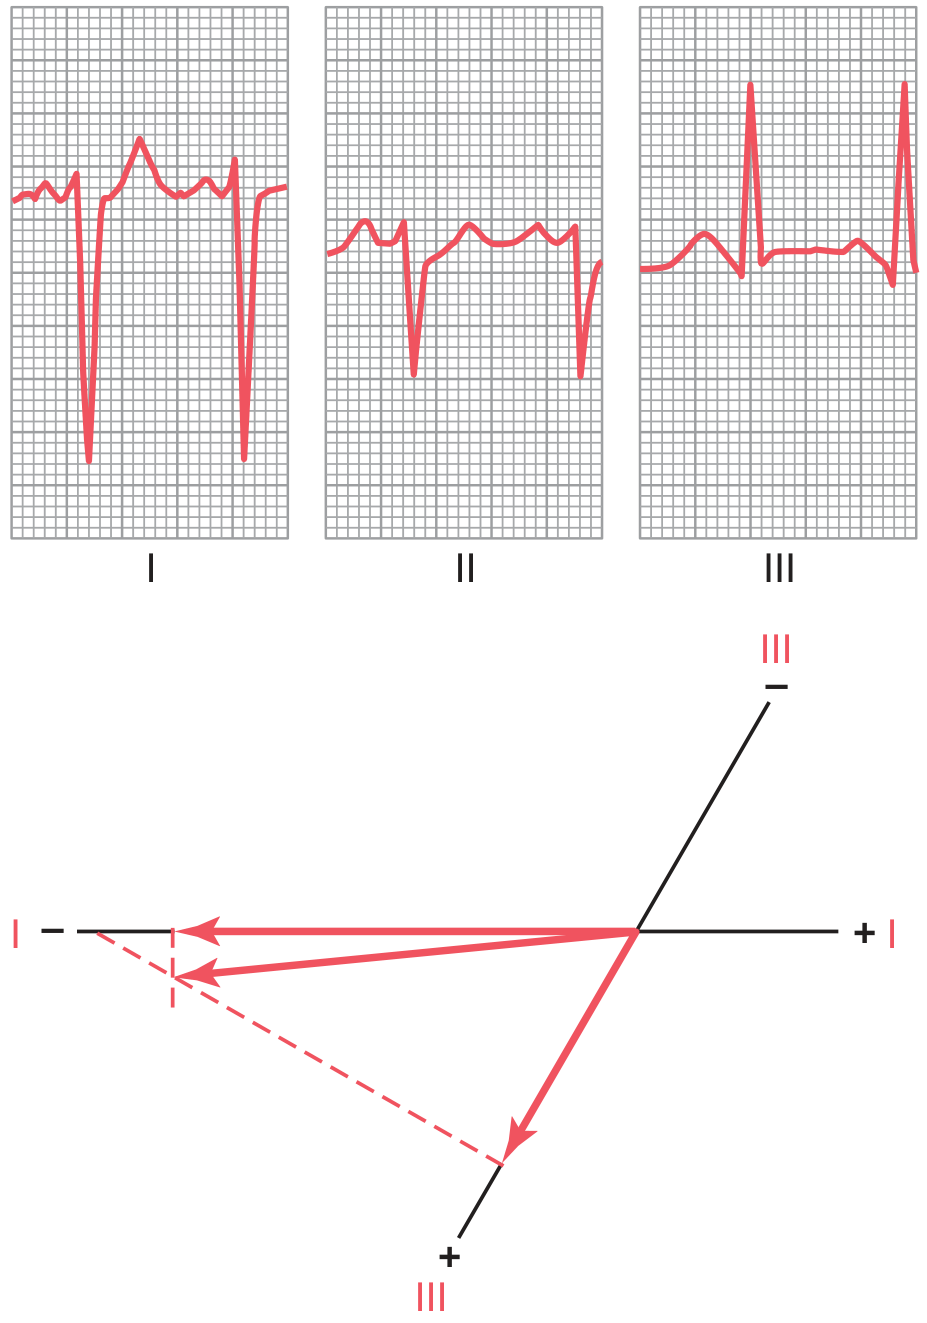
What you see on the ECG:
- Lead I: predominantly downward (negative) deep S wave
- Lead II: small complex
- Lead III: tall upright dominant R wave
The axis arrow swings hard to the right because the enlarged right ventricle overpowers the left.
Causes of RAD (more positive than +90°):
- Right ventricular hypertrophy (pulmonary hypertension, pulmonary stenosis, tetralogy of Fallot)
- Left posterior fascicular block (LPFB)
- Right bundle branch block (RBBB)
- Pulmonary embolism (acute RV strain)
- Dextrocardia
- Normal variant in tall thin people
Summary Diagram in Words - The Axis "Wheel"
           -90° (straight up)
              |
-180° --------+-------- 0° / 360°  (Lead I positive pole)
              |
           +90° (straight down, aVF positive pole)

  NORMAL ZONE: -30° to +90°  (down-left quadrant)
  LAD:  more negative than -30°  (upper-left)
  RAD:  more positive than +90°  (lower-right)
  EXTREME: -90° to ±180°  (upper-right, "northwest")
Why Does the Axis Matter Clinically?
| Axis finding | Think of... |
|---|---|
| LAD + wide QRS | Left bundle branch block |
| LAD alone | LVH, inferior MI, LAFB |
| RAD + RVH pattern | Pulmonary hypertension, PE, COPD |
| RAD + RBBB | Right bundle branch block |
| Extreme (NW) axis | Ventricular tachycardia, severe RVH, hyperkalemia |
| New axis shift vs. old ECG | Possible new ischemia or block |
Sources: Guyton & Hall Textbook of Medical Physiology (14th ed.), Ganong's Review of Medical Physiology (26th ed.), Harrison's Principles of Internal Medicine (22nd ed.)
This is a shared conversation. Sign in to Orris to start your own chat.