Explain me 10 common heart disease with ECG changes and ECG Images of those disease
Reading File
Finding Sources
Searching Images
ECG electrocardiogram myocardial infarction ST elevation
Finding Sources
Searching Images
atrial fibrillation ECG irregularly irregular rhythm
Searching Images
heart block complete AV block ECG bradycardia
Searching Images
hypertrophic cardiomyopathy ECG left ventricular hypertrophy
Searching Images
Wolff-Parkinson-White syndrome ECG delta wave pre-excitation
Searching Images
ventricular tachycardia ECG wide complex tachycardia
Searching Images
pericarditis ECG saddle-shaped ST elevation diffuse leads
Searching Images
pulmonary embolism ECG S1Q3T3 right heart strain pattern
Searching Images
Brugada syndrome ECG coved ST elevation V1 V2
Searching Images
long QT syndrome ECG prolonged QT interval torsades de pointes
Here is a comprehensive guide to 10 Common Heart Diseases with ECG Changes and Images:
10 Common Heart Diseases — ECG Changes & Images
1. 🫀 ST-Elevation Myocardial Infarction (STEMI)
Overview: Acute occlusion of a coronary artery causing transmural myocardial injury. A true cardiac emergency requiring immediate reperfusion.
ECG Changes:
- ST elevation ≥1 mm in ≥2 contiguous leads (≥2 mm in precordial leads)
- Hyperacute T-waves (tall, peaked) — earliest finding
- Reciprocal ST depression in opposite leads
- Pathological Q-waves develop within hours (irreversible necrosis)
- T-wave inversions in the post-infarct stage
- Localization by leads:
- Anterior (V1–V4): LAD occlusion
- Inferior (II, III, aVF): RCA or circumflex
- Lateral (I, aVL, V5–V6): circumflex artery
ECG Image — Anterior STEMI (LAD occlusion):

ECG Image — Inferolateral STEMI:
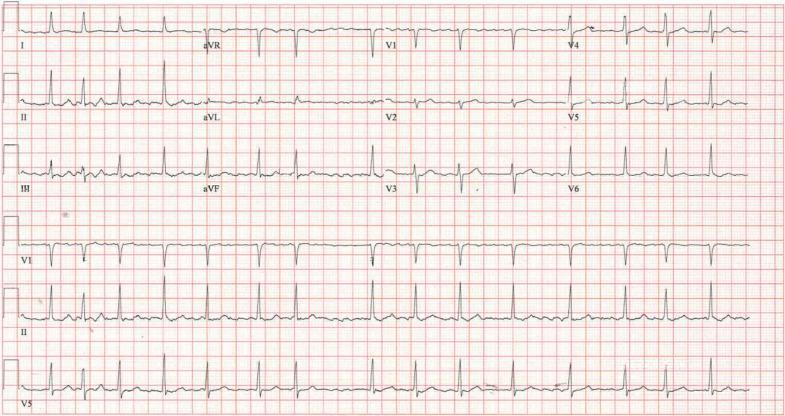
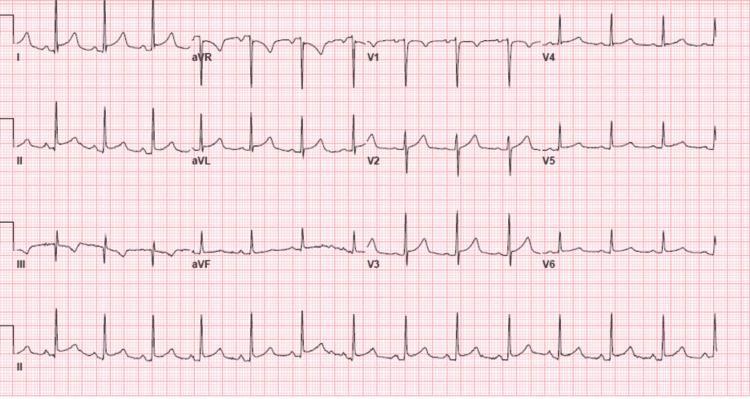
2. 💓 Atrial Fibrillation (AF)
Overview: Disorganized electrical activity in the atria producing chaotic depolarization. The most common sustained cardiac arrhythmia worldwide.
ECG Changes:
- Absent P-waves — replaced by fine fibrillatory (f) waves (best seen in V1)
- Irregularly irregular R-R intervals — the hallmark
- Narrow QRS complexes (unless aberrant conduction/WPW)
- Ventricular rate varies widely (slow, controlled, or rapid response)
- Baseline undulation rather than flat isoelectric line
ECG Image:
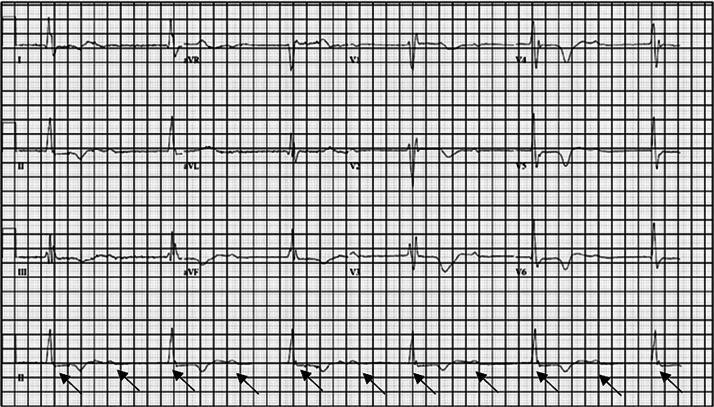
3. 💔 Complete (Third-Degree) AV Block
Overview: Complete failure of conduction between atria and ventricles. Atria and ventricles beat independently (AV dissociation).
ECG Changes:
- P-waves and QRS complexes are completely dissociated — no fixed PR interval
- Atrial rate is faster than ventricular rate
- Escape rhythm: narrow QRS (junctional, ~40–60 bpm) or wide QRS (ventricular, ~20–40 bpm)
- Profound bradycardia
- Prolonged QT may occur with ventricular escape rhythm
ECG Image:
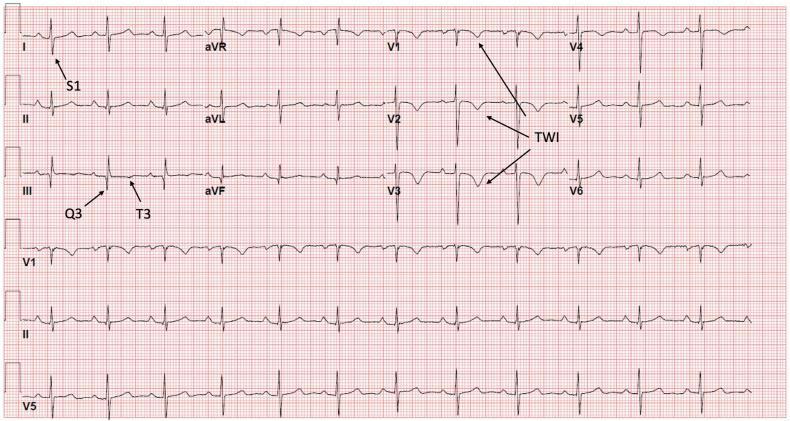
4. 🫁 Pulmonary Embolism (PE)
Overview: Acute obstruction of the pulmonary vasculature causes acute right ventricular (RV) pressure overload reflected on the ECG.
ECG Changes:
- Sinus tachycardia — most common finding
- S1Q3T3 pattern (McGinn-White sign): deep S in I, Q-wave in III, T-wave inversion in III
- T-wave inversions V1–V4 — right ventricular strain
- Incomplete or complete RBBB — acute RV dilatation
- Rightward axis deviation
- P pulmonale (peaked P in II) in massive PE
ECG Image:
5. 🏥 Acute Pericarditis
Overview: Inflammation of the pericardial sac causes diffuse epicardial injury, producing widespread ECG changes that evolve through 4 classic stages.
ECG Changes (Stage I — Acute):
- Diffuse concave (saddle-shaped) ST elevation in almost all leads EXCEPT aVR and V1
- PR-segment depression in most leads (highly specific) — aVR shows reciprocal PR elevation
- Spodick's sign: downward sloping TP segment
- No reciprocal ST changes in a typical vascular territory (unlike STEMI)
- ST:T-wave amplitude ratio in V6 >0.25 favors pericarditis
ECG Image:
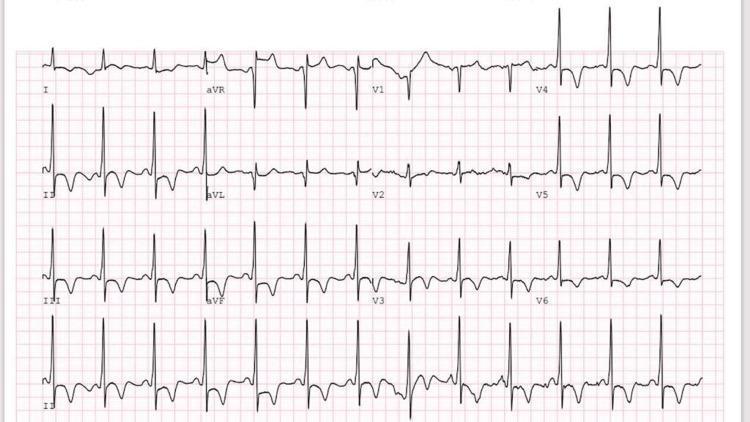
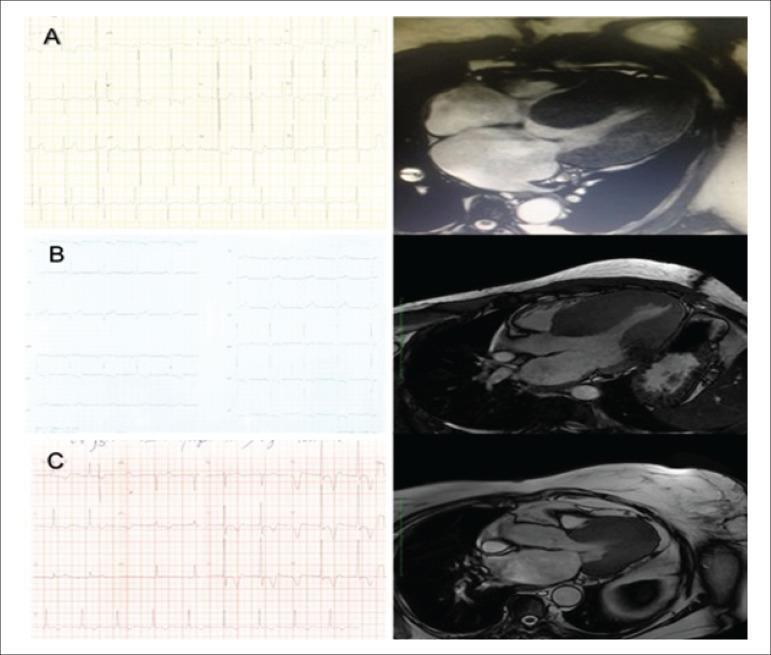
6. 🧬 Hypertrophic Cardiomyopathy (HCM)
Overview: Genetic (sarcomere protein mutations) disorder causing asymmetric myocardial hypertrophy with myofiber disarray. A leading cause of sudden death in young athletes.
ECG Changes:
- Left ventricular hypertrophy voltage criteria (Sokolow-Lyon: S in V1 + R in V5/V6 >35 mm)
- Deep T-wave inversions — especially in apical HCM (Yamaguchi syndrome): giant negative T-waves in V3–V5
- ST depression with lateral strain pattern
- Absence of septal Q-waves in I, aVL, V5, V6 (due to abnormal septal depolarization)
- Left axis deviation
- Atrial fibrillation common
ECG Image — Apical HCM (Yamaguchi syndrome):
ECG Image — HCM Variants (Composite):
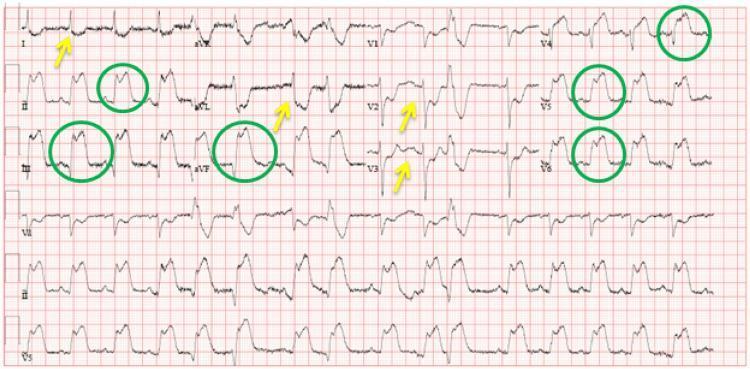
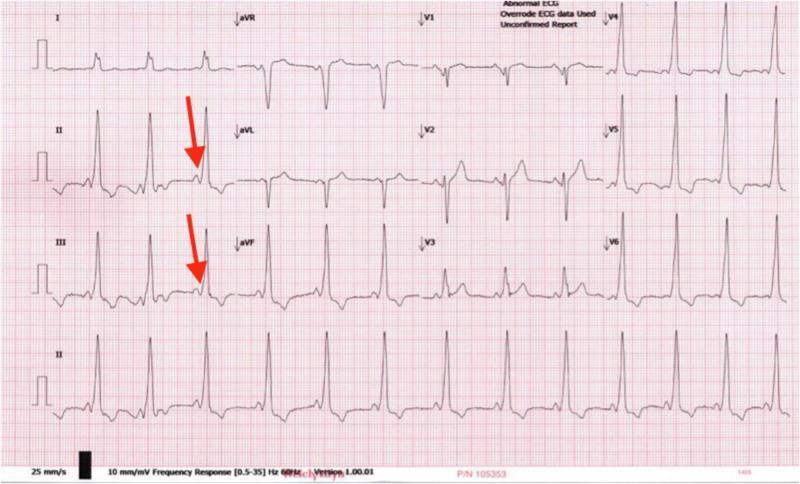
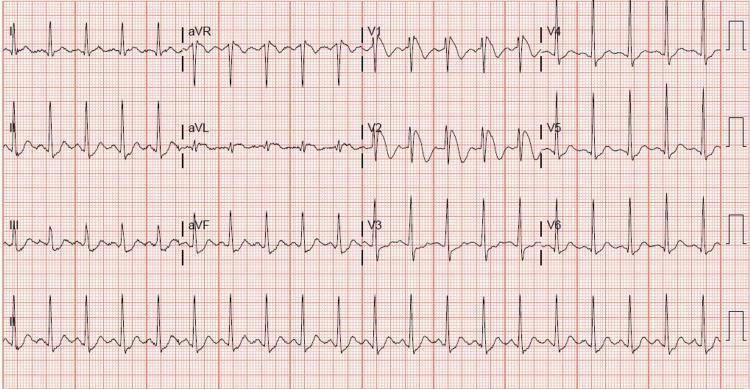
7. ⚡ Wolff-Parkinson-White (WPW) Syndrome
Overview: Presence of an accessory bypass tract (Bundle of Kent) that pre-excites the ventricle, bypassing the AV node. Can cause life-threatening tachyarrhythmias.
ECG Changes:
- Short PR interval (<120 ms) — AV node bypassed
- Delta wave — slurred initial upstroke of QRS (pre-excitation)
- Widened QRS (>120 ms) — fusion of normal and accessory conduction
- Secondary ST-T changes — discordant to QRS
- Accessory pathway location estimated by delta wave polarity:
- Negative delta in inferior leads (II, III, aVF) → posteroseptal pathway
- Positive in V1 → left-sided pathway
ECG Image:
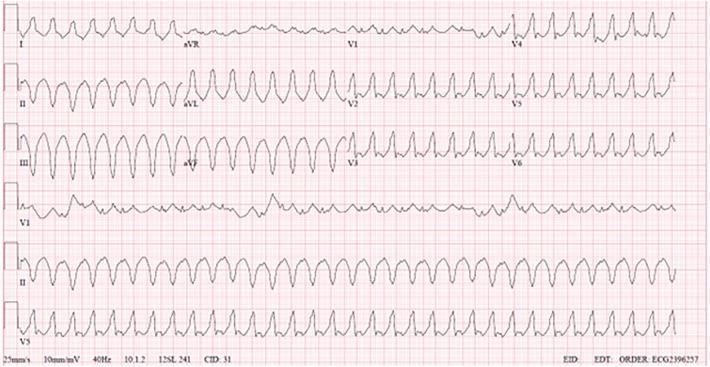
8. 💥 Ventricular Tachycardia (VT)
Overview: Rapid rhythm originating below the bundle of His, often in the context of structural heart disease (post-MI scar, cardiomyopathy). A potentially fatal arrhythmia.
ECG Changes:
- Wide QRS complexes (≥120 ms), regular, rate 100–250 bpm
- AV dissociation — P-waves unrelated to QRS (if visible)
- Fusion beats and capture beats (pathognomonic)
- Concordance in precordial leads (all positive or all negative)
- NW ("no man's land") axis — extreme right axis deviation
- Brugada criteria (RBBB-type) or Josephson's sign (notching near S-wave nadir)
ECG Image:
9. 🧬 Brugada Syndrome
Overview: Inherited sodium channelopathy (SCN5A mutation) causing a distinctive ECG pattern and increased risk of ventricular fibrillation and sudden cardiac death, particularly in young men during sleep/rest.
ECG Changes:
- Type 1 (Diagnostic) — "Coved" pattern in V1–V2 (or V1–V3 with high precordial placement):
- J-point elevation ≥2 mm
- Convex (downward) ST segment
- Negative (inverted) T-wave
- Type 2 & 3 are "saddle-back" patterns (not diagnostic alone)
- Features may be dynamic — unmasked by fever, sodium channel blockers, autonomic changes
- Arrhythmias: polymorphic VT, ventricular fibrillation
ECG Image:
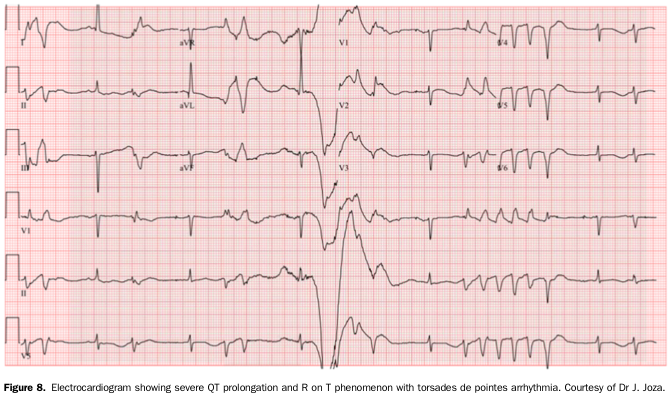
10. 📏 Long QT Syndrome (LQTS)
Overview: Inherited or acquired disorder of ventricular repolarization causing QT prolongation and risk of Torsades de Pointes (TdP) — a polymorphic VT that can degenerate to ventricular fibrillation.
ECG Changes:
- Prolonged QTc: ≥450 ms (men), ≥460 ms (women); ≥500 ms = high risk
- Abnormal T-wave morphology by subtype:
- LQT1: broad-based, smooth T-wave
- LQT2: bifid/notched T-wave (most visible)
- LQT3: long flat ST segment with late-peaked T-wave
- T-wave alternans — beat-to-beat T-wave variation; marker of high instability
- Torsades de Pointes: polymorphic VT with "twisting" QRS complexes around isoelectric line
- Triggered by "R-on-T" phenomenon, bradycardia, or pause (short-long-short sequence)
ECG Image — Prolonged QT with Torsades de Pointes:
Quick Reference Summary Table
| # | Disease | Key ECG Finding | Emergency? |
|---|---|---|---|
| 1 | STEMI | ST elevation + reciprocal depression | ✅ Yes |
| 2 | Atrial Fibrillation | No P-waves, irregularly irregular | ⚠️ Sometimes |
| 3 | Complete AV Block | AV dissociation, escape rhythm, bradycardia | ✅ Yes |
| 4 | Pulmonary Embolism | S1Q3T3, RV strain, sinus tachycardia | ✅ Yes |
| 5 | Acute Pericarditis | Saddle-shaped ST elevation, PR depression | ⚠️ Urgent |
| 6 | HCM | LVH, giant T-wave inversions (apical) | ⚠️ Monitor |
| 7 | WPW Syndrome | Short PR, delta waves, wide QRS | ✅ Risk |
| 8 | Ventricular Tachycardia | Wide complex, AV dissociation, rate >100 | ✅ Yes |
| 9 | Brugada Syndrome | Coved ST elevation V1–V2 | ✅ Risk |
| 10 | Long QT Syndrome | Prolonged QTc, T-wave alternans, TdP | ✅ Yes |
Key ECG Principle: Always interpret ECGs in full clinical context. Many patterns overlap — the combination of rate, rhythm, axis, interval measurements, and morphology together with the clinical picture guides diagnosis and management.
This is a shared conversation. Sign in to Orris to start your own chat.