
Crescendo abd des
- Crescendo abdominal description (a sign/symptom pattern)
- Crescendo murmur with "abd des" = aortic/abdominal descriptor
- Or possibly "crescendo-decrescendo" murmur (diamond-shaped), a classic auscultatory pattern seen in aortic stenosis
What does 'Crescendo abd des' refer to?
crescendo decrescendo murmur aortic stenosis phonocardiogram diagram
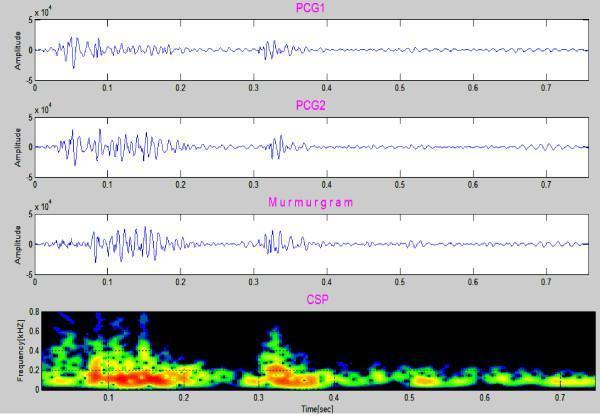
This diagnostic image displays a four-panel comparative analysis of cardiac acoustics in an 8-year-old patient with aortic stenosis. The top two panels, PCG1 and PCG2, show consecutive phonocardiogram waveforms plotted as amplitude over a 0.7-second interval. The third panel, labeled 'Murmurgram', illustrates the result of a signal subtraction method used to isolate abnormal heart sounds. The fourth panel is a Color Spectrogram (CSP), which provides a time-frequency analysis of the cardiac cycle. The CSP shows frequency components on the y-axis (kHz) and time on the x-axis, with color intensity indicating amplitude. Notably, the murmurgram demonstrates a non-flat, high-amplitude signal between S1 and S2, indicating a systolic murmur. The corresponding CSP highlights a concentration of frequency components extending up to approximately 400 Hz (0.4 kHz), peaking in mid-systole (0.1–0.2 seconds). This visual data characterizes the harsh mid-systolic murmur typical of aortic stenosis, localized between the first and second heart sounds.
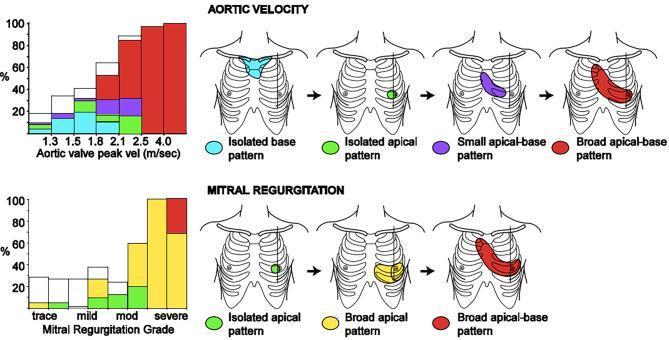
This medical comparison chart and diagram illustrate the distribution patterns of systolic murmurs in isolated Aortic Stenosis (AS) and Mitral Regurgitation (MR) based on disease severity. The upper section focuses on Aortic Velocity (n=247), showing a progression of murmur localization as peak velocity increases from 1.3 to 4.0 m/sec. Visualized patterns include isolated base (cyan), isolated apical (green), small apical-base (purple), and broad apical-base (red). As AS severity increases, the murmur evolves from localized base or apex patterns to a broad apical-base distribution. The lower section depicts Mitral Regurgitation patterns (n=174) graded from trace to severe. Murmur patterns are categorized as isolated apical (green), broad apical (yellow), and broad apical-base (red). The bar graphs quantify the percentage of patients exhibiting each pattern at different severity levels, highlighting that severe cases of both AS and MR are characterized by broader, more extensive apical-base murmur distributions on the chest wall.
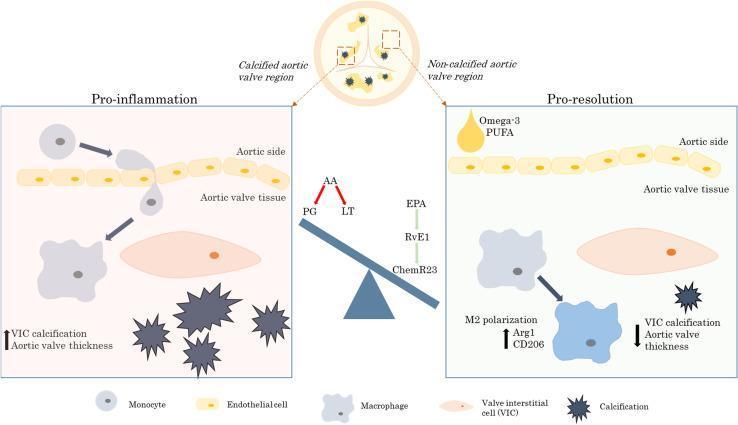
This pathophysiology diagram illustrates the cellular and molecular mechanisms of aortic valve stenosis, specifically contrasting 'Pro-inflammation' and 'Pro-resolution' pathways. The central overview shows a cross-section of an aortic valve with highlighted calcified and non-calcified regions. In the 'Pro-inflammation' panel, the diagram depicts monocyte transendothelial migration from the aortic side into the valve tissue, where they differentiate into macrophages that interact with valvular interstitial cells (VICs). This state is characterized by increased VIC calcification (shown as dark starburst shapes) and increased aortic valve thickness, driven by arachidonic acid (AA) metabolites like prostaglandins (PG) and leukotrienes (LT). Conversely, the 'Pro-resolution' panel demonstrates the therapeutic signaling axis involving Omega-3 polyunsaturated fatty acids (PUFA), eicosapentaenoic acid (EPA), resolvin E1 (RvE1), and the ChemR23 receptor. This axis promotes M2 macrophage polarization (marked by Arg1 and CD206), leading to a reduction in VIC calcification and valve thickness. The visual comparison highlights the role of specialized pro-resolving mediators in mitigating valvular disease progression by shifting the balance away from inflammatory lipid mediators.
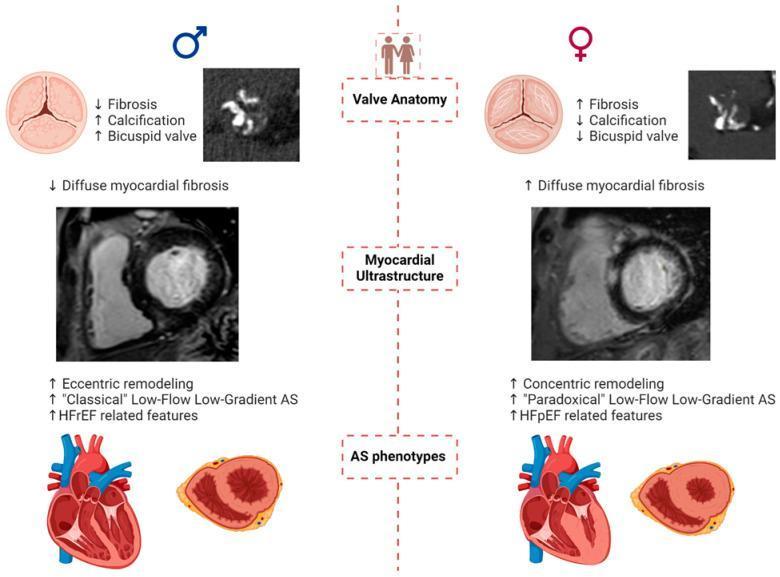
A comparative medical infographic detailing the sex-based differences in the pathophysiology and presentation of aortic stenosis (AS). The diagram is divided into three main rows: Valve Anatomy, Myocardial Ultrastructure, and AS Phenotypes, with males on the left and females on the right. In 'Valve Anatomy', males exhibit a higher prevalence of bicuspid valves with greater calcification and less fibrosis, as shown in anatomical diagrams and axial CT scans. Females show less calcification but higher levels of valvular fibrosis. Under 'Myocardial Ultrastructure', cardiac MRI frames illustrate that males typically present with diffuse myocardial fibrosis and eccentric left ventricular (LV) remodeling. Females demonstrate increased diffuse myocardial fibrosis and concentric LV remodeling. The 'AS Phenotypes' section contrasts 'Classical' Low-Flow Low-Gradient AS in males, often associated with Heart Failure with reduced Ejection Fraction (HFrEF), against 'Paradoxical' Low-Flow Low-Gradient AS in females, associated with Heart Failure with preserved Ejection Fraction (HFpEF). Cross-sectional heart diagrams reinforce these remodeling patterns, showing a dilated LV in the male phenotype and a thickened, small-cavity LV in the female phenotype.
Crescendo-Decrescendo (Diamond-Shaped) Murmur
Why the Shape?
- Early systole: the LV-to-aorta pressure gradient builds up as the LV begins ejecting - intensity rises (crescendo)
- Mid-systole: peak ejection, peak gradient - peak intensity
- Late systole: ejection slows, gradient falls - intensity fades (decrescendo)
| Murmur Configuration | Prototype |
|---|---|
| Plateau (holosystolic) | Mitral regurgitation, VSD |
| Decrescendo (diastolic) | Aortic regurgitation |
| Crescendo (pre-systolic) | Mitral stenosis (with sinus rhythm) |
| Crescendo-decrescendo | Aortic stenosis, pulmonary stenosis |
Aortic Stenosis - The Classic Example
- Harsh, loud systolic murmur
- Heard best at the right upper sternal border (2nd intercostal space)
- Radiates to both carotids (and sometimes the apex - "Gallavardin effect," where it sounds higher-pitched and purer)
- Time to peak intensity correlates with severity - a later peak = more severe AS
- Soft or absent A2 (diminished aortic component of S2)
- Pulsus parvus et tardus - weak, late-peaking carotid upstroke
- Systolic ejection click (in bicuspid AS, preceding the murmur)
Severity Assessment
| Parameter | Severe AS |
|---|---|
| Peak jet velocity | ≥ 4.0 m/s |
| Mean gradient | ≥ 40 mmHg |
| Aortic valve area (AVA) | < 1.0 cm² (or < 0.6 cm²/m² indexed) |
- Late-peaking murmur on auscultation = more severe obstruction
- Low-flow, low-gradient AS (e.g., with reduced EF or paradoxical LFLG) can underestimate severity - dobutamine stress echo helps distinguish true from pseudo-severe AS
Other Causes of Crescendo-Decrescendo Murmur
| Cause | Location | Notes |
|---|---|---|
| Aortic stenosis | RUSB, radiates to neck | Most common; harsh quality |
| Pulmonary stenosis | LUSB | Murmur spills through A2; S2 widely split |
| Hypertrophic obstructive cardiomyopathy (HOCM) | LLSB | Increases with Valsalva/standing; decreases with squatting |
| Supravalvular/subvalvular AS | Variable | Less common |
| Flow murmur (aortic sclerosis) | RUSB | Softer; peak velocity < 2 m/s; no obstruction |
The Gallavardin Effect
Quick Visual
Ishemia
Which aspect of ischemia would you like to cover?