
Alzheimer’s disease
"Alzheimer disease"[MeSH Terms] AND treatment
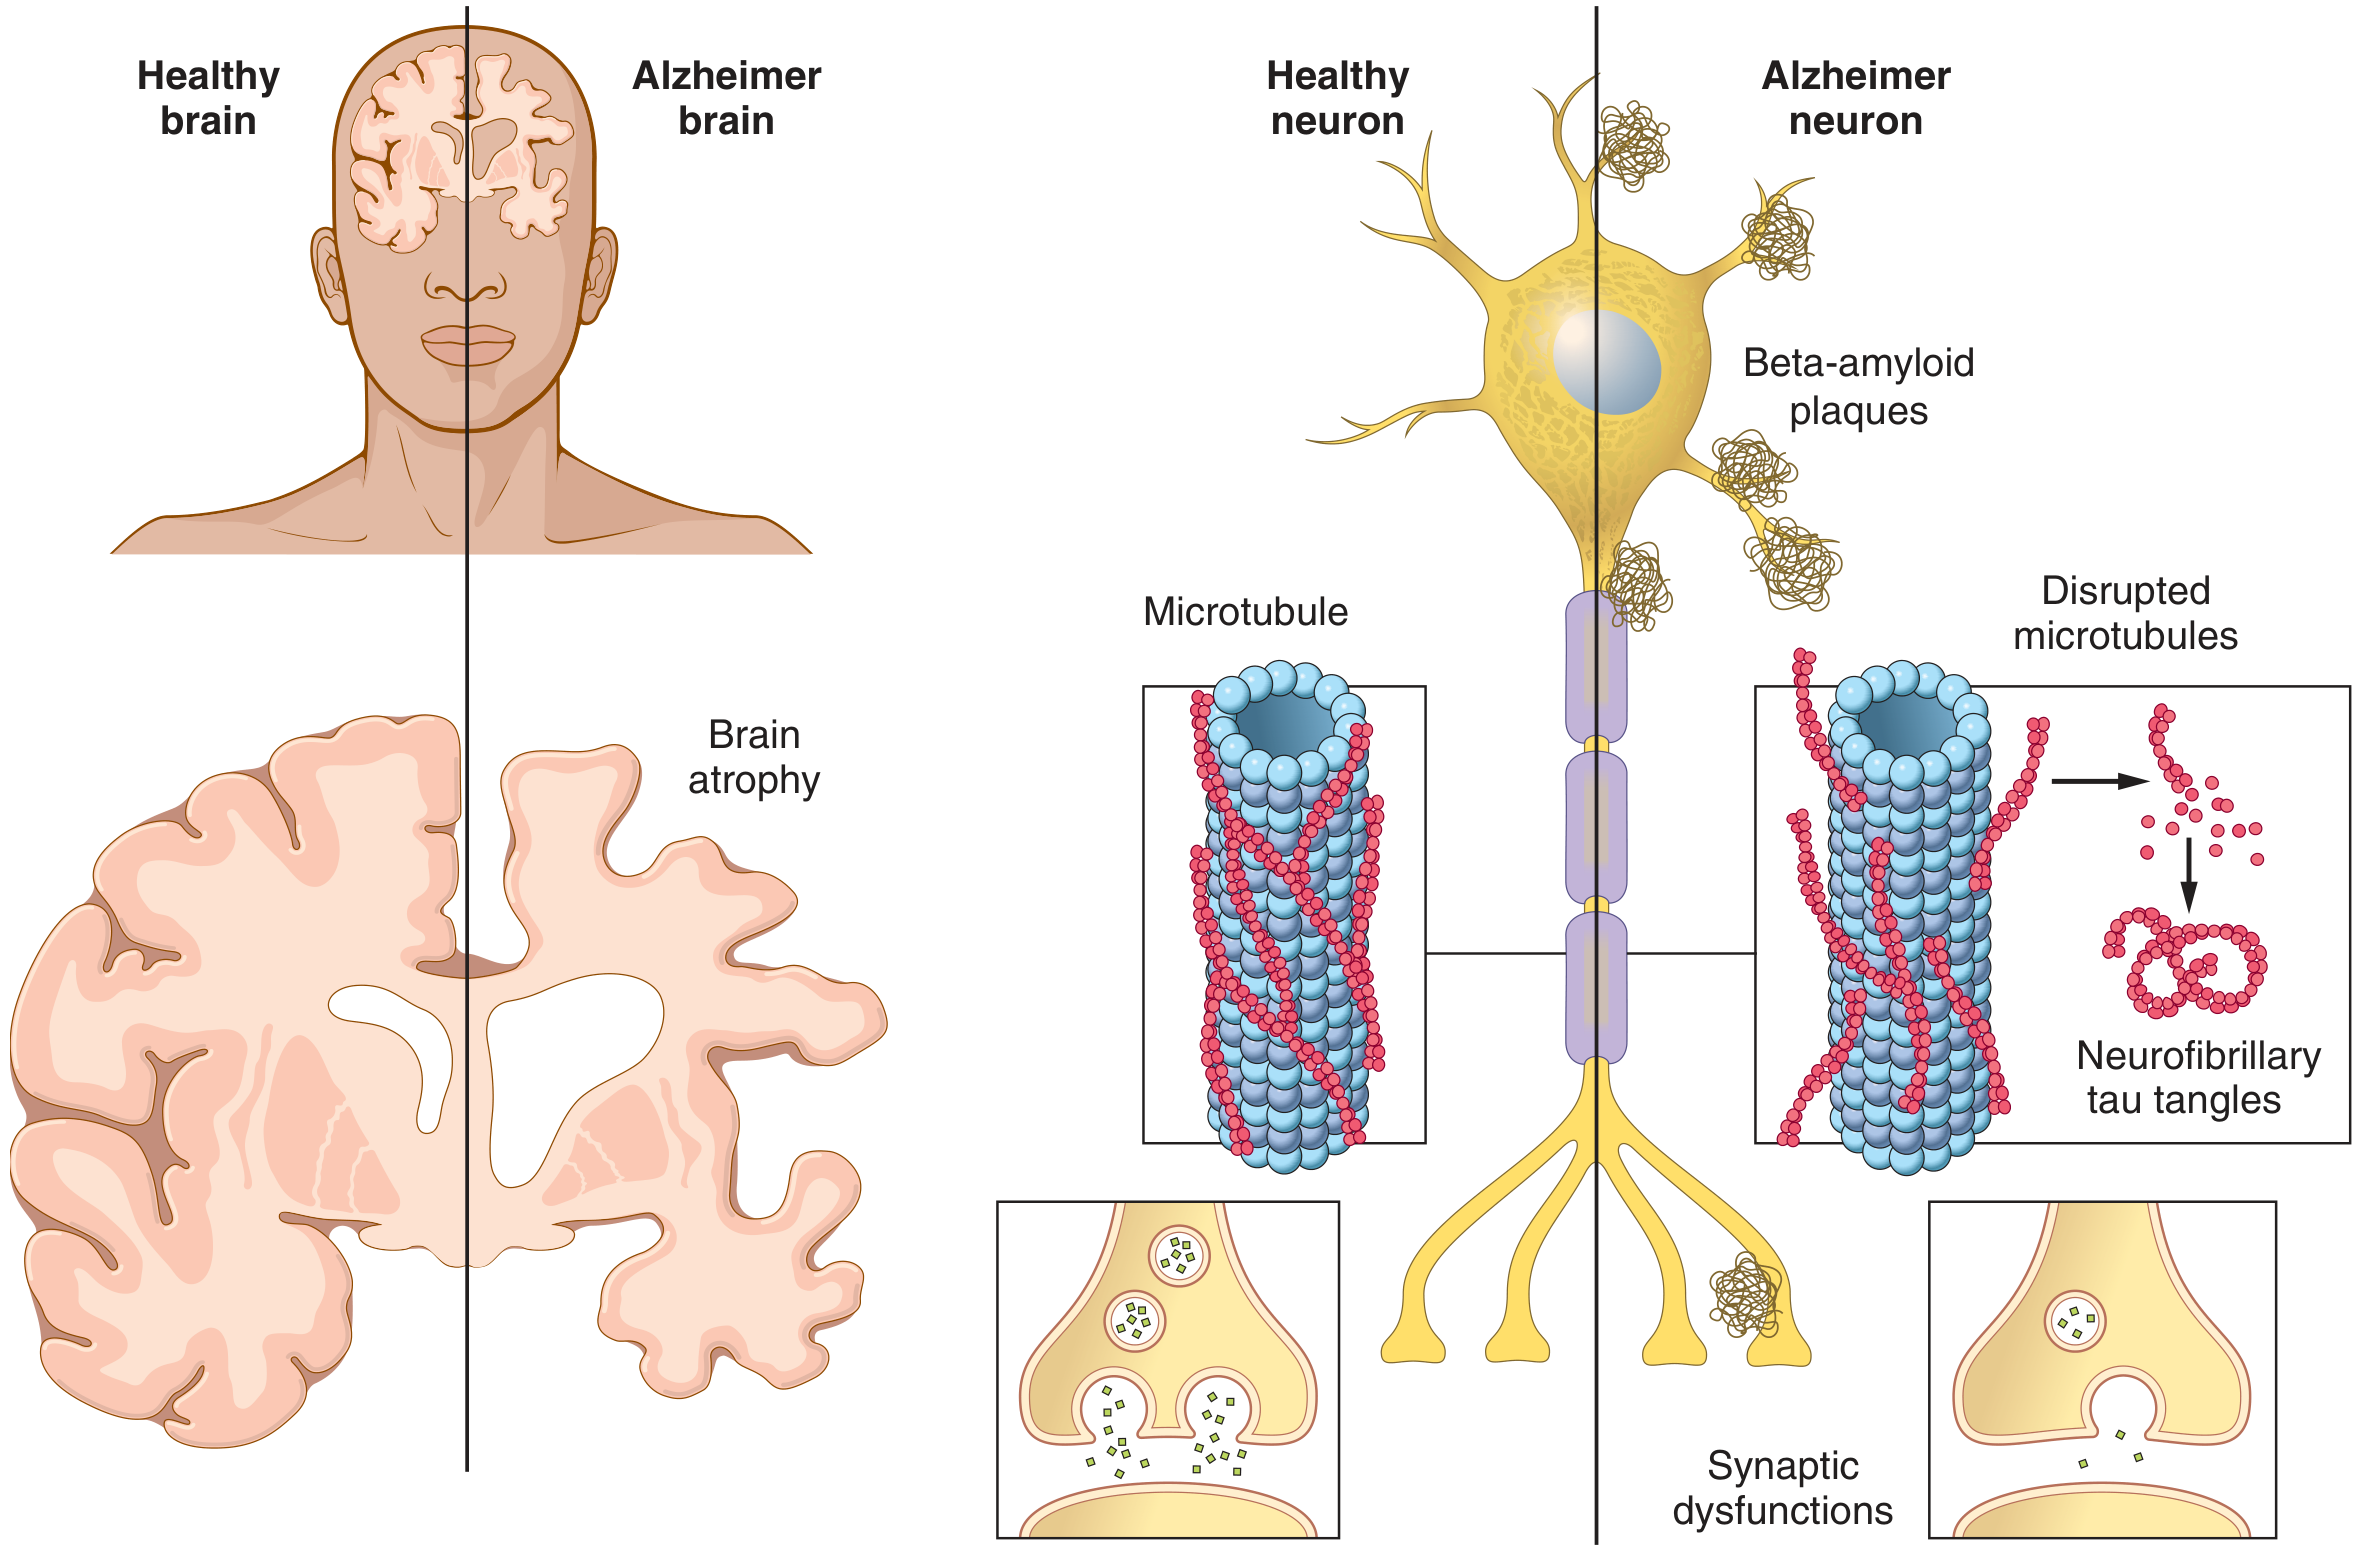
Alzheimer disease brain pathology amyloid plaques neurofibrillary tangles
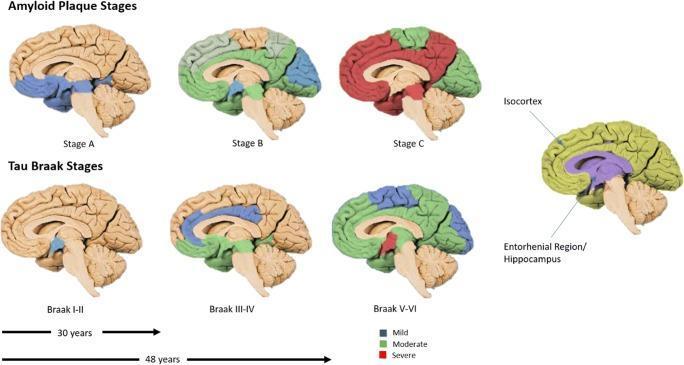
This medical schematic illustrates the neuroanatomical progression of Alzheimer’s disease pathology across different brain stages, focusing on amyloid-beta (Aβ) plaques and tau protein neurofibrillary tangles. The top row depicts Amyloid Plaque Stages A through C, showing a progression from localized mild density (blue) in the basal neocortex to moderate (green) and severe (red) densities as plaques spread throughout the isocortex. The bottom row displays the Tau Braak Stages (I-VI). Stages I-II show initial mild tau accumulation in the entorhinal region and hippocampus. Stages III-IV visualize moderate density spreading to the limbic system, while Stages V-VI demonstrate severe, widespread tau pathology throughout the isocortex. A color-coded legend indicates pathology density: blue for mild, green for moderate, and red for severe. An anatomical reference on the right identifies key regions like the Isocortex and Entorhinal Region/Hippocampus. Timelines below suggest a clinical progression spanning 30 to 48 years, highlighting the long-term nature of neurodegeneration.
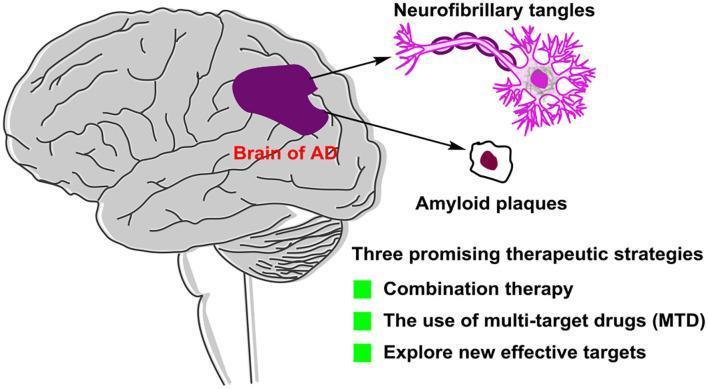
This medical infographic illustrates the pathology and future treatment strategies for Alzheimer's disease (AD). On the left, a sagittal view of a human brain labeled 'Brain of AD' highlights a central region in dark purple, indicating localized neurodegeneration or pathology. Arrows extend from this region to magnified cellular hallmarks: 'Neurofibrillary tangles' and 'Amyloid plaques.' The neurofibrillary tangles are depicted as purple, chain-like strands intertwined with a neuron's axonal and somatic structure. The amyloid plaque is shown as an extracellular deposit with a dark maroon core and a tan periphery. Below the anatomical illustrations, the graphic lists 'Three promising therapeutic strategies' for AD management: combination therapy, the use of multi-target drugs (MTD), and the exploration of new effective targets. This diagram serves as an educational summary of AD pathogenesis—specifically tau hyperphosphorylation and beta-amyloid accumulation—and the evolution of pharmacological approaches beyond traditional single-target inhibitors.
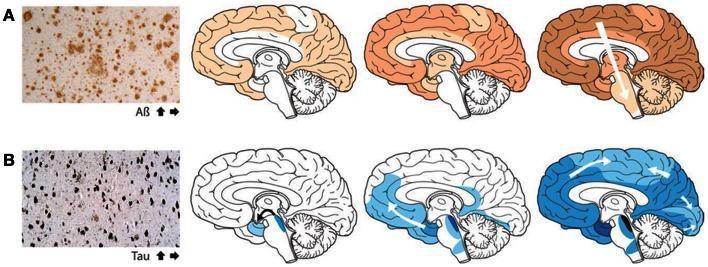
This medical illustration depicts the characteristic spatial progression of protein aggregation in Alzheimer's disease. The figure is divided into two primary rows: Row A focuses on ̢-amyloid (A̢) plaques, and Row B focuses on Tau-associated neurofibrillary tangles. Each row begins with a histological micrograph showing the morphology of the protein deposits, followed by a sequence of three sagittal brain diagrams illustrating staging. In Row A (orange shading), A̢ plaques are shown to initiate in the neocortex, subsequently spreading to the allocortex and deeper subcortical structures, following a top-down and outer-to-inner progression. In Row B (blue shading), neurofibrillary tangles are shown starting in the locus coeruleus and transentorhinal regions of the brainstem and medial temporal lobe, then progressing through the limbic system to the wider neocortex. White arrows indicate the direction of spread, emphasizing the stereotyped spatiotemporal evolution of AD pathology. This diagram serves as a pathophysiology resource for understanding Braak staging and the involvement of neuronal transport in the spread of proteopathic seeds.
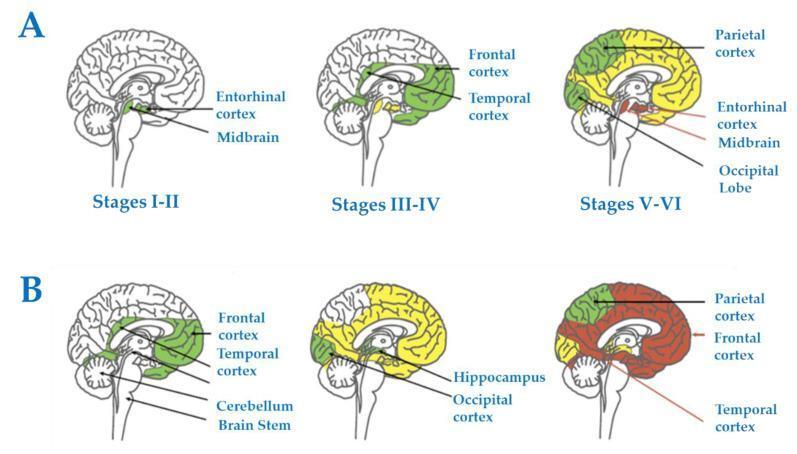
Educational medical diagram illustrating the neuropathological progression of Alzheimer's disease across two distinct pathways: (A) Tau pathology (neurofibrillary tangles, NFTs) according to Braak staging, and (B) ̢-amyloid pathology (senile plaques, SPs). Panel A uses sagittal brain sections to show Tau spreading from the entorhinal cortex and midbrain (Stages I-II) to the temporal and frontal cortices (Stages III-IV), finally involving the parietal cortex and occipital lobe (Stages V-VI). Panel B demonstrates ̢-amyloid deposition starting in the frontal and temporal cortices, progressing to the hippocampus and occipital cortex, and eventually involving the cerebellum and brainstem. The visual uses color coding (green, yellow, red) to signify the temporal and spatial expansion of pathology. This content is designed for medical education regarding the spatiotemporal evolution of AD biomarkers and the anatomical basis for Braak staging, highlighting the specific vulnerability of the entorhinal cortex as an early site of disease manifestation.
Alzheimer's Disease
Overview
Epidemiology
- Prevalence: ~5.7 million Americans have AD dementia; prevalence rises steeply with age - from 3% of those aged 65-74 to 32% of those aged 85+
- Sex: MCI is more common in men, but AD dementia is more prevalent in women (partly due to longer female lifespan)
- Lifetime risk: ~10% for men and ~20% for women from age 45
- Incidence increases with age: 2/1,000 (age 65-74), 11/1,000 (age 75-84), 37/1,000 (age 85+)
- Future burden: Estimated 15 million affected Americans by 2060
- Bradley and Daroff's Neurology in Clinical Practice
Pathophysiology
1. Beta-Amyloid Plaques
2. Neurofibrillary Tangles (NFTs)
Braak Staging and Spatial Progression
- Amyloid plaques begin in the neocortex and spread inward/downward
- Tau tangles begin in the entorhinal cortex/locus coeruleus (Braak stages I-II), spreading to the limbic system (III-IV) and then the isocortex (V-VI)
- Preclinical changes may begin 20-30 years before symptoms
Vascular Contribution
Genetics
Early-Onset (Autosomal Dominant) - Rare
| Gene | Chromosome | Notes |
|---|---|---|
| APP (Amyloid Precursor Protein) | 21 | First mutation identified; mean age of onset ~50; Down syndrome patients develop AD pathology after age 40 due to trisomy 21 |
| PSEN1 (Presenilin 1) | 14 | Most common early-onset familial AD; part of γ-secretase complex; may present with aphasia, myoclonus, seizures |
| PSEN2 (Presenilin 2) | 1 | Rarest; mostly in Volga River Russian families; also part of γ-secretase complex |
Late-Onset Risk Gene
- APOE ε4 is the most important genetic risk factor for late-onset AD
- ε4 homozygotes: mean onset age 68, lifetime risk ~91%
- ε4 heterozygotes: mean onset age 76, lifetime risk ~47%
- ε4 non-carriers: mean onset age 84, ~20% lifetime risk
- ε2 is protective
- Overall genetic heritability estimated at 58-79% (Swedish twin study)
- Bradley and Daroff's Neurology in Clinical Practice
Clinical Staging and Features
Preclinical Phase
Mild Cognitive Impairment (MCI)
- Episodic memory difficulties (forgetting conversations, misplacing items, getting lost)
- Activities of daily living largely preserved
- ~10% per year progress to dementia
Mild Dementia
- Medication errors, difficulty managing finances
- Personality changes - apathy, loss of initiative, withdrawal from hobbies
Moderate Dementia
- Needs assistance with meal preparation, bills, transportation
Severe/Terminal Dementia
- Needs assistance with bathing, dressing, toileting, eating
- Eventually all communicative abilities lost
- Death commonly from pneumonia, sepsis, or heart failure
- Posterior cortical atrophy (visuospatial deficits predominate, relatively preserved short-term memory)
- Language-predominant and executive-predominant variants
- Goldman-Cecil Medicine
Diagnosis
Biomarker Framework (AT(N))
- A - β-amyloid deposition (CSF Aβ42 ↓, or amyloid-PET positive)
- T - Pathological tau (CSF phospho-tau ↑, or tau-PET positive)
- (N) - Neurodegeneration/neuronal injury (FDG-PET hypometabolism, MRI atrophy)
Investigations
- CSF: ↓ Aβ42, ↑ total-tau, ↑ phospho-tau
- Amyloid PET: Detects Aβ plaques in vivo
- Tau PET: Detects NFTs in vivo
- FDG-PET: Hypometabolism in temporal and parietal cortex
- MRI: Hippocampal and cortical atrophy
- Goldman-Cecil Medicine
Differential Diagnosis
- Dementia with Lewy bodies (parkinsonism, visual hallucinations, REM sleep behavior disorder)
- Frontotemporal lobar degeneration (behavioral changes or language deficits early)
- Vascular dementia (often coexists with AD)
- Normal pressure hydrocephalus (dementia + gait disorder + urinary incontinence)
- Hippocampal sclerosis
Treatment
Symptomatic Pharmacotherapy
- Donepezil 5-10 mg/day
- Galantamine (immediate-release) 16-24 mg/day
- Rivastigmine 6-12 mg/day orally, or 4.5-9 mg/day transdermal patch
- Memantine 10 mg twice daily - delays functional decline; acts as a low-affinity uncompetitive NMDA (glutamate) receptor antagonist
Disease-Modifying Therapies (Anti-Amyloid Antibodies)
| Drug | Status | Key Data |
|---|---|---|
| Lecanemab | FDA-approved 2023 | Reduced amyloid on PET; slowed functional/cognitive decline by ~27% vs. placebo over 18 months; risks: brain edema and hemorrhage (ARIA) |
| Donanemab | Approved (similar data) | Comparable efficacy to lecanemab |
| Aducanumab | FDA-approved 2021 (status uncertain) | Regulatory controversy |
Non-Pharmacological and Safety
- No established preventive therapy; evidence for diet, exercise, and cognitive activities is limited
- Mediterranean diet shows modest protective effect (recent 2025 meta-analysis, PMID 39797935)
- Caregiver support through organizations like the Alzheimer's Association is a critical intervention
- Safety issues: supervise medications, finances, driving, firearms; wandering is common
Prognosis
- AD is inevitably progressive - severe impairment and complete dependence develop in virtually all patients
- Mortality ~10%/year once diagnosed
- In advanced dementia, 6-month mortality ~55%
- Poor prognostic signs: pneumonia, fever, eating problems
- Elevated amyloid AND tau on PET scan indicates much higher risk of progression than either alone
- Goldman-Cecil Medicine
Recent Evidence Updates (2024-2026)
- Updated appropriate use criteria for amyloid and tau PET from the Alzheimer's Association (2025) provide guidance on when to use these biomarker imaging tests clinically [PMID 39776249]
- A 2025 meta-analysis confirmed that Mediterranean diet adherence reduces risk of cognitive impairment and AD [PMID 39797935]
- Clinical criteria for LATE (limbic-predominant age-related TDP-43 encephalopathy) have been formally established (2025), important since LATE mimics AD clinically and often coexists with it [PMID 39807681]
Pharmacokinetics of Drug Interaction: Pharmacokinetic drug interactions, Inhibition and Induction of Drug metabolism, Inhibition of Biliary Excretion.CLINICAL PHARMACOKINETICS AND THERAPEUTIC DRUG MONITORING. CREATE THE PPT SLIDES BRIEF EXPLAIN AND UNDERSTAND
mkdir -p /tmp/workspace/pharmacokinetics-ppt && ls /tmp/workspace/
~/pharmacokinetics-ppt/build_ppt.py
from pptx import Presentation
from pptx.util import Inches, Pt, Emu
from pptx.dml.color import RGBColor
from pptx.enum.text import PP_ALIGN, MSO_ANCHOR
from pptx.util import Inches, Pt
import copy

# ── Colour palette ──────────────────────────────────────────────
DARK_BLUE   = RGBColor(0x0A, 0x2D, 0x6E)   # deep navy
MID_BLUE    = RGBColor(0x1A, 0x5F, 0xB4)   # accent blue
ACCENT      = RGBColor(0x00, 0xB4, 0xD8)   # teal
LIGHT_BG    = RGBColor(0xEA, 0xF4, 0xFF)   # very light blue
WHITE       = RGBColor(0xFF, 0xFF, 0xFF)
DARK_TEXT   = RGBColor(0x1A, 0x1A, 0x2E)
ORANGE      = RGBColor(0xF4, 0x8C, 0x06)
GREEN       = RGBColor(0x06, 0x8B, 0x3A)
RED         = RGBColor(0xC0, 0x39, 0x2B)
YELLOW_BG   = RGBColor(0xFF, 0xF3, 0xCD)
LIGHT_GREEN_BG = RGBColor(0xD4, 0xED, 0xDA)
LIGHT_RED_BG   = RGBColor(0xF8, 0xD7, 0xDA)

prs = Presentation()
prs.slide_width  = Inches(13.333)
prs.slide_height = Inches(7.5)
blank = prs.slide_layouts[6]

# ── Helper functions ─────────────────────────────────────────────
def add_rect(slide, x, y, w, h, fill_color, border_color=None, border_width=None):
    shape = slide.shapes.add_shape(1, Inches(x), Inches(y), Inches(w), Inches(h))
    shape.fill.solid()
    shape.fill.fore_color.rgb = fill_color
    if border_color:
        shape.line.color.rgb = border_color
        if border_width:
            shape.line.width = Pt(border_width)
    else:
        shape.line.fill.background()
    return shape

def add_textbox(slide, x, y, w, h, text, font_size, bold=False, color=DARK_TEXT,
                align=PP_ALIGN.LEFT, italic=False, wrap=True):
    tb = slide.shapes.add_textbox(Inches(x), Inches(y), Inches(w), Inches(h))
    tf = tb.text_frame
    tf.word_wrap = wrap
    tf.margin_left = Pt(4)
    tf.margin_right = Pt(4)
    tf.margin_top = Pt(2)
    tf.margin_bottom = Pt(2)
    p = tf.paragraphs[0]
    p.alignment = align
    run = p.add_run()
    run.text = text
    run.font.size = Pt(font_size)
    run.font.bold = bold
    run.font.italic = italic
    run.font.color.rgb = color
    run.font.name = "Calibri"
    return tb

def add_textbox_multiline(slide, x, y, w, h, lines, font_size, bold=False,
                           color=DARK_TEXT, align=PP_ALIGN.LEFT, line_spacing=None):
    """lines = list of (text, bold, color, size_override) or just str"""
    tb = slide.shapes.add_textbox(Inches(x), Inches(y), Inches(w), Inches(h))
    tf = tb.text_frame
    tf.word_wrap = True
    tf.margin_left = Pt(6)
    tf.margin_right = Pt(4)
    tf.margin_top = Pt(2)
    tf.margin_bottom = Pt(2)
    first = True
    for item in lines:
        if isinstance(item, str):
            txt, b, c, sz = item, bold, color, font_size
        else:
            txt = item[0]
            b   = item[1] if len(item) > 1 else bold
            c   = item[2] if len(item) > 2 else color
            sz  = item[3] if len(item) > 3 else font_size
        if first:
            p = tf.paragraphs[0]
            first = False
        else:
            p = tf.add_paragraph()
        p.alignment = align
        if line_spacing:
            from pptx.util import Pt as _Pt
            p.space_before = _Pt(line_spacing)
        run = p.add_run()
        run.text = txt
        run.font.size = Pt(sz)
        run.font.bold = b
        run.font.color.rgb = c
        run.font.name = "Calibri"
    return tb

def header_bar(slide, title, subtitle=None):
    add_rect(slide, 0, 0, 13.333, 1.15, DARK_BLUE)
    add_rect(slide, 0, 1.15, 13.333, 0.07, ACCENT)
    add_textbox(slide, 0.3, 0.08, 12.5, 0.65, title,
                font_size=28, bold=True, color=WHITE, align=PP_ALIGN.LEFT)
    if subtitle:
        add_textbox(slide, 0.3, 0.72, 12.5, 0.4, subtitle,
                    font_size=14, bold=False, color=ACCENT, align=PP_ALIGN.LEFT)

def footer_bar(slide, text="Pharmacokinetics of Drug Interactions & TDM"):
    add_rect(slide, 0, 7.1, 13.333, 0.4, DARK_BLUE)
    add_textbox(slide, 0.3, 7.13, 12.5, 0.3, text,
                font_size=9, color=RGBColor(0xBB, 0xCC, 0xFF), align=PP_ALIGN.LEFT)

def bullet_box(slide, x, y, w, h, title, bullets, title_color=DARK_BLUE,
               title_size=13, bullet_size=11, bg_color=LIGHT_BG, border=None):
    add_rect(slide, x, y, w, h, bg_color,
             border_color=border or MID_BLUE, border_width=1)
    add_textbox(slide, x+0.1, y+0.08, w-0.2, 0.35, title,
                font_size=title_size, bold=True, color=title_color)
    lines = []
    for b in bullets:
        lines.append(("  • " + b, False, DARK_TEXT, bullet_size))
    add_textbox_multiline(slide, x+0.1, y+0.4, w-0.2, h-0.5, lines,
                          font_size=bullet_size, line_spacing=2)

# ═══════════════════════════════════════════════════════════════
# SLIDE 1 – TITLE SLIDE
# ═══════════════════════════════════════════════════════════════
slide = prs.slides.add_slide(blank)
add_rect(slide, 0, 0, 13.333, 7.5, DARK_BLUE)
add_rect(slide, 0, 0, 13.333, 0.08, ACCENT)
add_rect(slide, 0, 7.42, 13.333, 0.08, ACCENT)
# Diagonal accent
add_rect(slide, 9.5, 0, 0.06, 7.5, ACCENT)
add_rect(slide, 9.7, 0, 0.03, 7.5, RGBColor(0x00, 0x80, 0xA0))

add_textbox(slide, 0.8, 1.0, 8.5, 0.7,
            "PHARMACOKINETICS OF", 20, bold=True, color=ACCENT)
add_textbox(slide, 0.8, 1.6, 8.5, 1.4,
            "Drug Interactions\n& Therapeutic Drug Monitoring", 38,
            bold=True, color=WHITE)
add_textbox(slide, 0.8, 3.15, 8.5, 0.05, "─" * 48, 12, color=ACCENT)
add_textbox_multiline(slide, 0.8, 3.3, 8.5, 2.5, [
    ("Topics Covered:", True, ACCENT, 14),
    ("  ✦  Pharmacokinetic Drug Interactions", False, WHITE, 12),
    ("  ✦  Inhibition & Induction of Drug Metabolism", False, WHITE, 12),
    ("  ✦  Inhibition of Biliary Excretion", False, WHITE, 12),
    ("  ✦  Clinical Pharmacokinetics", False, WHITE, 12),
    ("  ✦  Therapeutic Drug Monitoring (TDM)", False, WHITE, 12),
], font_size=12, line_spacing=3)
add_textbox(slide, 0.8, 6.6, 8.5, 0.5, "Based on Goodman & Gilman | Katzung | Goldman-Cecil Medicine",
            10, color=RGBColor(0x88, 0xAA, 0xFF))

# ═══════════════════════════════════════════════════════════════
# SLIDE 2 – OVERVIEW: TYPES OF DRUG INTERACTIONS
# ═══════════════════════════════════════════════════════════════
slide = prs.slides.add_slide(blank)
add_rect(slide, 0, 0, 13.333, 7.5, RGBColor(0xF5, 0xF8, 0xFF))
header_bar(slide, "Drug Interactions — Overview", "How one drug alters the effect of another")
footer_bar(slide)

add_textbox(slide, 0.3, 1.35, 12.5, 0.35,
            "A drug interaction occurs when coadministration of another drug alters the effect (increased toxicity or therapeutic failure).",
            11, color=DARK_TEXT)

# Two big boxes
add_rect(slide, 0.3, 1.8, 5.9, 4.8, RGBColor(0xE8, 0xF4, 0xFF), border_color=MID_BLUE, border_width=2)
add_rect(slide, 0.3, 1.8, 5.9, 0.45, MID_BLUE)
add_textbox(slide, 0.4, 1.85, 5.7, 0.35, "PHARMACOKINETIC INTERACTIONS", 14, bold=True, color=WHITE)
add_textbox_multiline(slide, 0.4, 2.35, 5.6, 4.1, [
    ("Mechanism: altered ADME processes", True, DARK_BLUE, 11),
    ("", False, DARK_TEXT, 6),
    ("A  Absorption — altered GI pH, motility,", False, DARK_TEXT, 11),
    ("    chelation, P-glycoprotein effects", False, DARK_TEXT, 11),
    ("D  Distribution — plasma protein binding", False, DARK_TEXT, 11),
    ("    displacement, altered Vd", False, DARK_TEXT, 11),
    ("M  Metabolism — CYP450 inhibition/induction,", False, DARK_TEXT, 11),
    ("    phase II enzyme changes", False, DARK_TEXT, 11),
    ("E  Excretion — renal tubular transport,", False, DARK_TEXT, 11),
    ("    biliary excretion, enterohepatic cycling", False, DARK_TEXT, 11),
    ("", False, DARK_TEXT, 6),
    ("Result: change in plasma drug concentration", True, RED, 11),
], font_size=11, line_spacing=2)

add_rect(slide, 7.0, 1.8, 5.9, 4.8, RGBColor(0xFF, 0xF0, 0xE8), border_color=ORANGE, border_width=2)
add_rect(slide, 7.0, 1.8, 5.9, 0.45, ORANGE)
add_textbox(slide, 7.1, 1.85, 5.7, 0.35, "PHARMACODYNAMIC INTERACTIONS", 14, bold=True, color=WHITE)
add_textbox_multiline(slide, 7.1, 2.35, 5.6, 4.1, [
    ("Mechanism: additive/synergistic/antagonistic", True, RGBColor(0x8B, 0x3A, 0x00), 11),
    ("pharmacologic effects (no PK change)", False, RGBColor(0x8B, 0x3A, 0x00), 10),
    ("", False, DARK_TEXT, 6),
    ("Synergism:  Aspirin + Warfarin → bleeding risk", False, DARK_TEXT, 11),
    ("Summation:  2 CNS depressants → sedation", False, DARK_TEXT, 11),
    ("Antagonism: Beta-blocker + salbutamol", False, DARK_TEXT, 11),
    ("", False, DARK_TEXT, 6),
    ("Example: Benzodiazepine + Opioid", True, RED, 11),
    ("→ additive CNS depression (PD, not PK)", False, RED, 11),
    ("", False, DARK_TEXT, 6),
    ("Result: change in drug effect WITHOUT", True, ORANGE, 11),
    ("change in plasma concentration", False, ORANGE, 11),
], font_size=11, line_spacing=2)

# ═══════════════════════════════════════════════════════════════
# SLIDE 3 – PHARMACOKINETIC INTERACTIONS: ADME DETAILS
# ═══════════════════════════════════════════════════════════════
slide = prs.slides.add_slide(blank)
add_rect(slide, 0, 0, 13.333, 7.5, RGBColor(0xF5, 0xF8, 0xFF))
header_bar(slide, "Pharmacokinetic Drug Interactions — ADME", "Mechanisms at each step of drug disposition")
footer_bar(slide)

boxes = [
    (0.25, 1.35, 3.0, 5.6, ORANGE, RGBColor(0xFF, 0xF0, 0xD0), "A — ABSORPTION", [
        "Altered GI pH", "→ Antacids ↓ ketoconazole absorption", "Chelation: tetracycline + Ca²⁺/Fe²⁺",
        "P-gp inhibition:", "→ quinidine ↑ digoxin levels", "Motility changes: metoclopramide",
        "↑ gastric emptying → ↑ absorption",
    ]),
    (3.45, 1.35, 3.0, 5.6, MID_BLUE, LIGHT_BG, "D — DISTRIBUTION", [
        "Plasma protein binding", "displacement", "→ Warfarin displaced by", "   aspirin → more free drug",
        "Altered volume of", "distribution (Vd)", "→ Changes drug levels",
    ]),
    (6.65, 1.35, 3.0, 5.6, GREEN, RGBColor(0xD4, 0xED, 0xDA), "M — METABOLISM", [
        "CYP450 INHIBITION", "→ ↑ drug levels (toxicity)",
        "CYP450 INDUCTION", "→ ↓ drug levels (failure)",
        "Phase II: UGT, SULT", "conjugation inhibited",
        "Most clinically important!",
    ]),
    (9.85, 1.35, 3.1, 5.6, RED, RGBColor(0xF8, 0xD7, 0xDA), "E — EXCRETION", [
        "Renal tubular secretion:", "→ Probenecid blocks penicillin",
        "Urine pH changes:", "→ alkaline urine traps amphetamine",
        "Biliary transport (P-gp,", "MRP2, OATP):", "→ inhibition ↑ plasma levels",
    ]),
]
for bx, by, bw, bh, hdr_color, bg_color, title, items in boxes:
    add_rect(slide, bx, by, bw, bh, bg_color, border_color=hdr_color, border_width=2)
    add_rect(slide, bx, by, bw, 0.45, hdr_color)
    add_textbox(slide, bx+0.08, by+0.08, bw-0.15, 0.32, title, 12, bold=True, color=WHITE)
    lines = [("  • " + i, False, DARK_TEXT, 10) for i in items]
    add_textbox_multiline(slide, bx+0.1, by+0.5, bw-0.18, bh-0.6, lines, font_size=10, line_spacing=3)

# ═══════════════════════════════════════════════════════════════
# SLIDE 4 – CYP450 SYSTEM
# ═══════════════════════════════════════════════════════════════
slide = prs.slides.add_slide(blank)
add_rect(slide, 0, 0, 13.333, 7.5, RGBColor(0xF5, 0xF8, 0xFF))
header_bar(slide, "Cytochrome P450 (CYP450) — The Master Switch", "Responsible for ~75% of all drug metabolism")
footer_bar(slide)

add_textbox(slide, 0.3, 1.3, 12.5, 0.3,
            "CYP450 enzymes are located mainly in hepatocytes (endoplasmic reticulum) and intestinal epithelium. They catalyse oxidative Phase I reactions.",
            10, color=DARK_TEXT)

# CYP isozyme table
cols_x = [0.3, 3.0, 6.2, 9.5]
col_w  = [2.7, 3.1, 3.2, 3.5]
col_titles = ["CYP Isozyme", "Key Substrates", "Inhibitors", "Inducers"]
col_colors = [DARK_BLUE, MID_BLUE, RED, GREEN]
row_data = [
    ["CYP1A2",  "Caffeine, Clozapine,\nTheophylline, Haloperidol",
                "Fluvoxamine, Ciprofloxacin,\nAmiodarone",
                "Smoking, Omeprazole,\nRifampin"],
    ["CYP2C9",  "Warfarin, Phenytoin,\nIbuprofen, Glimepiride",
                "Fluconazole, Amiodarone,\nMetronidazole",
                "Rifampin, Carbamazepine,\nPhenobarbital"],
    ["CYP2C19", "Omeprazole, Clopidogrel,\nDiazepam, SSRIs",
                "Omeprazole, Fluvoxamine,\nFluoxetine",
                "Rifampin, Carbamazepine"],
    ["CYP2D6",  "Codeine→Morphine, SSRIs,\nPropranolol, Haloperidol",
                "Fluoxetine, Paroxetine,\nBupropion, Quinidine",
                "None (not inducible*)"],
    ["CYP3A4/5","Statins, Cyclosporine,\nErythromycin, Nifedipine,\nCarbamazepine",
                "Ketoconazole, Erythromycin,\nGrapefruit juice, Ritonavir",
                "Rifampin, Phenobarbital,\nPhenytoin, Dexamethasone,\nSt. John's Wort"],
]
# Header row
row_y = 1.65
for ci, (cx, cw, ct, cc) in enumerate(zip(cols_x, col_w, col_titles, col_colors)):
    add_rect(slide, cx, row_y, cw, 0.38, cc)
    add_textbox(slide, cx+0.05, row_y+0.04, cw-0.1, 0.3, ct, 11, bold=True, color=WHITE)

row_y = 2.04
row_bg = [RGBColor(0xEA, 0xF4, 0xFF), RGBColor(0xF5, 0xF9, 0xFF)]
for ri, row in enumerate(row_data):
    rh = 0.92 if ri == 4 else 0.88
    for ci, (cx, cw, cell) in enumerate(zip(cols_x, col_w, row)):
        bg = row_bg[ri % 2] if ci > 0 else RGBColor(0xD0, 0xE8, 0xFF)
        add_rect(slide, cx, row_y, cw, rh, bg, border_color=RGBColor(0xCC, 0xDD, 0xEE), border_width=0.5)
        add_textbox(slide, cx+0.06, row_y+0.04, cw-0.12, rh-0.08, cell, 9.5,
                    bold=(ci == 0), color=DARK_BLUE if ci == 0 else DARK_TEXT)
    row_y += rh

add_textbox(slide, 0.3, 7.0, 12.5, 0.22,
            "* CYP2D6 is not susceptible to enzyme induction. Grapefruit juice inhibits intestinal CYP3A4, increasing oral bioavailability of many drugs.",
            8.5, italic=True, color=RGBColor(0x55, 0x66, 0x88))

# ═══════════════════════════════════════════════════════════════
# SLIDE 5 – ENZYME INHIBITION
# ═══════════════════════════════════════════════════════════════
slide = prs.slides.add_slide(blank)
add_rect(slide, 0, 0, 13.333, 7.5, RGBColor(0xF5, 0xF8, 0xFF))
header_bar(slide, "Inhibition of Drug Metabolism", "CYP450 inhibition → ↑ plasma drug concentration → toxicity risk")
footer_bar(slide)

# Left explanation box
add_rect(slide, 0.25, 1.35, 6.0, 5.5, RGBColor(0xFF, 0xF0, 0xF0), border_color=RED, border_width=2)
add_rect(slide, 0.25, 1.35, 6.0, 0.42, RED)
add_textbox(slide, 0.35, 1.38, 5.8, 0.34, "MECHANISM OF INHIBITION", 14, bold=True, color=WHITE)
add_textbox_multiline(slide, 0.35, 1.85, 5.7, 4.9, [
    ("Competitive Inhibition", True, RED, 12),
    ("  • Inhibitor competes for active site of CYP", False, DARK_TEXT, 10),
    ("  • Reversible; effect wears off as inhibitor clears", False, DARK_TEXT, 10),
    ("  • Most common type clinically", False, DARK_TEXT, 10),
    ("", False, DARK_TEXT, 5),
    ("Mechanism-Based (Suicide) Inhibition", True, RED, 12),
    ("  • Inhibitor irreversibly binds and destroys CYP", False, DARK_TEXT, 10),
    ("  • Effect persists until NEW enzyme is synthesised", False, DARK_TEXT, 10),
    ("  • Example: Erythromycin, Grapefruit juice (CYP3A4)", False, DARK_TEXT, 10),
    ("", False, DARK_TEXT, 5),
    ("Clinical Consequence", True, DARK_BLUE, 12),
    ("  • Substrate drug accumulates → TOXICITY", False, RED, 11),
    ("  • Effect appears quickly (hours–days)", False, DARK_TEXT, 10),
    ("  • Dose reduction of substrate often needed", False, DARK_TEXT, 10),
    ("", False, DARK_TEXT, 5),
    ("Key Examples:", True, DARK_BLUE, 12),
    ("  • Ketoconazole inhibits CYP3A4:", False, DARK_TEXT, 10),
    ("    → ↑ simvastatin → rhabdomyolysis", False, RED, 10),
    ("  • Fluoxetine inhibits CYP2D6:", False, DARK_TEXT, 10),
    ("    → ↑ tricyclic antidepressants → arrhythmia", False, RED, 10),
    ("  • Ritonavir inhibits CYP3A4:", False, DARK_TEXT, 10),
    ("    → boosting effect in HIV therapy (intentional)", False, GREEN, 10),
], font_size=10, line_spacing=2)

# Right consequence diagram
add_rect(slide, 6.6, 1.35, 6.4, 5.5, RGBColor(0xF0, 0xF8, 0xFF), border_color=MID_BLUE, border_width=2)
add_rect(slide, 6.6, 1.35, 6.4, 0.42, MID_BLUE)
add_textbox(slide, 6.7, 1.38, 6.2, 0.34, "INHIBITION: CONCENTRATION–TIME EFFECT", 12, bold=True, color=WHITE)

# Simple flow diagram
steps_inh = [
    ("Inhibitor drug added", MID_BLUE, WHITE),
    ("CYP enzyme bound/blocked", RED, WHITE),
    ("↓ Metabolism of substrate drug", RED, WHITE),
    ("↑ Plasma concentration of substrate", ORANGE, WHITE),
    ("Potential TOXICITY if narrow TI drug", RED, WHITE),
]
sy = 1.95
for i, (txt, bg, fg) in enumerate(steps_inh):
    add_rect(slide, 7.0, sy, 5.6, 0.55, bg)
    add_textbox(slide, 7.05, sy+0.08, 5.5, 0.38, txt, 12, bold=True, color=fg, align=PP_ALIGN.CENTER)
    if i < len(steps_inh)-1:
        add_textbox(slide, 9.2, sy+0.57, 1.2, 0.22, "▼", 14, bold=True, color=DARK_BLUE, align=PP_ALIGN.CENTER)
    sy += 0.77

add_rect(slide, 7.0, sy+0.12, 5.6, 0.9, YELLOW_BG, border_color=ORANGE, border_width=1.5)
add_textbox_multiline(slide, 7.1, sy+0.2, 5.4, 0.8, [
    ("Narrow Therapeutic Index (NTI) drugs at highest risk:", True, DARK_BLUE, 10),
    ("Warfarin, Digoxin, Lithium, Cyclosporine, Phenytoin", False, RED, 10),
], font_size=10)

# ═══════════════════════════════════════════════════════════════
# SLIDE 6 – ENZYME INDUCTION
# ═══════════════════════════════════════════════════════════════
slide = prs.slides.add_slide(blank)
add_rect(slide, 0, 0, 13.333, 7.5, RGBColor(0xF5, 0xF8, 0xFF))
header_bar(slide, "Induction of Drug Metabolism", "CYP450 induction → ↓ plasma drug concentration → therapeutic failure")
footer_bar(slide)

# Left explanation box
add_rect(slide, 0.25, 1.35, 6.0, 5.5, RGBColor(0xF0, 0xFF, 0xF0), border_color=GREEN, border_width=2)
add_rect(slide, 0.25, 1.35, 6.0, 0.42, GREEN)
add_textbox(slide, 0.35, 1.38, 5.8, 0.34, "MECHANISM OF INDUCTION", 14, bold=True, color=WHITE)
add_textbox_multiline(slide, 0.35, 1.85, 5.7, 4.9, [
    ("How Induction Occurs", True, GREEN, 12),
    ("  • Inducer activates nuclear receptors", False, DARK_TEXT, 10),
    ("    (PXR, CAR, AhR) in hepatocytes", False, DARK_TEXT, 10),
    ("  • Nuclear receptor → ↑ transcription of CYP genes", False, DARK_TEXT, 10),
    ("  • More CYP enzyme synthesised", False, DARK_TEXT, 10),
    ("  • SLOW onset: 1–2 weeks to full effect", False, DARK_TEXT, 10),
    ("  • SLOW offset after inducer stopped", False, DARK_TEXT, 10),
    ("", False, DARK_TEXT, 5),
    ("Clinical Consequence", True, DARK_BLUE, 12),
    ("  • Substrate drug metabolised faster", False, DARK_TEXT, 10),
    ("  • ↓ Plasma levels → THERAPEUTIC FAILURE", False, RED, 11),
    ("  • May also produce more toxic metabolites", False, RED, 10),
    ("", False, DARK_TEXT, 5),
    ("Classic Key Examples:", True, DARK_BLUE, 12),
    ("  • Rifampin + Oral contraceptives:", False, DARK_TEXT, 10),
    ("    → ↓ oestrogen levels → CONTRACEPTIVE FAILURE", False, RED, 10),
    ("  • Rifampin + HIV Protease inhibitors:", False, DARK_TEXT, 10),
    ("    → ↓ antiretroviral levels → viral resistance", False, RED, 10),
    ("  • St. John's Wort (CYP3A4 inducer):", False, DARK_TEXT, 10),
    ("    → ↓ Cyclosporine → transplant rejection", False, RED, 10),
    ("  • Phenobarbital + Warfarin:", False, DARK_TEXT, 10),
    ("    → ↓ anticoagulation → thrombosis risk", False, RED, 10),
], font_size=10, line_spacing=2)

# Right flow
add_rect(slide, 6.6, 1.35, 6.4, 5.5, RGBColor(0xF0, 0xF8, 0xFF), border_color=MID_BLUE, border_width=2)
add_rect(slide, 6.6, 1.35, 6.4, 0.42, MID_BLUE)
add_textbox(slide, 6.7, 1.38, 6.2, 0.34, "INDUCTION: TIME COURSE & KEY INDUCERS", 12, bold=True, color=WHITE)

steps_ind = [
    ("Inducer drug administered", MID_BLUE, WHITE),
    ("Nuclear receptor activation (PXR/CAR)", GREEN, WHITE),
    ("↑ CYP gene transcription (1–2 weeks)", GREEN, WHITE),
    ("↑ CYP enzyme quantity", GREEN, WHITE),
    ("↑ Metabolism → ↓ plasma substrate level", ORANGE, WHITE),
    ("Therapeutic failure / altered metabolite profile", RED, WHITE),
]
sy = 1.95
for i, (txt, bg, fg) in enumerate(steps_ind):
    add_rect(slide, 7.0, sy, 5.6, 0.5, bg)
    add_textbox(slide, 7.05, sy+0.06, 5.5, 0.36, txt, 10.5, bold=True, color=fg, align=PP_ALIGN.CENTER)
    if i < len(steps_ind)-1:
        add_textbox(slide, 9.2, sy+0.52, 1.2, 0.2, "▼", 13, bold=True, color=DARK_BLUE, align=PP_ALIGN.CENTER)
    sy += 0.70

add_rect(slide, 7.0, sy+0.1, 5.6, 0.65, LIGHT_GREEN_BG, border_color=GREEN, border_width=1.5)
add_textbox_multiline(slide, 7.1, sy+0.16, 5.4, 0.55, [
    ("Major CYP Inducers (mnemonic 'PPCRSSD'):", True, GREEN, 9.5),
    ("Phenobarbital, Phenytoin, Carbamazepine, Rifampin,", False, DARK_TEXT, 9),
    ("St. John's Wort, Smoking (CYP1A2), Dexamethasone", False, DARK_TEXT, 9),
], font_size=9)

# ═══════════════════════════════════════════════════════════════
# SLIDE 7 – INHIBITION OF BILIARY EXCRETION
# ═══════════════════════════════════════════════════════════════
slide = prs.slides.add_slide(blank)
add_rect(slide, 0, 0, 13.333, 7.5, RGBColor(0xF5, 0xF8, 0xFF))
header_bar(slide, "Inhibition of Biliary Excretion", "Hepatocyte transporter-mediated drug secretion into bile")
footer_bar(slide)

# Normal pathway box
add_rect(slide, 0.25, 1.35, 4.1, 5.55, LIGHT_BG, border_color=MID_BLUE, border_width=2)
add_rect(slide, 0.25, 1.35, 4.1, 0.42, MID_BLUE)
add_textbox(slide, 0.35, 1.38, 3.9, 0.34, "NORMAL BILIARY EXCRETION", 12, bold=True, color=WHITE)
add_textbox_multiline(slide, 0.35, 1.85, 3.85, 5.0, [
    ("Key Transporters at Hepatocyte Canalicular Membrane:", True, DARK_BLUE, 10),
    ("", False, DARK_TEXT, 4),
    ("• P-glycoprotein (P-gp / MDR1)", True, MID_BLUE, 10),
    ("  – ATP-dependent efflux pump", False, DARK_TEXT, 9),
    ("  – Substrates: digoxin, colchicine, vinblastine", False, DARK_TEXT, 9),
    ("", False, DARK_TEXT, 4),
    ("• MRP2 (Multidrug Resistance Protein 2)", True, MID_BLUE, 10),
    ("  – Exports glucuronide/sulfate conjugates", False, DARK_TEXT, 9),
    ("  – Substrates: methotrexate, bilirubin conjugates", False, DARK_TEXT, 9),
    ("", False, DARK_TEXT, 4),
    ("• BSEP (Bile Salt Export Pump)", True, MID_BLUE, 10),
    ("  – Primary bile acid transporter", False, DARK_TEXT, 9),
    ("  – Inhibition → intrahepatic cholestasis", False, DARK_TEXT, 9),
    ("", False, DARK_TEXT, 4),
    ("• OATP (Organic Anion Transporting Polypeptide)", True, MID_BLUE, 10),
    ("  – Uptake transporter (basolateral side)", False, DARK_TEXT, 9),
    ("  – Substrates: statins, rifampin, fexofenadine", False, DARK_TEXT, 9),
    ("", False, DARK_TEXT, 4),
    ("Normal Flow:", True, GREEN, 10),
    ("Blood → Hepatocyte → Bile → Intestine → Faeces", False, DARK_TEXT, 9),
    ("OR enterohepatic recirculation", False, DARK_TEXT, 9),
], font_size=9.5, line_spacing=2)

# Middle: inhibition consequences
add_rect(slide, 4.6, 1.35, 4.1, 5.55, RGBColor(0xFF, 0xF0, 0xE8), border_color=ORANGE, border_width=2)
add_rect(slide, 4.6, 1.35, 4.1, 0.42, ORANGE)
add_textbox(slide, 4.7, 1.38, 3.9, 0.34, "INHIBITION CONSEQUENCES", 12, bold=True, color=WHITE)
add_textbox_multiline(slide, 4.7, 1.85, 3.85, 5.0, [
    ("When transporter is inhibited:", True, RGBColor(0x8B, 0x3A, 0x00), 11),
    ("", False, DARK_TEXT, 4),
    ("1. Drug accumulates in hepatocyte", False, DARK_TEXT, 10),
    ("2. ↑ Plasma drug concentration", False, DARK_TEXT, 10),
    ("3. ↑ Risk of hepatotoxicity", False, RED, 10),
    ("4. Drug cannot be excreted in bile →", False, DARK_TEXT, 10),
    ("   enterohepatic cycling disrupted", False, DARK_TEXT, 10),
    ("", False, DARK_TEXT, 5),
    ("BSEP Inhibition:", True, RED, 11),
    ("  • Troglitazone, bosentan, cyclosporine", False, DARK_TEXT, 10),
    ("  • → Bile acid accumulation in hepatocyte", False, RED, 10),
    ("  • → Drug-induced cholestasis / DILI", False, RED, 10),
    ("", False, DARK_TEXT, 5),
    ("OATP1B1 Inhibition:", True, RED, 11),
    ("  • Cyclosporine inhibits OATP1B1", False, DARK_TEXT, 10),
    ("  • → ↑ statin plasma levels", False, RED, 10),
    ("  • → Myopathy / rhabdomyolysis", False, RED, 10),
    ("", False, DARK_TEXT, 5),
    ("P-gp Inhibition:", True, RED, 11),
    ("  • Quinidine + Digoxin:", False, DARK_TEXT, 10),
    ("  • → ↑ digoxin levels → toxicity", False, RED, 10),
    ("  • → Bradycardia, nausea, visual changes", False, RED, 10),
], font_size=9.5, line_spacing=2)

# Right: clinical examples
add_rect(slide, 9.0, 1.35, 4.1, 5.55, RGBColor(0xF0, 0xFF, 0xF0), border_color=GREEN, border_width=2)
add_rect(slide, 9.0, 1.35, 4.1, 0.42, GREEN)
add_textbox(slide, 9.1, 1.38, 3.9, 0.34, "CLINICAL DRUG PAIRS", 12, bold=True, color=WHITE)
add_textbox_multiline(slide, 9.1, 1.85, 3.85, 5.0, [
    ("Clinically Significant Examples:", True, GREEN, 11),
    ("", False, DARK_TEXT, 4),
    ("Cyclosporine + Statins", True, DARK_BLUE, 10),
    ("  OATP1B1/3 inhibition", False, DARK_TEXT, 9),
    ("  → ↑ statin AUC 5–20x", False, RED, 9),
    ("  → Myopathy risk", False, RED, 9),
    ("", False, DARK_TEXT, 4),
    ("Quinidine + Digoxin", True, DARK_BLUE, 10),
    ("  P-gp inhibition (renal + biliary)", False, DARK_TEXT, 9),
    ("  → Digoxin levels double", False, RED, 9),
    ("  → Digoxin toxicity signs", False, RED, 9),
    ("", False, DARK_TEXT, 4),
    ("Probenecid + Rifampin", True, DARK_BLUE, 10),
    ("  MRP2 inhibition", False, DARK_TEXT, 9),
    ("  → ↑ rifampin levels", False, RED, 9),
    ("", False, DARK_TEXT, 4),
    ("Troglitazone / Bosentan", True, DARK_BLUE, 10),
    ("  BSEP inhibitors", False, DARK_TEXT, 9),
    ("  → Drug-induced cholestasis", False, RED, 9),
    ("  → Liver failure risk", False, RED, 9),
    ("", False, DARK_TEXT, 4),
    ("Enterohepatic Recirculation:", True, DARK_BLUE, 10),
    ("  Bile acid → intestine → reabsorbed", False, DARK_TEXT, 9),
    ("  Antibiotics disrupt gut flora →", False, DARK_TEXT, 9),
    ("  ↓ deconjugation → ↓ oral contraceptive efficacy", False, RED, 9),
], font_size=9.5, line_spacing=2)

# ═══════════════════════════════════════════════════════════════
# SLIDE 8 – CLINICAL PHARMACOKINETICS
# ═══════════════════════════════════════════════════════════════
slide = prs.slides.add_slide(blank)
add_rect(slide, 0, 0, 13.333, 7.5, RGBColor(0xF5, 0xF8, 0xFF))
header_bar(slide, "Clinical Pharmacokinetics — Key Parameters", "Applying PK principles to individualise drug therapy")
footer_bar(slide)

params = [
    ("Bioavailability (F)", "Fraction of administered dose reaching systemic circulation.\nF = AUC_oral / AUC_IV\nAffected by: first-pass metabolism, gut wall CYP3A4, P-gp efflux, GI absorption", DARK_BLUE, LIGHT_BG),
    ("Volume of Distribution (Vd)", "Apparent volume drug distributes into.\nVd = Amount of drug in body / Plasma concentration\n• Low Vd (<1 L/kg): plasma-bound, e.g. warfarin\n• High Vd (>5 L/kg): tissue distribution, e.g. chloroquine", MID_BLUE, RGBColor(0xEA, 0xF4, 0xFF)),
    ("Clearance (CL)", "Rate of drug elimination relative to plasma concentration.\nCL = Dose / AUC = 0.693 × Vd / t½\nHepatic: depends on liver blood flow & extraction ratio\nRenal: GFR + tubular secretion - reabsorption", GREEN, RGBColor(0xD4, 0xED, 0xDA)),
    ("Half-Life (t½)", "Time for plasma concentration to halve.\nt½ = 0.693 × Vd / CL\n• 4–5 t½ to reach steady state\n• 4–5 t½ to eliminate drug\nDisease: ↑ Vd or ↓ CL both prolong t½", ORANGE, RGBColor(0xFF, 0xF0, 0xD8)),
    ("Steady-State Concentration (Css)", "Achieved when dosing rate = elimination rate (after 4–5 t½)\nCss = (F × Dose/Interval) / CL\n• Proportional to dose rate\n• Independent of dosing frequency\nUsed in TDM: if Css measured, adjust CL estimate", RED, RGBColor(0xF8, 0xD7, 0xDA)),
    ("First-Pass Effect", "Extensive hepatic metabolism after oral absorption, before systemic circulation.\n• High extraction drugs: morphine, lidocaine, propranolol\n• IV route bypasses first pass\n• CYP3A4 inhibitors ↑ oral bioavailability\n• Liver disease ↑ oral drug levels", RGBColor(0x60, 0x00, 0x80), RGBColor(0xF0, 0xE0, 0xFF)),
]
grid_pos = [(0.25, 1.35), (4.6, 1.35), (9.0, 1.35),
            (0.25, 4.2),  (4.6, 4.2),  (9.0, 4.2)]
for (px, py), (title, body, hdr_c, bg_c) in zip(grid_pos, params):
    bw, bh = 4.0, 2.7
    add_rect(slide, px, py, bw, bh, bg_c, border_color=hdr_c, border_width=1.5)
    add_rect(slide, px, py, bw, 0.38, hdr_c)
    add_textbox(slide, px+0.08, py+0.05, bw-0.15, 0.3, title, 11, bold=True, color=WHITE)
    add_textbox(slide, px+0.1, py+0.44, bw-0.18, bh-0.52, body, 9.5, color=DARK_TEXT)

# ═══════════════════════════════════════════════════════════════
# SLIDE 9 – TDM PART 1: PRINCIPLES
# ═══════════════════════════════════════════════════════════════
slide = prs.slides.add_slide(blank)
add_rect(slide, 0, 0, 13.333, 7.5, RGBColor(0xF5, 0xF8, 0xFF))
header_bar(slide, "Therapeutic Drug Monitoring (TDM) — Principles", "Optimising drug therapy using measured plasma concentrations")
footer_bar(slide)

add_textbox(slide, 0.3, 1.3, 12.5, 0.35,
            "TDM uses measured steady-state plasma drug concentrations to refine the estimated clearance for an individual patient and then adjust the maintenance dose to achieve the desired target concentration.",
            10.5, color=DARK_TEXT)

# Why TDM?
add_rect(slide, 0.25, 1.75, 4.1, 5.1, LIGHT_BG, border_color=MID_BLUE, border_width=2)
add_rect(slide, 0.25, 1.75, 4.1, 0.4, MID_BLUE)
add_textbox(slide, 0.35, 1.78, 3.9, 0.32, "WHY PERFORM TDM?", 12, bold=True, color=WHITE)
add_textbox_multiline(slide, 0.35, 2.22, 3.85, 4.5, [
    ("PK highly variable between patients due to:", True, DARK_BLUE, 10),
    ("  • Genetic polymorphisms (CYP2D6, TPMT)", False, DARK_TEXT, 9.5),
    ("  • Age, weight, organ function", False, DARK_TEXT, 9.5),
    ("  • Drug-drug interactions", False, DARK_TEXT, 9.5),
    ("  • Disease states (renal/hepatic failure)", False, DARK_TEXT, 9.5),
    ("  • Compliance issues", False, DARK_TEXT, 9.5),
    ("", False, DARK_TEXT, 4),
    ("TDM helps to:", True, DARK_BLUE, 10),
    ("  1. Guide dose adjustment after formulation", False, DARK_TEXT, 9.5),
    ("     change", False, DARK_TEXT, 9.5),
    ("  2. Investigate breakthrough therapeutic failure", False, DARK_TEXT, 9.5),
    ("  3. Manage drug interactions (added/removed drug)", False, DARK_TEXT, 9.5),
    ("  4. Monitor during pregnancy", False, DARK_TEXT, 9.5),
    ("  5. Establish individual therapeutic range", False, DARK_TEXT, 9.5),
    ("  6. Assess toxicity correlation with levels", False, DARK_TEXT, 9.5),
    ("  7. Assess patient adherence", False, DARK_TEXT, 9.5),
], font_size=9.5, line_spacing=2)

# When to sample?
add_rect(slide, 4.6, 1.75, 4.1, 5.1, RGBColor(0xFF, 0xF0, 0xD8), border_color=ORANGE, border_width=2)
add_rect(slide, 4.6, 1.75, 4.1, 0.4, ORANGE)
add_textbox(slide, 4.7, 1.78, 3.9, 0.32, "WHEN TO SAMPLE?", 12, bold=True, color=WHITE)
add_textbox_multiline(slide, 4.7, 2.22, 3.85, 4.5, [
    ("TIMING IS CRITICAL:", True, ORANGE, 11),
    ("", False, DARK_TEXT, 4),
    ("Trough Level (most common):", True, DARK_BLUE, 10),
    ("  • Just BEFORE next scheduled dose", False, DARK_TEXT, 9.5),
    ("  • Reflects minimum steady-state level", False, DARK_TEXT, 9.5),
    ("  • Best for adjusting maintenance dose", False, DARK_TEXT, 9.5),
    ("  • Best for detecting accumulation", False, DARK_TEXT, 9.5),
    ("  • Best for assessing toxicity (renal failure)", False, DARK_TEXT, 9.5),
    ("", False, DARK_TEXT, 5),
    ("Peak Level:", True, DARK_BLUE, 10),
    ("  • Shortly after dose / infusion end", False, DARK_TEXT, 9.5),
    ("  • Used for efficacy assessment", False, DARK_TEXT, 9.5),
    ("  • e.g. aminoglycosides (peak ≥8 mg/L)", False, DARK_TEXT, 9.5),
    ("", False, DARK_TEXT, 5),
    ("MUST be at Steady State:", True, RED, 10),
    ("  • After 4–5 elimination half-lives", False, DARK_TEXT, 9.5),
    ("  • Early samples do not reflect CL", False, DARK_TEXT, 9.5),
    ("  • Early samples reflect Vd & absorption", False, DARK_TEXT, 9.5),
    ("", False, DARK_TEXT, 5),
    ("Early sampling: if Css >90% expected →", True, RED, 10),
    ("halve dose immediately", False, RED, 9.5),
], font_size=9.5, line_spacing=2)

# Dose adjustment formula
add_rect(slide, 9.0, 1.75, 4.1, 5.1, RGBColor(0xF0, 0xFF, 0xF0), border_color=GREEN, border_width=2)
add_rect(slide, 9.0, 1.75, 4.1, 0.4, GREEN)
add_textbox(slide, 9.1, 1.78, 3.9, 0.32, "DOSE ADJUSTMENT FORMULA", 12, bold=True, color=WHITE)
add_textbox_multiline(slide, 9.1, 2.22, 3.85, 4.5, [
    ("At Steady State (first-order kinetics):", True, GREEN, 10),
    ("", False, DARK_TEXT, 4),
    ("Css ∝ Dose Rate", True, DARK_BLUE, 12),
    ("", False, DARK_TEXT, 4),
    ("New Dose = Old Dose ×", True, DARK_BLUE, 10),
    ("    (Target Css / Measured Css)", True, DARK_BLUE, 10),
    ("", False, DARK_TEXT, 5),
    ("Worked Example:", True, GREEN, 10),
    ("  Patient on Digoxin 0.125 mg/day", False, DARK_TEXT, 9.5),
    ("  Measured trough Css = 0.35 ng/mL", False, DARK_TEXT, 9.5),
    ("  Target Css = 0.70 ng/mL", False, DARK_TEXT, 9.5),
    ("", False, DARK_TEXT, 4),
    ("  New dose = 0.125 × (0.70/0.35)", False, DARK_TEXT, 9.5),
    ("           = 0.125 × 2 = 0.25 mg/day", True, GREEN, 10),
    ("", False, DARK_TEXT, 5),
    ("Refining CL estimate:", True, DARK_BLUE, 10),
    ("  CL/F_patient = Dosing rate / Css_measured", False, DARK_TEXT, 9.5),
    ("  Use new CL to adjust maintenance dose", False, DARK_TEXT, 9.5),
    ("", False, DARK_TEXT, 5),
    ("Determine both peak AND trough for", True, DARK_BLUE, 10),
    ("complete PK modelling", False, DARK_TEXT, 9.5),
], font_size=9.5, line_spacing=2)

# ═══════════════════════════════════════════════════════════════
# SLIDE 10 – TDM PART 2: DRUGS & TARGET RANGES
# ═══════════════════════════════════════════════════════════════
slide = prs.slides.add_slide(blank)
add_rect(slide, 0, 0, 13.333, 7.5, RGBColor(0xF5, 0xF8, 0xFF))
header_bar(slide, "TDM — Drugs Monitored & Target Ranges", "Narrow therapeutic index drugs requiring routine monitoring")
footer_bar(slide)

add_textbox(slide, 0.3, 1.3, 12.5, 0.3,
            "Drugs suitable for TDM share key characteristics: narrow therapeutic index, large inter-patient PK variability, measurable plasma-effect correlation.",
            10.5, color=DARK_TEXT)

# Table
hdr = ["Drug", "Class", "Therapeutic Range", "Toxic Level / Signs", "Sampling Time"]
col_widths = [1.9, 2.1, 2.5, 3.2, 2.8]
col_xs = [0.25]
for w in col_widths[:-1]:
    col_xs.append(col_xs[-1] + w + 0.05)

data = [
    ["Digoxin",      "Cardiac glycoside",   "0.5–2 ng/mL",        "Bradycardia, nausea,\nvisual changes (>2)",     "Trough (≥6 h post-dose)"],
    ["Phenytoin",    "Antiseizure",         "10–20 mcg/mL",       "Nystagmus, ataxia,\nencephalopathy (>20)",      "Trough"],
    ["Carbamazepine","Antiseizure",         "4–12 mcg/mL",        "Diplopia, dizziness,\nbone marrow suppression",  "Trough"],
    ["Lithium",      "Mood stabiliser",     "0.6–1.2 mEq/L",      "Tremor, polyuria,\nrenaltoxicity (>1.5)",        "12 h post last dose"],
    ["Gentamicin",   "Aminoglycoside",      "Peak: ≥8 mcg/mL\nTrough: <2",  "Nephrotoxicity,\nOtotoxicity (trough>2)",  "Peak (30 min post) &\nTrough (pre-dose)"],
    ["Vancomycin",   "Glycopeptide",        "AUC/MIC: 400–600\nTrough: 10–20 mcg/mL", "Nephrotoxicity, Red\nMan syndrome (infusion)",  "Trough (pre-dose)"],
    ["Cyclosporine", "Immunosuppressant",   "100–400 ng/mL\n(transplant type varies)", "Nephrotoxicity,\nhypertension, neurotoxicity", "Trough (C0)\nor 2 h post (C2)"],
    ["Warfarin",     "Anticoagulant",       "INR 2.0–3.0\n(varies by indication)",  "Bleeding (INR>3)\nThrombosis (INR<2)",       "INR (not drug level)"],
    ["Theophylline", "Bronchodilator",      "5–15 mcg/mL",        "Seizures, arrhythmia,\nnausea (>20 mcg/mL)",    "Trough or 1–2 h post"],
    ["Tacrolimus",   "Immunosuppressant",   "5–15 ng/mL\n(phase dependent)",  "Nephrotoxicity,\nneurotoxicity, DM",       "Trough (C0)"],
]

# Header
row_y = 1.68
add_rect(slide, 0.25, row_y, sum(col_widths) + 0.05*(len(col_widths)-1), 0.38, DARK_BLUE)
for ci, (cx, cw, ct) in enumerate(zip(col_xs, col_widths, hdr)):
    add_textbox(slide, cx+0.04, row_y+0.04, cw-0.06, 0.3, ct, 10, bold=True, color=WHITE, align=PP_ALIGN.CENTER)

row_y += 0.38
row_bgs = [LIGHT_BG, WHITE]
for ri, row in enumerate(data):
    rh = 0.46
    add_rect(slide, 0.25, row_y, sum(col_widths) + 0.05*(len(col_widths)-1), rh,
             row_bgs[ri % 2], border_color=RGBColor(0xCC, 0xDD, 0xEE), border_width=0.5)
    for ci, (cx, cw, cell) in enumerate(zip(col_xs, col_widths, row)):
        txt_color = DARK_BLUE if ci == 0 else (RED if ci == 3 else DARK_TEXT)
        bold = ci == 0
        add_textbox(slide, cx+0.04, row_y+0.03, cw-0.06, rh-0.05, cell, 8.8,
                    bold=bold, color=txt_color)
    row_y += rh

# ═══════════════════════════════════════════════════════════════
# SLIDE 11 – TDM: DISEASE IMPACT ON PK
# ═══════════════════════════════════════════════════════════════
slide = prs.slides.add_slide(blank)
add_rect(slide, 0, 0, 13.333, 7.5, RGBColor(0xF5, 0xF8, 0xFF))
header_bar(slide, "Disease States Affecting Pharmacokinetics", "PK is not constant — disease alters Vd and CL, requiring TDM")
footer_bar(slide)

add_textbox(slide, 0.3, 1.3, 12.5, 0.28,
            "t½ = 0.693 × Vd / CL     A change in either Vd or CL will alter t½, Css, and the appropriate dosing regimen.",
            11, bold=True, color=DARK_BLUE)

conditions = [
    ("RENAL FAILURE", RED, RGBColor(0xFF, 0xEC, 0xEC), [
        "↓ Renal drug excretion → accumulation",
        "↑ Plasma levels of renally-cleared drugs",
        "↓ Protein binding (acidic drugs)",
        "Altered Vd due to ↑ total body water",
        "Examples requiring TDM/dose reduction:",
        "  • Gentamicin, Vancomycin, Digoxin",
        "  • Metformin (lactic acidosis risk)",
        "  • Lithium, Low-MW heparins",
        "Action: ↓ dose or ↑ dosing interval",
    ]),
    ("HEPATIC FAILURE", ORANGE, RGBColor(0xFF, 0xF5, 0xE8), [
        "↓ CYP450 enzyme activity → ↓ metabolism",
        "↓ First-pass effect → ↑ oral bioavailability",
        "↓ Plasma protein (albumin) synthesis →",
        "  more free drug → ↑ pharmacological effect",
        "Altered Vd (ascites, oedema)",
        "Cirrhosis: Vd doubles, CL unchanged",
        "  (↑ t½ but similar initial effect)",
        "Examples: Opioids, Benzodiazepines,",
        "  Warfarin — all require dose reduction",
    ]),
    ("CARDIAC FAILURE", MID_BLUE, RGBColor(0xE8, 0xF0, 0xFF), [
        "↓ Cardiac output → ↓ hepatic & renal blood flow",
        "↓ Clearance of high-extraction drugs",
        "↓ Vd due to vasoconstriction",
        "↓ Absorption (↓ gut perfusion)",
        "Examples:",
        "  • Digoxin: ↑ levels (↓ renal CL)",
        "  • Lidocaine: ↑ t½ (↓ hepatic blood flow)",
        "  • Morphine: slower absorption",
        "Action: Start low, titrate with TDM",
    ]),
    ("GENETIC POLYMORPHISM", RGBColor(0x60, 0x00, 0x80), RGBColor(0xF5, 0xE8, 0xFF), [
        "CYP2D6 phenotypes (5–10% Europeans):",
        "  • Poor metabolisers → toxicity on codeine",
        "  • Ultra-rapid → therapeutic failure",
        "CYP2C19 poor metabolisers:",
        "  • Clopidogrel fails (needs activation by CYP)",
        "TPMT polymorphism:",
        "  • Slow metabolisers: Azathioprine toxicity",
        "VKORC1 & CYP2C9:",
        "  • Determines Warfarin sensitivity/dose",
    ]),
]
cx_list = [0.25, 3.55, 6.85, 10.15]
for (px, title, hdr_c, bg_c, items) in zip(cx_list, [c[0] for c in conditions],
                                             [c[1] for c in conditions],
                                             [c[2] for c in conditions],
                                             [c[3] for c in conditions]):
    bw, bh = 2.95, 5.35
    by = 1.68
    add_rect(slide, px, by, bw, bh, bg_c, border_color=hdr_c, border_width=2)
    add_rect(slide, px, by, bw, 0.4, hdr_c)
    add_textbox(slide, px+0.08, by+0.05, bw-0.15, 0.3, title, 10.5, bold=True, color=WHITE)
    lines = [("  • " + i if not i.startswith(" ") else i, False, DARK_TEXT, 9) for i in items]
    add_textbox_multiline(slide, px+0.1, by+0.48, bw-0.18, bh-0.56, lines, font_size=9, line_spacing=2)

# ═══════════════════════════════════════════════════════════════
# SLIDE 12 – SUMMARY / CLINICAL PEARLS
# ═══════════════════════════════════════════════════════════════
slide = prs.slides.add_slide(blank)
add_rect(slide, 0, 0, 13.333, 7.5, DARK_BLUE)
add_rect(slide, 0, 0, 13.333, 0.08, ACCENT)
add_rect(slide, 0, 7.42, 13.333, 0.08, ACCENT)

add_textbox(slide, 0.4, 0.12, 12.0, 0.6, "SUMMARY & CLINICAL PEARLS", 26, bold=True, color=WHITE, align=PP_ALIGN.CENTER)
add_textbox(slide, 0.4, 0.72, 12.0, 0.3, "Pharmacokinetic Drug Interactions & TDM — Key Take-Aways", 13, color=ACCENT, align=PP_ALIGN.CENTER)
add_rect(slide, 0.3, 1.08, 12.7, 0.04, ACCENT)

pearls = [
    (ACCENT, "Pharmacokinetic interactions change ADME → alter plasma drug concentration (not just effect)"),
    (ORANGE, "CYP450 inhibitors (e.g. ketoconazole, ritonavir, erythromycin) ↑ substrate levels → toxicity risk"),
    (GREEN,  "CYP450 inducers (e.g. rifampin, phenobarbital, St. John's Wort) ↓ substrate levels → therapeutic failure"),
    (ACCENT, "Biliary transporter inhibition (P-gp, BSEP, OATP, MRP2) → hepatic drug accumulation ± cholestasis"),
    (ORANGE, "Key biliary interaction: quinidine + digoxin (P-gp); cyclosporine + statins (OATP1B1)"),
    (GREEN,  "CL, Vd, t½, F, and Css are the five clinical PK parameters used for individualised dosing"),
    (ACCENT, "Steady state is reached after 4–5 half-lives; TDM samples should be trough levels AT steady state"),
    (ORANGE, "New dose = Old dose × (Target Css / Measured Css) — applies to first-order kinetics drugs"),
    (GREEN,  "Narrow TI drugs requiring TDM: Digoxin, Phenytoin, Lithium, Vancomycin, Aminoglycosides, Cyclosporine"),
    (ACCENT, "Disease states (renal failure, liver disease, heart failure) and genetic polymorphisms significantly alter PK"),
    (ORANGE, "Always consider drug interactions when adding a new drug to a patient on warfarin, digoxin, or immunosuppressants"),
]

py = 1.2
for i, (dot_color, pearl_text) in enumerate(pearls):
    add_rect(slide, 0.3, py, 0.15, 0.34, dot_color)
    add_textbox(slide, 0.55, py+0.02, 12.3, 0.32, pearl_text, 11, color=WHITE)
    py += 0.42

add_textbox(slide, 0.3, 6.9, 12.5, 0.3,
            "Sources: Goodman & Gilman's Pharmacological Basis of Therapeutics | Katzung Basic & Clinical Pharmacology | Goldman-Cecil Medicine | Lippincott Pharmacology",
            8, color=RGBColor(0x88, 0xAA, 0xFF))

# ── SAVE ────────────────────────────────────────────────────────
from io import BytesIO
buf = BytesIO()
prs.save(buf)
with open("/tmp/workspace/pharmacokinetics-ppt/Pharmacokinetics_Drug_Interactions_TDM.pptx", "wb") as f:
    f.write(buf.getvalue())
print("Saved successfully!")
cd /tmp/workspace/pharmacokinetics-ppt && python build_ppt.py 2>&1
python -c " from pptx import Presentation prs = Presentation('/tmp/workspace/pharmacokinetics-ppt/Pharmacokinetics_Drug_Interactions_TDM.pptx') print(f'Total slides: {len(prs.slides)}') for i, slide in enumerate(prs.slides, 1): texts = [s.text_frame.text.strip()[:60] for s in slide.shapes if s.has_text_frame and s.text_frame.text.strip()] print(f'Slide {i}: {texts[0] if texts else \"(empty)\"}') "
Pharmacokinetics Drug Interactions TDM
Presentation · PPTX
What's Inside — 12 Slides
| # | Slide Title | Content |
|---|---|---|
| 1 | Title Slide | Topics overview, sources |
| 2 | Drug Interactions — Overview | PK vs PD interactions side-by-side with mechanisms and examples |
| 3 | Pharmacokinetic Interactions — ADME | 4-column layout covering Absorption, Distribution, Metabolism, Excretion interactions |
| 4 | CYP450 — The Master Switch | Full table of CYP1A2, 2C9, 2C19, 2D6, 3A4 — substrates, inhibitors, inducers |
| 5 | Inhibition of Drug Metabolism | Competitive vs. mechanism-based inhibition, flow diagram, NTI drugs, clinical examples |
| 6 | Induction of Drug Metabolism | Nuclear receptor mechanism, time course, key inducers (PPCRSSD mnemonic), clinical examples |
| 7 | Inhibition of Biliary Excretion | P-gp, BSEP, MRP2, OATP transporters; inhibition consequences; clinical drug pairs (digoxin/quinidine, statins/cyclosporine) |
| 8 | Clinical Pharmacokinetics | 6-box grid: Bioavailability, Vd, CL, t½, Css, First-pass effect |
| 9 | TDM — Principles | Why TDM, when to sample (trough vs peak), steady-state concept, dose-adjustment formula with worked example |
| 10 | TDM — Drugs & Target Ranges | Full table: Digoxin, Phenytoin, Carbamazepine, Lithium, Gentamicin, Vancomycin, Cyclosporine, Warfarin, Theophylline, Tacrolimus |
| 11 | Disease States Affecting PK | Renal failure, Hepatic failure, Cardiac failure, Genetic polymorphisms (CYP2D6, TPMT, VKORC1) |
| 12 | Summary & Clinical Pearls | 11 colour-coded key take-aways |
GIVE MORE SLIDES UPTO 30
Generate slides 1-30 on specific PK topics (absorption interactions, protein binding displacement, renal excretion, drug-drug interaction case studies, special populations)