
ORRIS AI MASTER PROMPT Create an Expert-Level Neurology Presentation Title: Stroke Mimics and Stroke Chameleons: Clinical Recognition, Diagnostic Approach, and Evidence-Based Management Role Act as a Professor of Neurology, Stroke Neurologist, and Medical Education Expert. Design a 30–40 slide, visually appealing, consultant-level PowerPoint suitable for: - DM Neurology residents - DNB/MD Medicine residents - Neurology grand rounds - Academic seminars - Stroke teaching sessions The presentation should be easy to understand yet academically rigorous. --- Primary References (Use only standard resources) Use updated information from: - Harrison's Principles of Internal Medicine (22nd Edition) - Bradley's Neurology in Clinical Practice - Adams & Victor's Principles of Neurology - Merritt's Neurology - UpToDate - AHA/ASA Stroke Guidelines - ESO (European Stroke Organisation) Guidelines - NICE Stroke Guidelines - Stroke Manual - Lancet Neurology reviews - Recent landmark trials wherever applicable Do not use non-authentic sources. --- Presentation Style Design should resemble presentations delivered in major neurology conferences. Use: - Professional blue-white medical theme - Large readable fonts - High-quality anatomical illustrations - Brain MRI/CT images - Diffusion MRI examples - CT Perfusion examples - CTA examples - EEG images where relevant - Flowcharts - Algorithms - Tables - Clinical photographs - Icons - Infographics - Decision trees Avoid slides with excessive text. Every slide should contain: • Key points • Visuals • Summary box • Clinical pearl --- Learning Objectives Include: - Why stroke mimics matter - Why stroke chameleons are dangerous - Frequency - Diagnostic pitfalls - Imaging approach - Emergency management - Thrombolysis considerations - Mechanical thrombectomy implications - Practical bedside approach --- Presentation Structure Section 1 Introduction Definition Stroke Mimics Stroke Chameleons Importance Global burden Why every neurologist must know this topic --- Section 2 Terminology Difference between Stroke TIA Stroke Mimic Stroke Chameleon Stroke Alert Stroke Code Include comparison table. --- Section 3 Epidemiology Incidence Prevalence Common mimics Common chameleons Indian data if available --- Section 4 Stroke Mimics Explain each in detail with: Definition Clinical clues Red flags Investigations MRI findings CT findings Management Include: Seizure with Todd's paralysis Hypoglycemia Hyperglycemia Migraine with aura Hemiplegic migraine Functional neurological disorder Bell's palsy Vestibular neuritis Labyrinthitis Peripheral vertigo Brain tumor Subdural hematoma Multiple sclerosis relapse ADEM Encephalitis Brain abscess Meningitis Syncope Drug intoxication Alcohol intoxication Conversion disorder Hypertensive encephalopathy Posterior reversible encephalopathy syndrome Metabolic encephalopathy Wernicke encephalopathy Peripheral neuropathy Cervical myelopathy Periodic paralysis Myasthenia gravis Botulism Hypokalemic paralysis Sepsis-associated encephalopathy Heat stroke Psychogenic disorders --- Section 5 Stroke Chameleons Explain: Posterior circulation stroke Thalamic stroke Basilar artery occlusion Brainstem stroke Cerebellar stroke Medullary infarction Pontine infarction Lacunar stroke Isolated aphasia Isolated vertigo Isolated diplopia Confusion Delirium Coma Seizure-like presentation Acute dementia presentation Visual syndromes Ataxia Movement disorders Alien hand syndrome Alexia Neglect Transient global amnesia Locked-in syndrome Wake-up stroke Capsular warning syndrome Include diagnostic pearls. --- Section 6 Clinical Vignettes Include at least 12 real-life style cases. Example: Case 1 72-year-old diabetic male Sudden right hemiparesis Blood sugar 32 mg/dL Diagnosis? Learning point Repeat for: Todd's paralysis Migraine Hypoglycemia Functional weakness Basilar stroke Posterior stroke Cerebellar stroke Thalamic stroke Vestibular syndrome Brain tumor MS relapse Bell's palsy Each case should end with: "Would you thrombolyse?" --- Section 7 Bedside Examination FAST BEFAST NIHSS HINTS examination Finger rub Skew deviation Head impulse test Gaze palsy Eye movement examination Pronator drift Hoover sign Give-way weakness Midline splitting Sensory tricks Include diagrams. --- Section 8 Diagnostic Algorithm Create beautiful flowcharts: Patient with acute focal deficit ↓ Stroke code ↓ CT ↓ CTA ↓ MRI DWI ↓ Perfusion ↓ Stroke? ↓ Mimic? ↓ Chameleon? ↓ Management --- Section 9 Imaging High-quality images showing: Normal CT Hyperdense MCA sign Ischemic stroke Hemorrhage Diffusion restriction FLAIR mismatch Perfusion mismatch Posterior stroke Cerebellar infarction Todd paralysis MRI Migraine perfusion Hypoglycemia MRI MS plaques Tumor Subdural hematoma PRES Brain abscess Each image should have arrows and annotations. --- Section 10 Comparison Tables Stroke vs Mimics Stroke vs Migraine Stroke vs Todd paralysis Stroke vs Bell palsy Stroke vs Functional disorder Posterior stroke vs Vestibular neuritis Stroke vs Hypoglycemia Stroke vs Syncope Stroke vs Seizure Stroke vs Brain tumor --- Section 11 Red Flags When NOT to miss stroke Posterior circulation clues Basilar warning signs Red flags for mimics Emergency pearls --- Section 12 Thrombolysis in Mimics Can mimics receive thrombolysis? Evidence Complications Safety Outcome Guidelines --- Section 13 Landmark Studies Summarize: NINDS ECASS WAKE-UP EXTEND DAWN DEFUSE-3 Relevant studies on stroke mimics and thrombolysis safety. Provide: - Study design - Population - Key findings - Clinical impact --- Section 14 Latest Guidelines AHA/ASA ESO Indian Stroke Guidelines UpToDate recommendations --- Section 15 Take Home Messages 15 high-yield consultant pearls. --- Final Slide Thank You Questions --- Additional Requirements Include throughout: ✓ Clinical Pearls ✓ Exam Pearls for DM Neurology ✓ DNB Viva Questions ✓ Frequently Asked Consultant Questions ✓ Mnemonics ✓ Memory tricks ✓ Diagnostic algorithms ✓ Emergency management flowcharts ✓ High-yield summary boxes ✓ References on the final slide in Vancouver style Ensure the presentation is highly visual, clinically relevant, evidence-based, and suitable for a 30–40 minute neurology residency seminar with minimal text per slide and maximum educational impact.
ischemic stroke MRI diffusion weighted imaging DWI restriction
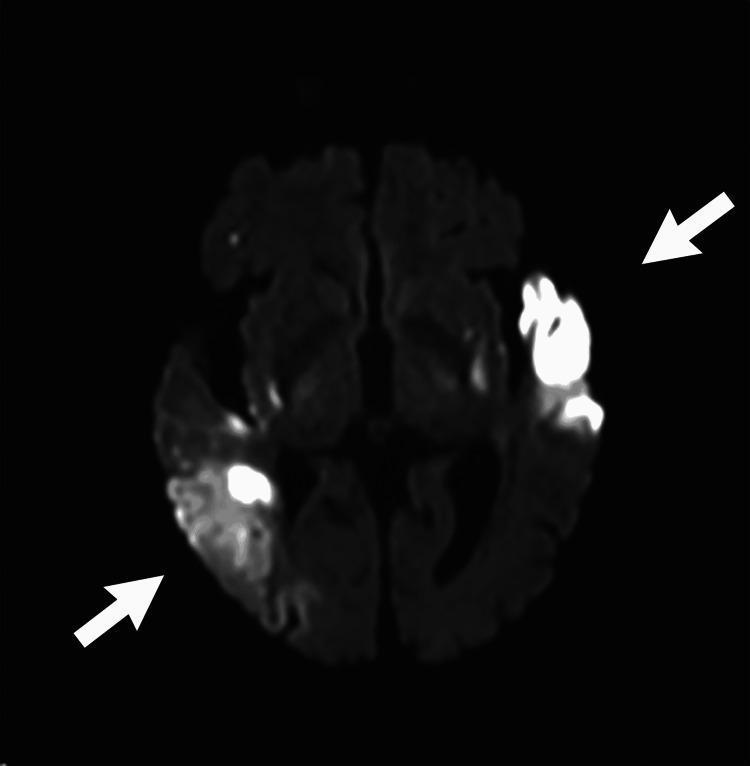
An axial Diffusion-Weighted Imaging (DWI) MRI scan of the brain demonstrating multifocal acute ischemic stroke. The image displays high signal intensity (hyperintensity) representing diffusion restriction in three primary regions, indicated by white arrows. These include the left anterior temporal lobe, the left basal ganglia, and the right posterior temporoparietal cortex. The areas of restriction appear bright white against the dark gray background of the normal cerebral parenchyma, indicating acute cytotoxic edema. The distribution of these infarcts in bilateral middle cerebral artery (MCA) territories suggests a proximal embolic source or simultaneous bilateral arterial occlusions. This imaging modality is essential for identifying early ischemic changes not visible on standard CT, facilitating the assessment of the core infarct versus salvageable penumbra in acute stroke management.
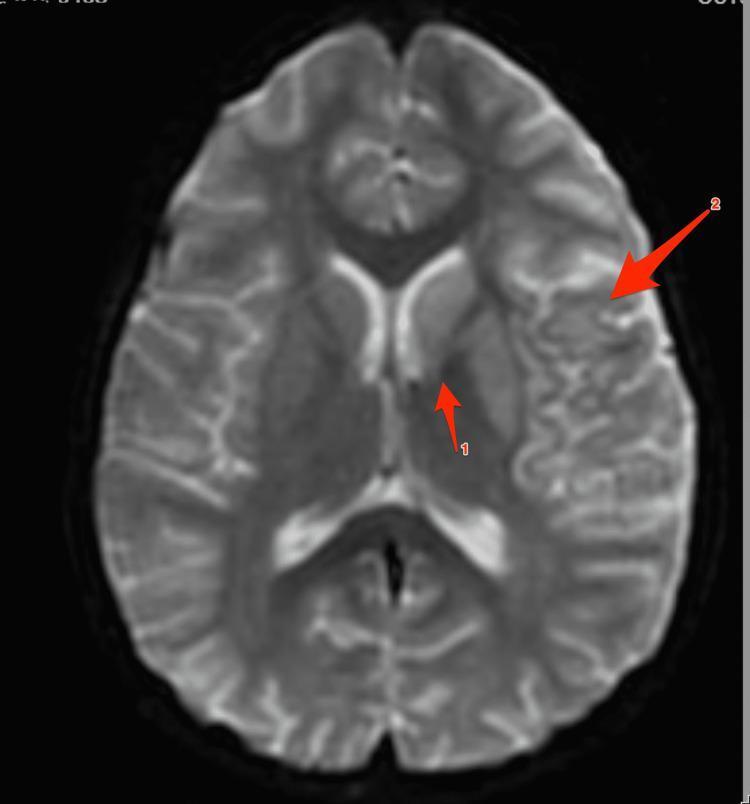
Axial Magnetic Resonance Imaging (MRI) of the brain, specifically a Diffusion-Weighted Imaging (DWI) sequence, demonstrating acute ischemic infarction. Two primary areas of hyperintensity, representing diffusion restriction, are identified with red arrows. Arrow 1 points to a focal area of restricted diffusion in the left caudate nucleus. Arrow 2 highlights a larger, more diffuse area of cortical and subcortical restricted diffusion involving the left parietal and temporal lobes, consistent with an acute infarct within the left middle cerebral artery (MCA) territory. The image exhibits high contrast between the bright, hyperintense pathological regions and the darker, normal brain parenchyma, which reflects normal water diffusion. This diagnostic image is used to educate clinicians on the radiological presentation of acute stroke and the neuroanatomical distribution of ischemic injury in the basal ganglia and cerebral cortex.
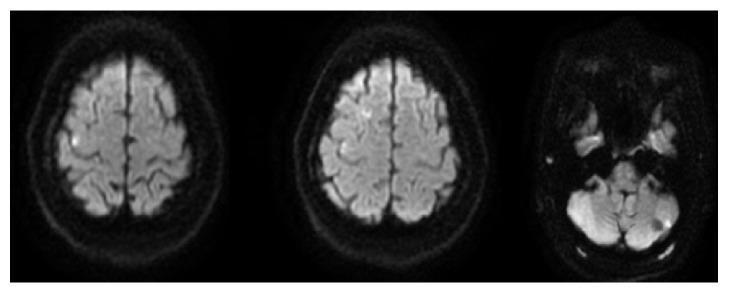
Diagnostic Image: Three axial MRI brain slices, specifically Diffusion-Weighted Imaging (DWI) sequences, demonstrating focal areas of diffusion restriction consistent with acute ischemic infarctions. The first slice (left) shows a superior axial view of the cerebral hemispheres with a small, hyperintense (bright) ovoid focus in the right frontal lobe. The second slice (middle) displays the mid-cerebral level with no significant focal lesions at this cross-section. The third slice (right) is an inferior view through the posterior fossa, highlighting a distinct focal area of increased signal intensity in the left cerebellar hemisphere. The bilateral distribution of these acute infarcts (involving both the anterior circulation and posterior circulation) is clinically significant for a suspected cardioembolic or aortic embolic source. This imaging is characteristic of acute cerebral ischemia and serves as an educational example of how diffusion restriction appears on MRI during the hyperacute to acute phase of stroke.
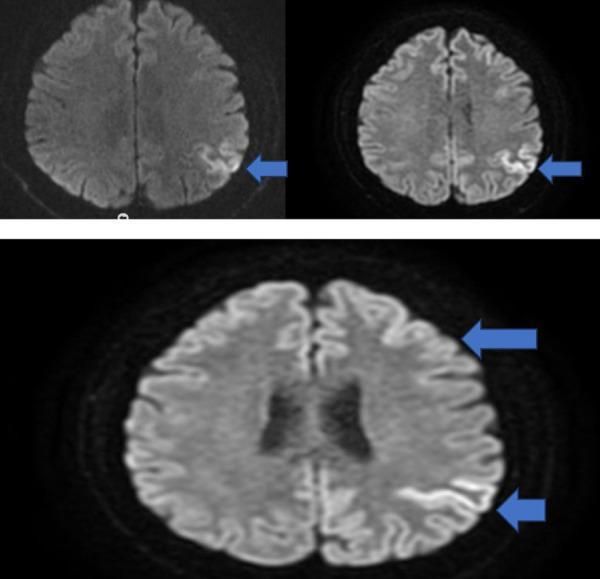
This diagnostic image set consists of axial Diffusion-Weighted Imaging (DWI) brain MRI scans demonstrating focal cortical diffusion restriction. The primary pathology is localized to the left parietal lobe, specifically within the cortical structures in the posterior neighborhood of the central sulcus. The affected areas exhibit a characteristic hyperintense signal (bright appearance) on the DWI sequences, indicated by blue arrows. This pattern, often referred to as 'cortical ribboning,' is highly significant in clinical neurology. While such findings can be associated with acute-subacute ischemic stroke, when present in a patient with rapidly progressive cognitive decline and myoclonus, it is a hallmark diagnostic feature of Creutzfeldt-Jakob Disease (CJD). The image highlights the anatomical distribution of the restricted diffusion, illustrating its confinement to the gray matter of the parietal cortex without initial deeper white matter involvement. It serves as a critical educational example of neuroimaging markers for prion diseases and the differential diagnosis of focal neurological deficits.
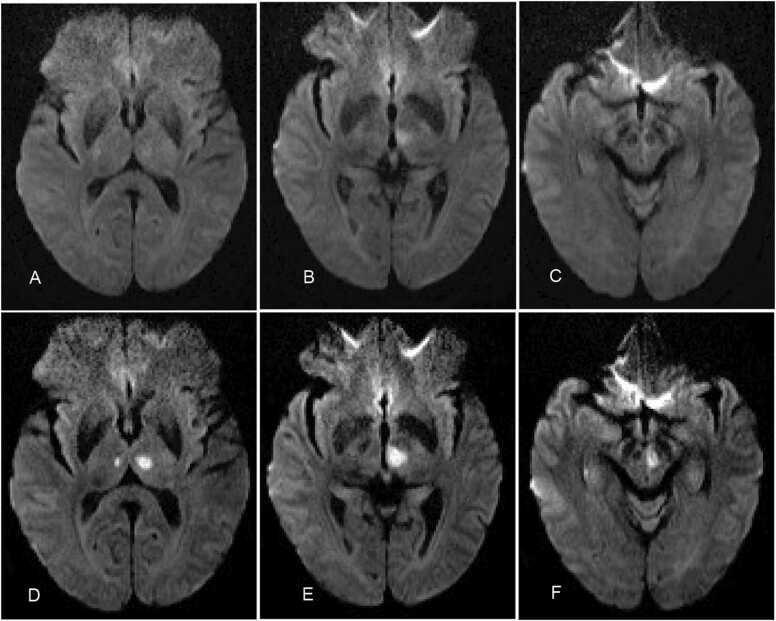
Diagnostic Image: A series of six axial diffusion-weighted MRI (DWI) scans labeled A through F, demonstrating the evolution of an acute ischemic stroke. Panels A-C represent the initial presentation, showing subtle, ill-defined hyperintense lesions in the left paramedian thalamus and the midline midbrain region, suggesting early diffusion restriction. Panels D-F represent follow-up imaging on the third day of illness, revealing more localized, well-defined, and intense hyperintense signals (diffusion-limited) in the left paramedian thalamus and the left side of the midbrain. This specific distribution of bilateral/paramedian thalamic and midbrain involvement is characteristic of an Artery of Percheron (AOP) infarction, a rare anatomical variant where a single arterial trunk supplies both paramedian thalami. The sequence illustrates the radiographic progression of cytotoxic edema and the consolidation of an infarct within a specific vascular territory, suitable for intermediate to advanced medical learners studying neurology and neuroradiology.
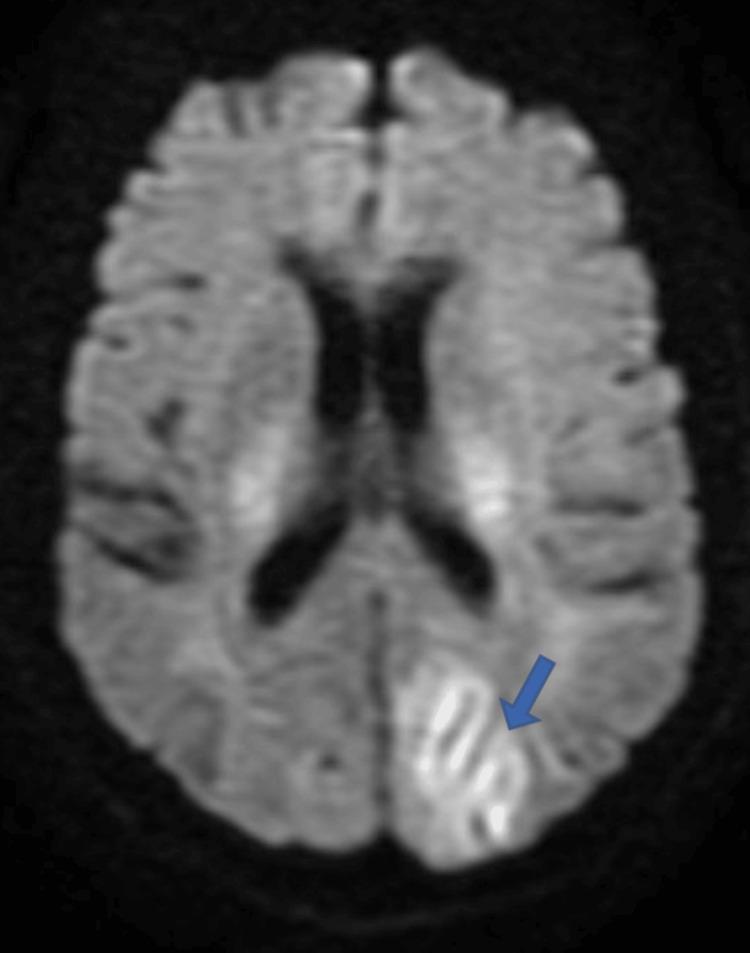
This diagnostic image is an axial section of a Diffusion-Weighted Imaging (DWI) MRI of the brain, a primary modality for detecting acute ischemic changes and cytotoxic edema. The image reveals multiple areas of hyperintensity representing diffusion restriction. A prominent area of high signal intensity is indicated by a blue arrow in the left posterior region, specifically involving the cortical gyri of the parieto-occipital lobe. This 'gyriform' or ribbon-like pattern follows the anatomical contours of the cerebral cortex, suggesting cortical involvement. The findings are clinically significant for pathologies such as Posterior Reversible Encephalopathy Syndrome (PRES) or acute ischemic stroke. The educational focus is on identifying patterns of diffusion restriction and their anatomical distribution in the context of neurological symptoms like cortical blindness. This material is suitable for intermediate to advanced medical students and radiology residents studying neuroradiology and vascular neurology.
HINTS examination head impulse test nystagmus skew deviation posterior stroke vestibular
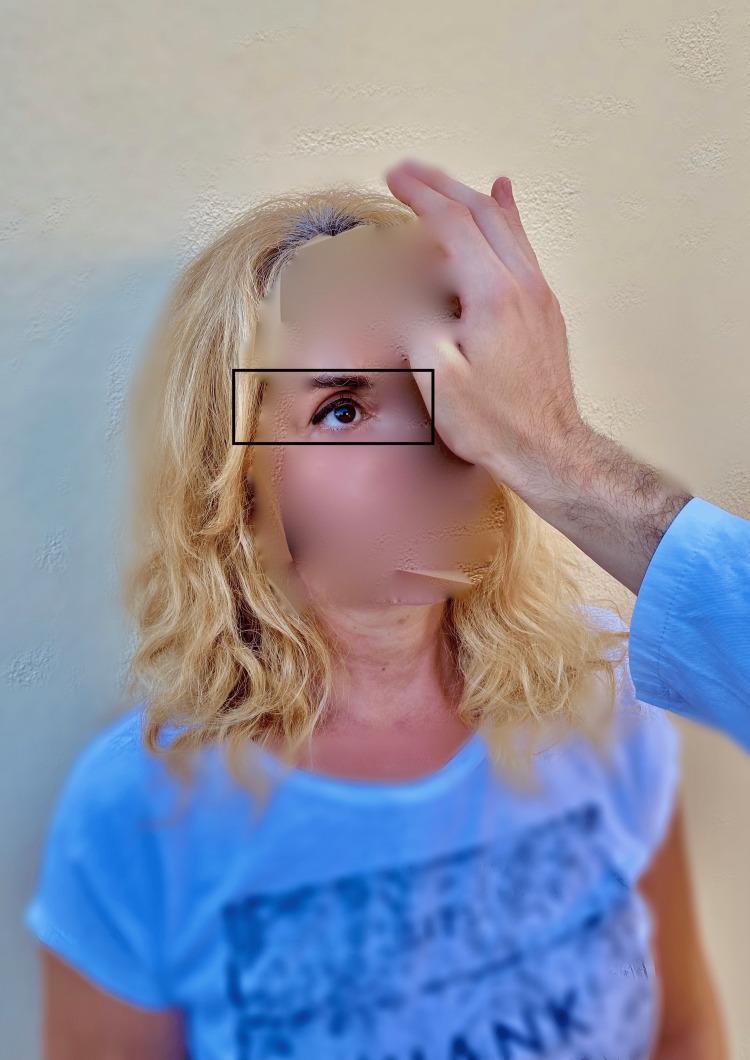
A clinical photograph demonstrating the 'test of skew,' a component of the HINTS (Head Impulse, Nystagmus, Test of Skew) examination used to differentiate central from peripheral causes of acute vestibular syndrome. The image shows an examiner’s hand placed over a patient's left eye while the patient's right eye remains uncovered and is highlighted by a rectangular box to indicate observation. During this maneuver, the examiner performs an alternate cover test while the patient maintains fixation on a central target (typically the examiner’s nose). The clinical focus is to detect skew deviation—a vertical ocular misalignment. In central vestibular disorders, such as a brainstem stroke, uncovering an eye may reveal a corrective vertical shift (refixation saccade). Conversely, the absence of vertical deviation, as seen in this clinical demonstration, is more characteristic of peripheral vestibular conditions like vestibular neuritis. This diagnostic procedure is essential for evaluating patients presenting with continuous vertigo, nystagmus, and nausea.
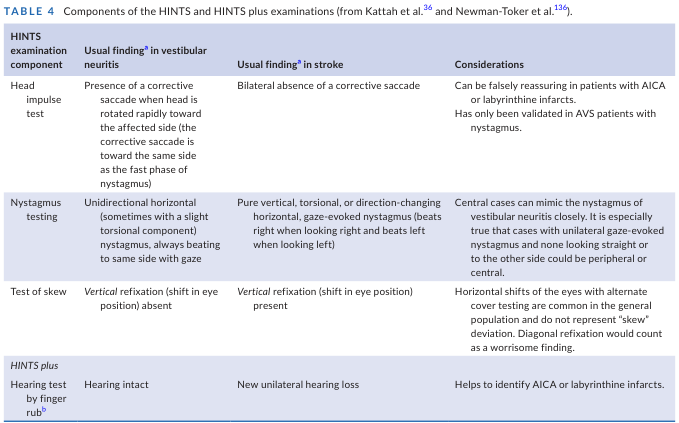
TABLE 4 Components of the HINTS and HINTS plus examinations (from Kattah et al.36 and Newman-Toker et al.136). <table><thead><tr><th>HINTS examination component</th><th>Usual findinga in vestibular neuritis</th><th>Usual findinga in stroke</th><th>Considerations</th></tr></thead><tbody><tr><td>Head impulse test</td><td>Presence of a corrective saccade when head is rotated rapidly toward the affected side (the corrective saccade is toward the same side as the fast phase of nystagmus)</td><td>Bilateral absence of a corrective saccade</td><td>Can be falsely reassuring in patients with AICA or labyrinthine infarcts. Has only been validated in AVS patients with nystagmus.</td></tr><tr><td>Nystagmus testing</td><td>Unidirectional horizontal (sometimes with a slight torsional component) nystagmus, always beating to same side with gaze</td><td>Pure vertical, torsional, or direction-changing horizontal, gaze-evoked nystagmus (beats right when looking right and beats left when looking left)</td><td>Central cases can mimic the nystagmus of vestibular neuritis closely. It is especially true that cases with unilateral gaze-evoked nystagmus and none looking straight or to the other side could be peripheral or central.</td></tr><tr><td>Test of skew</td><td>Vertical refixation (shift in eye position) absent</td><td>Vertical refixation (shift in eye position) present</td><td>Horizontal shifts of the eyes with alternate cover testing are common in the general population and do not represent "skew" deviation. Diagonal refixation would count as a worrisome finding.</td></tr><tr><td colspan="4">HINTS plus</td></tr><tr><td>Hearing test by finger rubb</td><td>Hearing intact</td><td>New unilateral hearing loss</td><td>Helps to identify AICA or labyrinthine infarcts.</td></tr></tbody></table>
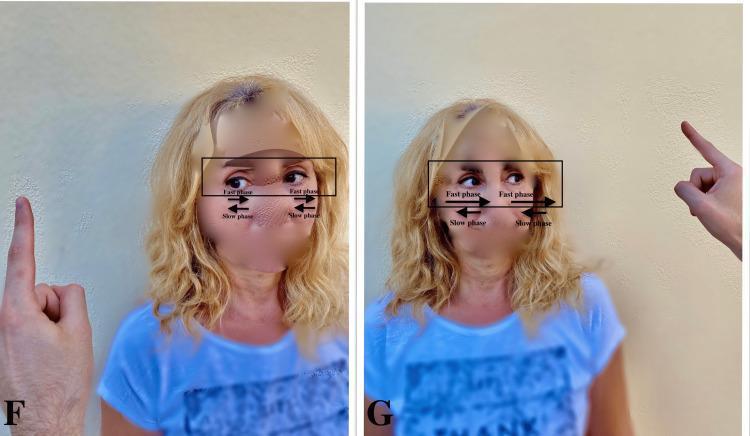
Clinical photograph consisting of two side-by-side images (labeled F and G) demonstrating the assessment of vestibular nystagmus in a patient with acute vestibular loss. In panel F, the examiner's finger is positioned to the patient's left; directional arrows indicate a nystagmus with a slow phase drifting toward the patient's right (the pathologic side) and a fast corrective phase toward the left (the healthy side). In panel G, the examiner's finger moves to the patient's right; annotations illustrate that the nystagmus intensity increases when looking in the direction of the fast phase, consistent with Alexander's Law. This visual educational tool demonstrates the HINTS (Head Impulse, Nystagmus, Test of Skew) examination component used to differentiate peripheral vestibular neuritis from central causes of vertigo, emphasizing that peripheral nystagmus typically has a unidirectional fast phase and follows a specific pattern of slow-phase drift toward the affected ear.
![Evidentiary Table. (continued)
<table><thead><tr><th>Author & Year Published</th><th>Class of Evidence</th><th>Setting & Study Design</th><th>Methods & Outcome Measures</th><th>Results</th><th>Limitations & Comments</th></tr></thead><tbody><tr><td>Kerber et al<sup>82</sup> (2015)</td><td>III for Q4</td><td>Prospective cohort study at 1 center in Michigan; the target population was patients presenting for acute dizziness without an obvious cause who also had examination findings (ie, nystagmus [spontaneous or gaze-evoked] or imbalance when walking) that could be attributable to neurologic dysfunction</td><td>Evaluated the ability of the combination of bedside predictors of stroke—including both the ABCD2 score and the specialized OM examination-to stratify stroke risk using an MRI-based industry standard; study examinations were performed before the MRI whenever possible or blinded to the results of the MRI; OM examination was performed including a nystagmus assessment, assessment of skew deviation, and the head impulse test; primary outcome was an imaging-based definition of stroke, specifically any acute infarction or ICH on MRI as determined by a neuroradiologist</td><td>N=320 patients; stroke rate 11% in multivariable logistic regression models, ABCD2 OR 1.74 (95% CI 1.20 to 2.5); HINTS positive OR 2.82 (95% CI 0.96 to 8.30); false-negative frequency (ie, frequency of stroke in the lowest-risk categories) was as follows: ABCD2 <4, 5.1% (8/157); OM assessment, 5.9% (9/152) (4.9% [4/82], for HINTS peripheral findings); other CNS features, 7.8% (17/219); and prior stroke, 10.8% (28/260); the OM assessment was positive for a central lesion in 20 of the 29 stroke patients (69%); of the 9 stroke patients who did not have the central OM findings, 7 patients were in the no-nystagmus category (5) and/or had an acute infarction that was possibly incidental (3)</td><td>15% did not receive MRI within 14 d; physical examination was performed in a structured fashion by a study investigator, either a neurologist fellowship trained in neuro-otology or vascular neurology, or an emergency medicine physician fellowship trained in vascular neurology—not generalizable to the general EM professional population</td></tr></tbody></table>](https://cdn.orris.care/cdss_images/GLGCA_2776078_1766815823346_1d50c421-3c87-476d-89be-f19f647bce8c_13663d0f-3a66-414e-a571-18d29b8fb1f7.png)
Evidentiary Table. (continued) <table><thead><tr><th>Author & Year Published</th><th>Class of Evidence</th><th>Setting & Study Design</th><th>Methods & Outcome Measures</th><th>Results</th><th>Limitations & Comments</th></tr></thead><tbody><tr><td>Kerber et al<sup>82</sup> (2015)</td><td>III for Q4</td><td>Prospective cohort study at 1 center in Michigan; the target population was patients presenting for acute dizziness without an obvious cause who also had examination findings (ie, nystagmus [spontaneous or gaze-evoked] or imbalance when walking) that could be attributable to neurologic dysfunction</td><td>Evaluated the ability of the combination of bedside predictors of stroke—including both the ABCD2 score and the specialized OM examination-to stratify stroke risk using an MRI-based industry standard; study examinations were performed before the MRI whenever possible or blinded to the results of the MRI; OM examination was performed including a nystagmus assessment, assessment of skew deviation, and the head impulse test; primary outcome was an imaging-based definition of stroke, specifically any acute infarction or ICH on MRI as determined by a neuroradiologist</td><td>N=320 patients; stroke rate 11% in multivariable logistic regression models, ABCD2 OR 1.74 (95% CI 1.20 to 2.5); HINTS positive OR 2.82 (95% CI 0.96 to 8.30); false-negative frequency (ie, frequency of stroke in the lowest-risk categories) was as follows: ABCD2 <4, 5.1% (8/157); OM assessment, 5.9% (9/152) (4.9% [4/82], for HINTS peripheral findings); other CNS features, 7.8% (17/219); and prior stroke, 10.8% (28/260); the OM assessment was positive for a central lesion in 20 of the 29 stroke patients (69%); of the 9 stroke patients who did not have the central OM findings, 7 patients were in the no-nystagmus category (5) and/or had an acute infarction that was possibly incidental (3)</td><td>15% did not receive MRI within 14 d; physical examination was performed in a structured fashion by a study investigator, either a neurologist fellowship trained in neuro-otology or vascular neurology, or an emergency medicine physician fellowship trained in vascular neurology—not generalizable to the general EM professional population</td></tr></tbody></table>
posterior circulation stroke basilar artery occlusion CT MRI
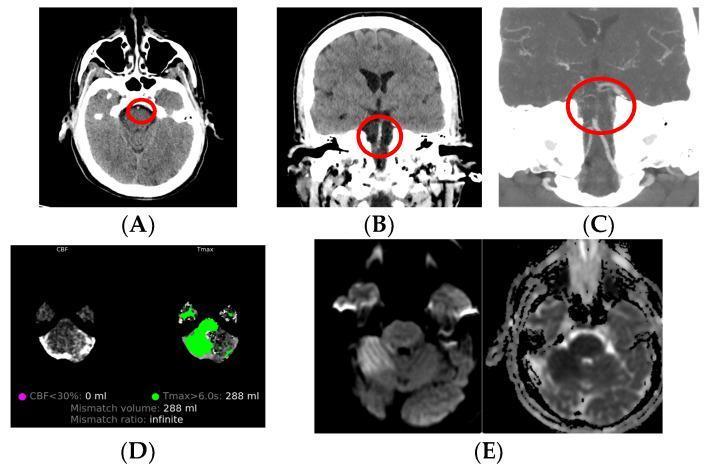
This composite diagnostic image illustrates a multimodal neuroimaging workup for acute ischemic stroke involving the posterior circulation in a 45-year-old male. Panels A (axial) and B (coronal) show non-contrast computed tomography (NCCT) scans demonstrating the 'hyperdense basilar artery sign' (red circles), a radiological marker of acute thrombus. Panel C provides a CT angiography (CTA) reconstruction confirming basilar artery occlusion. Panel D displays CT perfusion (CTP) mapping, showing a significant perfusion-diffusion mismatch: the green area represents tissue with delayed time-to-maximum (Tmax > 6.0s, 288 mL) versus a negligible infarct core (CBF < 30%, 0 mL), indicating a large salvageable penumbra. Panel E concludes with MRI sequences, where Diffusion-Weighted Imaging (DWI) and the Apparent Diffusion Coefficient (ADC) map reveal restricted diffusion in the right cerebellar region, confirming acute infarction. This series emphasizes the clinical utility of combining NCCT, CTA, CTP, and MRI in evaluating large vessel occlusions and determining treatment eligibility for reperfusion therapy.
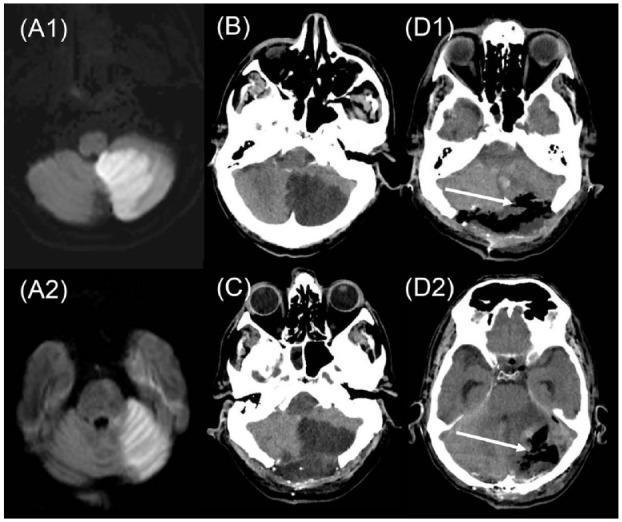
This composite diagnostic image illustrates the radiological progression and surgical management of a multilevel posterior circulation stroke in a 46-year-old patient. Panels A1 and A2 are axial diffusion-weighted MRI (DWI) scans showing hyperintense signals in the left inferior and superior cerebellar hemispheres, diagnostic of acute extensive cerebellar infarction following basilar artery occlusion. Panels B through D2 present a timeline of axial CT scans focusing on the posterior fossa. Image (B) shows early cerebellar edema with mass effect. Image (C) demonstrates the patient status post a 5 cm decompressive posterior craniectomy, though persistent mass effect on the brainstem remains evident. Images (D1) and (D2) show the outcome following a secondary surgery on day 3, featuring an enlarged 7 cm craniectomy and partial resection of infarcted cerebellar tissue (indicated by white arrows). The series demonstrates the evolution of space-occupying cerebellar infarction and the neurosurgical interventions—decompressive craniectomy and strokeectomy—used to mitigate life-threatening mass effect and brainstem compression.
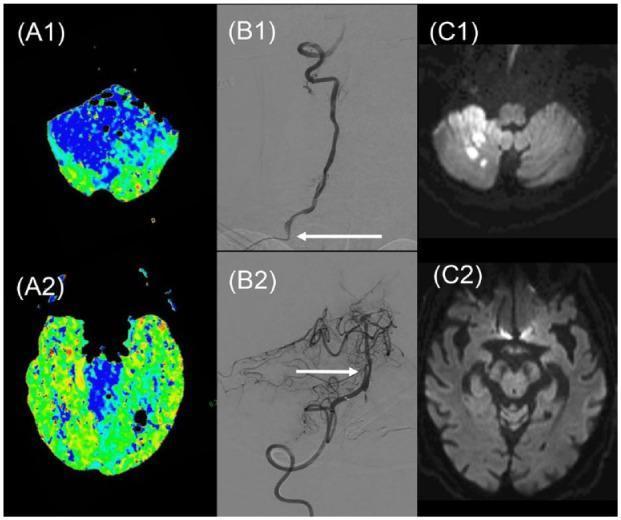
Multi-modal neuroimaging composite illustrating a case of acute basilar artery occlusion (BAO) and subsequent endovascular treatment. (A1, A2) Color-coded CT Perfusion (CTP) maps showing Mean Transit Time (MTT) at the medullary and midbrain levels; the predominant blue areas signify extensive hypoperfusion in the posterior circulation territory. (B1) Conventional digital subtraction angiography (DSA) of the vertebral artery reveals high-grade stenosis at the vertebral origin (arrow) and complete basilar artery occlusion. (B2) Post-thrombectomy DSA demonstrates successful recanalization of the basilar artery, though a non-stenosing mid-basilar dissection is visible (arrow). (C1, C2) Follow-up sub-acute Diffusion-Weighted Imaging (DWI) MRI axial slices showing hyperintense areas in the right cerebellum indicating a limited infarct volume, with relative sparing of the brainstem at the midbrain level. This sequence highlights the clinical correlation between perfusion deficits, arterial occlusion/stenosis, and final infarct core in posterior circulation stroke management.
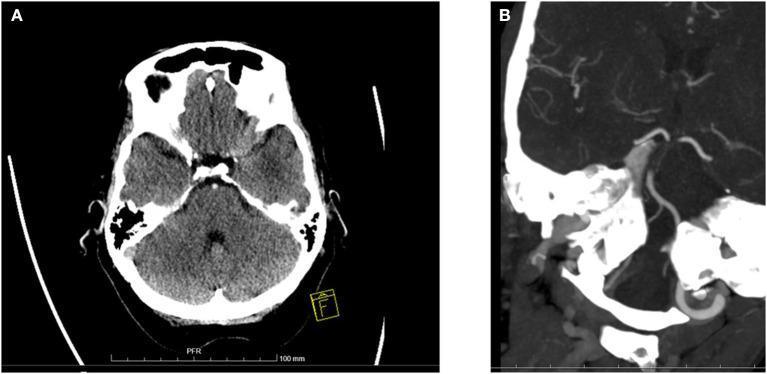
This diagnostic imaging panel demonstrates basilar artery occlusion (BAO) and associated posterior circulation ischemic changes. Figure A is an axial non-contrast CT scan of the brain at the level of the posterior fossa, showing diffuse hypodensity in the pons and both cerebellar hemispheres, indicative of acute infarction or edema. A hyperdense basilar artery sign is also visible, suggesting acute thrombus. Figure B is a CT angiography (CTA) image in a coronal-oblique projection, revealing a long-segment filling defect and abrupt vessel cut-off involving the mid and caudal portions of the basilar artery, confirming a diagnosis of basilar artery occlusion. These images illustrate key neuroradiological findings used in the pc-ASPECTS (posterior circulation Acute Stroke Prognosis Early CT Score) system for evaluating stroke severity and predicting clinical outcomes in patients presenting with comatose states or neurological deficits related to the posterior circulation.
PRES posterior reversible encephalopathy syndrome MRI
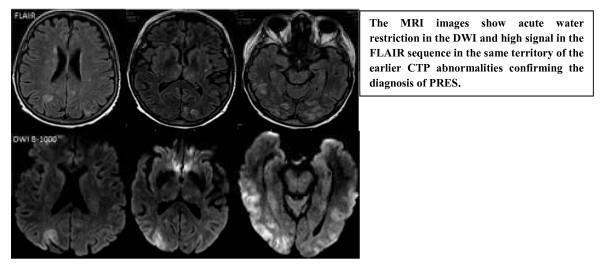
Diagnostic axial MRI brain scans demonstrating Posterior Reversible Encephalopathy Syndrome (PRES). The image set consists of two rows: Fluid-Attenuated Inversion Recovery (FLAIR) sequences on top and Diffusion-Weighted Imaging (DWI B-1000) sequences on the bottom. The FLAIR images show characteristic high signal intensity (hyperintensities) primarily located in the bilateral parietal and occipital lobes, indicating vasogenic edema. The corresponding DWI images demonstrate areas of altered signal in the same anatomical distribution, suggesting acute water restriction or cytotoxic edema within the posterior cerebral territories. The findings illustrate the classic neuroimaging features of PRES, often associated with malignant hypertension or cytotoxic medications. The distribution follows a predominantly posterior pattern, which is a hallmark for distinguishing this condition from typical arterial territory infarcts. These sequences are essential for evaluating the extent of cerebral involvement and distinguishing between reversible vasogenic edema and irreversible ischemic injury.
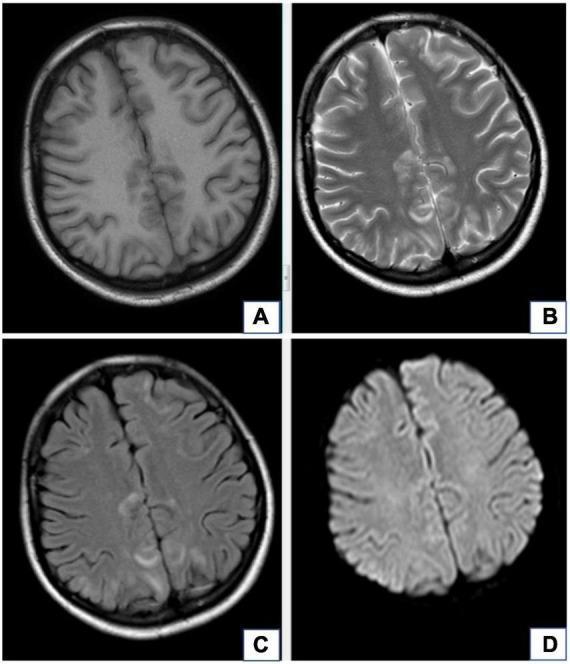
This diagnostic imaging set consists of four axial MRI brain scans (Panels A-D) demonstrating Posterior Reversible Encephalopathy Syndrome (PRES), also known as Reversible Posterior Leukoencephalopathy Syndrome (RPLS), in a 20-year-old female with preeclampsia. Panel A shows a T1-weighted image (T1WI) where bilateral parieto-occipital lesions appear isointense to hypointense. Panel B (T2-weighted) and Panel C (T2-FLAIR) reveal corresponding areas of marked hyperintensity, predominantly involving the subcortical white matter. Panel D (Diffusion-Weighted Imaging, DWI) demonstrates a lack of significant hyperintensity in these same regions, indicating the absence of restricted diffusion. This radiologic pattern—specifically the T2/FLAIR hyperintensity without DWI restriction—is characteristic of vasogenic edema rather than cytotoxic edema. The image serves as a clinical teaching tool for identifying the classic posterior distribution of edema in hypertensive emergencies or preeclampsia, emphasizing the utility of multi-sequence MRI in differentiating reversible vasogenic processes from irreversible infarction.
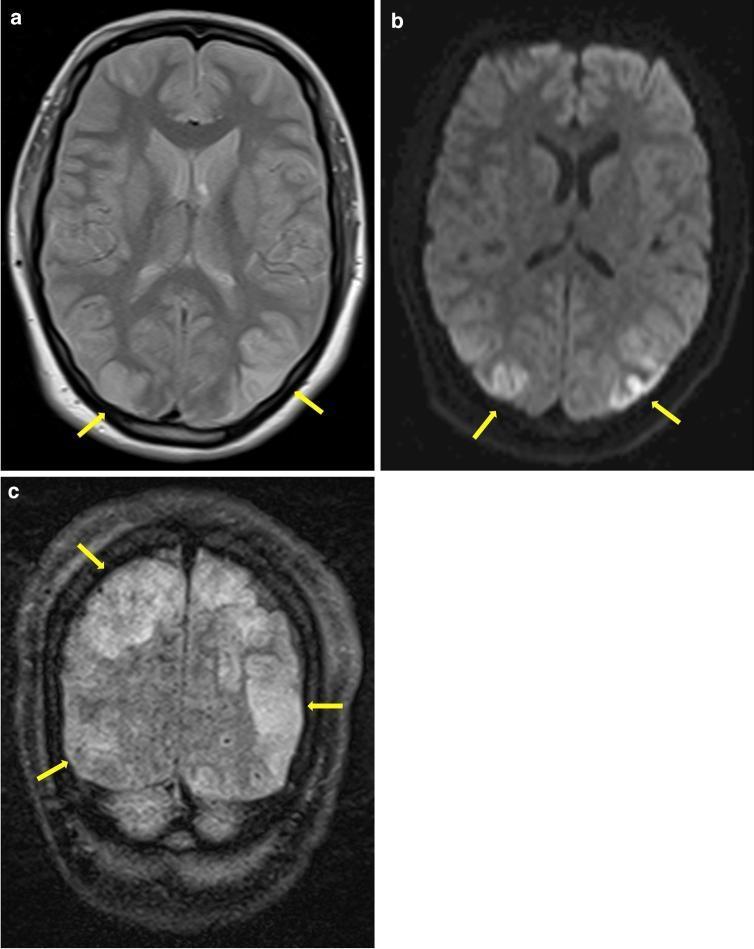
Diagnostic neuroimaging panel consisting of three MRI sequences demonstrating Posterior Reversible Encephalopathy Syndrome (PRES). Image (a) is a transverse Proton-Density-weighted (PDw) MRI showing bilateral, symmetrical hyperintense signal alterations in the posterior regions of the brain. Image (b) is a transverse Diffusion-Weighted Imaging (DWI) sequence, which highlights these same areas as bright hyperintensities, indicated by yellow arrows. Image (c) is a coronal Fluid-Attenuated Inversion Recovery (FLAIR) scan providing a different perspective of the bi-occipital involvement. The hyperintensities are predominantly localized to the occipital lobes, involving both the cortical ribbon and the subcortical white matter. This pattern is characteristic of vasogenic edema rather than cytotoxic infarction, especially when lacking ADC hypointensities. These findings are clinically relevant as common manifestations of PRES, often seen in the context of Reversible Cerebral Vasoconstriction Syndrome (RCVS), pre-eclampsia, or hypertensive emergencies, representing a breakdown of cerebral autoregulation in the posterior circulation territories.
hyperdense MCA sign CT hemorrhagic stroke
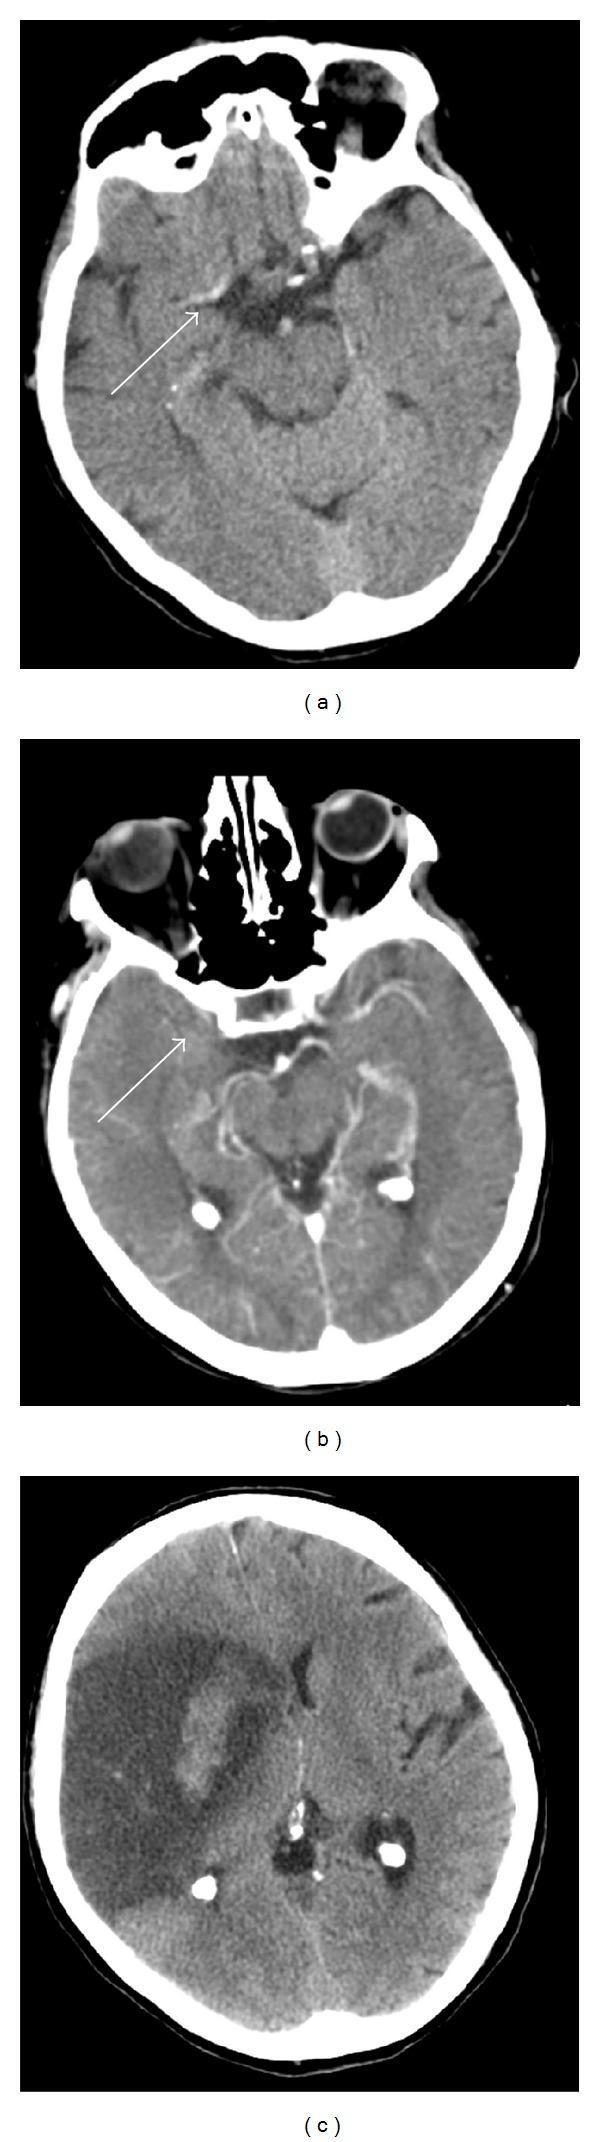
This composite of axial brain imaging illustrates the progression of an acute ischemic stroke to hemorrhagic transformation. (a) Non-contrast axial CT scan demonstrating the 'hyperdense MCA sign' in the right middle cerebral artery (white arrow), an early indicator of acute thromboembolism. There is a subtle loss of grey-white matter differentiation in the right insular cortex and basal ganglia, indicating early cytotoxic edema. (b) CT angiography (CTA) maximum intensity projection (MIP) confirming a proximal occlusion of the right M1 segment of the MCA (white arrow). (c) Follow-up non-contrast CT scan showing a large area of low attenuation (hypodensity) throughout the right MCA territory consistent with established infarction. Within this hypodense region, focal areas of hyperdensity are present, diagnostic of hemorrhagic transformation (HT). This series serves as an educational example of neuroradiological findings in large vessel occlusion and subsequent reperfusion injury or spontaneous bleeding within infarcted cerebral tissue.
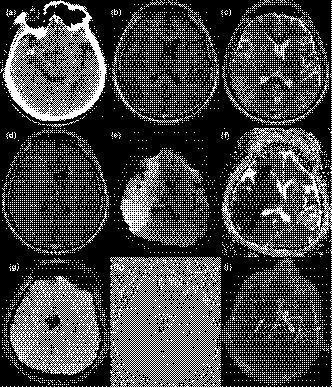
This composite of clinical diagnostic images illustrates an acute ischemic stroke with subsequent hemorrhagic transformation in a 64-year-old male. (a) Non-contrast axial CT scan demonstrates a hyperdense middle cerebral artery (MCA) sign on the right, indicating acute thrombus. (b–d) Sequential MRI sequences including T1-weighted, T2-weighted, and FLAIR imaging at 24 hours post-onset show an evolving infarct in the right cerebral hemisphere characterized by abnormal signal intensity and sulcal effacement. (e, f) Diffusion-weighted imaging (DWI) and corresponding ADC mapping confirm cytotoxic edema with restricted diffusion in the affected territory. (g, h) Susceptibility-weighted imaging (SWI) reveals hypointense signals within the right thalamus, diagnostic of secondary intraparenchymal hemorrhage. (i) Magnetic resonance angiography (MRA) provides a vascular overview, showing complete occlusion of the right internal carotid artery (ICA) and MCA, alongside multi-vessel stenoses in the anterior, posterior, and contralateral middle cerebral arteries. This case highlights the radiological progression from large vessel occlusion to significant cerebral infarction and hemorrhagic transformation.
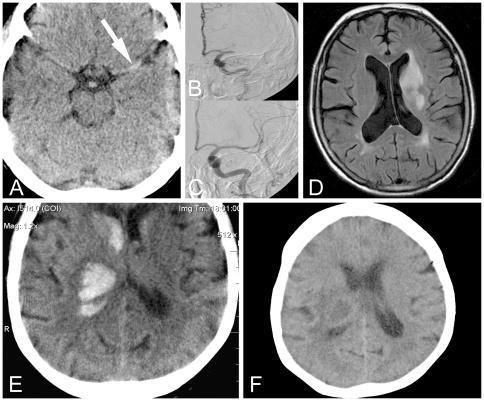
This composite of diagnostic images illustrates the neuroimaging evolution and management of ischemic and hemorrhagic strokes. Panels A-D focus on an ischemic stroke: (A) axial non-contrast CT shows a 'hyperdense middle cerebral artery' sign (arrow), indicating acute thrombus; (B) and (C) digital subtraction angiography (DSA) demonstrate proximal left MCA occlusion followed by successful intra-arterial recanalization; (D) axial diffusion-weighted MRI (DWI) at day 7 reveals a residual infarction in the left basal ganglia and periventricular white matter. Panels E-F demonstrate a hemorrhagic stroke: (E) acute axial CT shows an extensive hyperdense intracerebral hemorrhage (ICH) in the right basal ganglia with intraventricular extension; (F) follow-up CT at day 24 displays the chronic residual lesion with decreased density (hypodensity) representing blood resorption and tissue encephalomalacia. The series highlights the critical role of rapid prehospital and inpatient imaging in differentiating stroke types to guide immediate clinical interventions like thrombolysis, mechanical thrombectomy, and blood pressure management.
mkdir -p /tmp/workspace/stroke-mimics-pptx && ls /tmp/workspace/
Todd's paralysis post-ictal MRI EEG seizure focal deficit
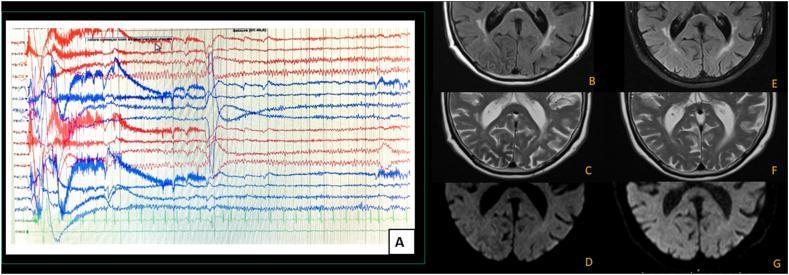
This composite image includes a diagnostic electroencephalogram (EEG) and axial brain MRI sequences demonstrating ictal activity and its corresponding neuroimaging evolution. Panel A shows an ictal EEG with high-amplitude sharp discharges and background slowing localized to the right occipital region, consistent with focal seizure activity. Panels B, C, and D display initial MRI findings in the axial plane: a decreased signal intensity in the right middle occipital cortex is visible on Fluid-Attenuated Inversion Recovery (FLAIR, B) and T2-weighted (C) imaging, while Diffusion-Weighted Imaging (DWI, D) shows hyperintensity, often referred to as a cortical sign. Panels E, F, and G show follow-up MRI sequences in the same order (FLAIR, T2, and DWI), documenting complete resolution of the previously seen signal abnormalities. This visual progression illustrates the correlation between focal occipital seizures and transient, reversible cortical signal changes on MRI, often associated with metabolic disturbances like non-ketotic hyperglycemia.
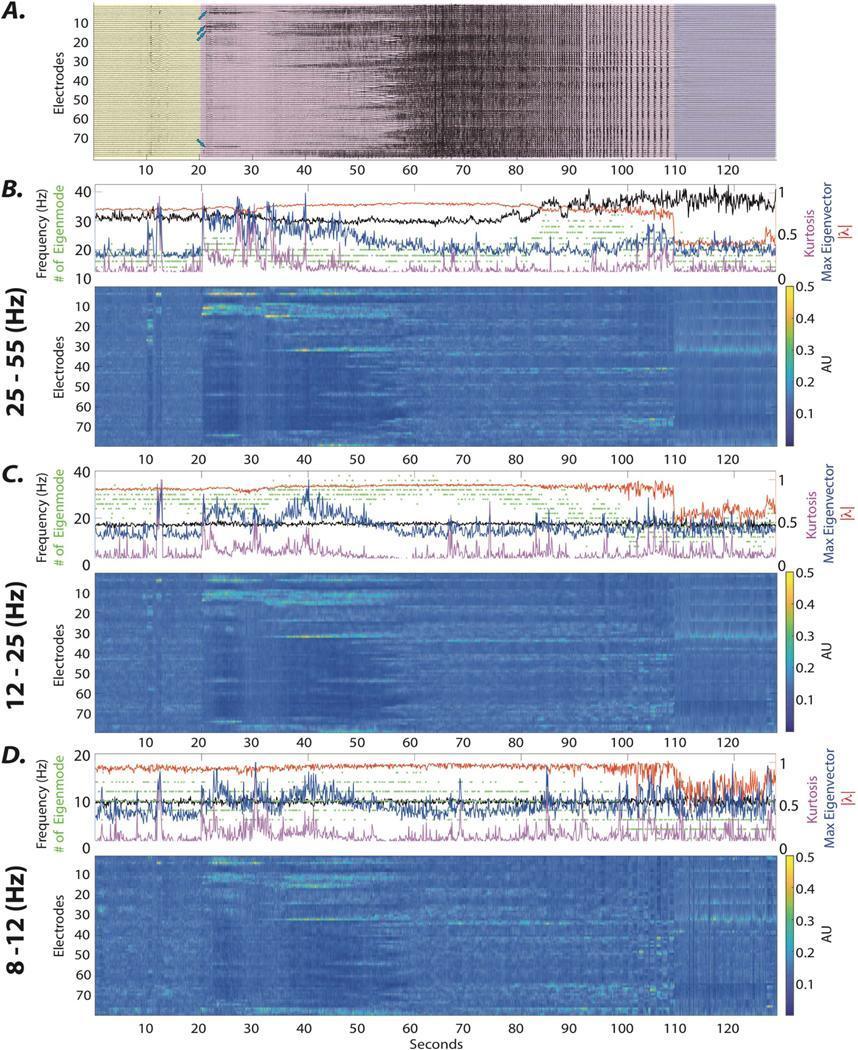
This figure demonstrates the spatiotemporal evolution of intracranial EEG (iEEG) signals and eigenmode dynamics during a focal seizure. Panel A displays raw iEEG signals from 79 electrodes over 130 seconds, categorized into pre-ictal (0–20s, yellow), ictal (20–110s, purple), and post-ictal (110–130s, gray) phases. Panels B, C, and D provide dynamical stability analysis across different frequency bands: gamma (γ, 25–55 Hz), beta (β, 12–25 Hz), and alpha (α, 8–12 Hz). Each section includes a line plot tracking maximum eigenvector values (blue), kurtosis (purple), eigenmode stability (red), and frequency (black). Below these are heatmaps representing the mean absolute value of eigenvectors across electrodes. The transition from pre-ictal to ictal is characterized by a time-locked increase in maximum eigenvector values and kurtosis, signifying the emergence of focal ictal sources. The heatmaps specifically visualize this focal loading on electrodes within the seizure onset zone (SOZ), illustrating how eigenmode decomposition can identify the spatial and spectral properties of evolving epileptic dynamics.
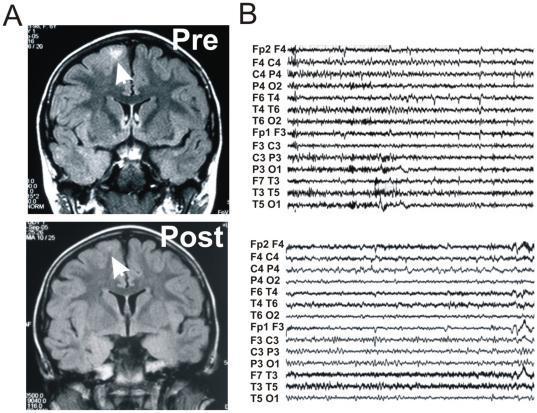
This composite educational graphic illustrates radiologic and electrophysiologic markers of treatment response in a patient with epilepsy. Panel A displays two coronal Fluid-Attenuated Inversion Recovery (FLAIR) MRI scans of the brain. The 'Pre' treatment image shows a focal area of cortical and subcortical hyperintensity in the superior frontal gyrus (indicated by a white arrow), suggesting edema or blood-brain barrier dysfunction. The 'Post' treatment image demonstrates a significant reduction of this hyperintensity following corticosteroid therapy. Panel B presents corresponding EEG traces. The 'Pre' traces show high-amplitude, high-frequency polyspike and wave discharges across multiple channels (e.g., Fp2-F4, F3-C3), characteristic of ictal or interictal epileptiform activity. The 'Post' EEG traces exhibit a marked decrease in the frequency and amplitude of these discharges, returning toward a more organized background rhythm. This comparison highlights the correlation between reduced neuroinflammation (visualized on MRI) and clinical seizure control (visualized on EEG).
cerebellar infarction stroke NIHSS score scale
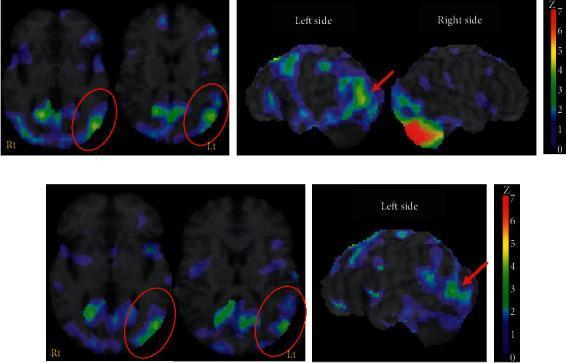
This diagnostic image displays 123I-IMP Single Photon Emission Computed Tomography (SPECT) perfusion scans of the brain, comparing findings from day 98 (top row) to three years after stroke onset (bottom row). The scans utilize Z-score mapping against a normal database to identify areas of significant hypoperfusion, with the color scale ranging from blue (Z=0) to red (Z=7). Significant hypoperfusion (Z > 2.0) is highlighted in green, yellow, and red. Axial slices and lateral surface projections demonstrate a marked area of decreased perfusion in the left posterior middle frontal and temporal gyri, indicated by red circles and arrows. Additionally, the right cerebellar hemisphere shows significant hypoperfusion, consistent with the site of a known infarction. The follow-up scan at three years demonstrates a visual attenuation of these deficits, showing a reduction in both the spatial extent and the intensity (Z-score magnitude) of the hypoperfusion in the left cerebral cortex. This longitudinal comparison illustrates the evolution of crossed cerebellar-cerebral diaschisis and regional perfusion recovery over time.
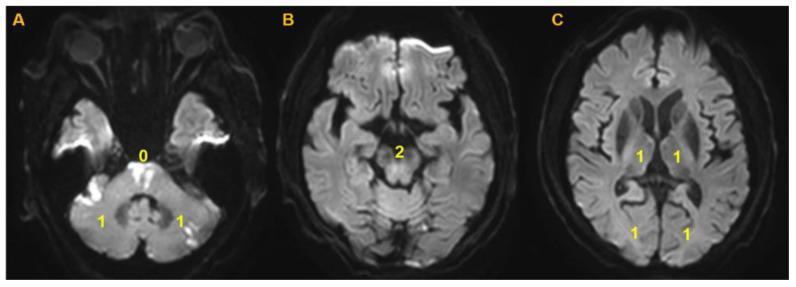
This diagnostic image consists of three axial panels (A, B, C) showing Diffusion-Weighted MRI (DWI) scans of the brain, demonstrating the application of the Posterior Circulation-Alberta Stroke Program Early Computed Tomography Score (PC-ASPECTS) for acute ischemic stroke assessment. Panel (A) at the level of the pons reveals distinct areas of focal hyperintensity (diffusion restriction) within the pons and bilateral cerebellar hemispheres, indicating acute infarction. Yellow numerical annotations indicate scoring: a '0' at the pons denotes significant involvement, while '1's in the cerebellar territories indicate infarctions involving less than 20% of the area. Panel (B) shows the midbrain level with a score of '2', indicating no acute diffusion restriction. Panel (C) displays the thalamic and posterior cerebral artery (PCA) territories, labeled with '1's to indicate no visible acute infarction in these specific regions. The total PC-ASPECTS score for this patient is 8, reflecting the burden of ischemia in the posterior circulation. This image is used to teach radiographic quantification of posterior circulation strokes and the systematic evaluation of brainstem and cerebellar ischemia.
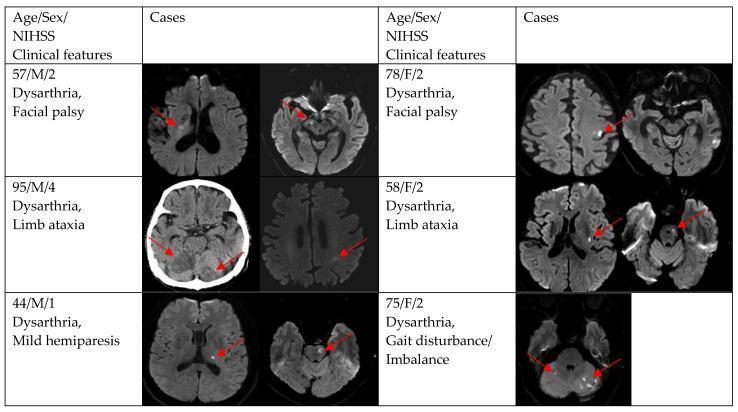
A diagnostic imaging compilation featuring axial Diffusion-Weighted Imaging (DWI) scans and a CT scan from six different patient cases diagnosed with acute ischemic stroke or transient ischemic attack (TIA). Each case includes clinical metadata such as age, sex, National Institutes of Health Stroke Scale (NIHSS) score, and key neurological symptoms (e.g., dysarthria, facial palsy, limb ataxia, hemiparesis). Red arrows highlight acute infarcts, which appear as hyperintense (bright) signals on DWI or hypodense areas on CT. The collection demonstrates a variety of lesion patterns: Case 1 and 4 show cortical/subcortical focal infarcts in the frontal and parietal lobes; Case 2, 3, 5, and 6 exhibit multiple territorial or infratentorial lesions, including bilateral cerebellar involvement and brainstem (pontine) infarcts. The image serves as an educational tool for correlating stroke topography with clinical presentations of prominent dysarthria and multifocal vascular events, highlighting common locations such as the cerebellum and various cortical regions.
"stroke mimics" thrombolysis safety outcome
ORRIS AI MASTER PROMPT Create an Expert-Level Neurology Presentation Title: Stroke Mimics and Stroke Chameleons: Clinical Recognition, Diagnostic Approach, and Evidence-Based Management Role Act as a Professor of Neurology, Stroke Neurologist, and Medical Education Expert. Design a 30–40 slide, visually appealing, consultant-level PowerPoint suitable for: - DM Neurology residents - DNB/MD Medicine residents - Neurology grand rounds - Academic seminars - Stroke teaching sessions The presentation should be easy to understand yet academically rigorous. --- Primary References (Use only standard resources) Use updated information from: - Harrison's Principles of Internal Medicine (22nd Edition) - Bradley's Neurology in Clinical Practice - Adams & Victor's Principles of Neurology - Merritt's Neurology - UpToDate - AHA/ASA Stroke Guidelines - ESO (European Stroke Organisation) Guidelines - NICE Stroke Guidelines - Stroke Manual - Lancet Neurology reviews - Recent landmark trials wherever applicable Do not use non-authentic sources. --- Presentation Style Design should resemble presentations delivered in major neurology conferences. Use: - Professional blue-white medical theme - Large readable fonts - High-quality anatomical illustrations - Brain MRI/CT images - Diffusion MRI examples - CT Perfusion examples - CTA examples - EEG images where relevant - Flowcharts - Algorithms - Tables - Clinical photographs - Icons - Infographics - Decision trees Avoid slides with excessive text. Every slide should contain: • Key points • Visuals • Summary box • Clinical pearl --- Learning Objectives Include: - Why stroke mimics matter - Why stroke chameleons are dangerous - Frequency - Diagnostic pitfalls - Imaging approach - Emergency management - Thrombolysis considerations - Mechanical thrombectomy implications - Practical bedside approach --- Presentation Structure Section 1 Introduction Definition Stroke Mimics Stroke Chameleons Importance Global burden Why every neurologist must know this topic --- Section 2 Terminology Difference between Stroke TIA Stroke Mimic Stroke Chameleon Stroke Alert Stroke Code Include comparison table. --- Section 3 Epidemiology Incidence Prevalence Common mimics Common chameleons Indian data if available --- Section 4 Stroke Mimics Explain each in detail with: Definition Clinical clues Red flags Investigations MRI findings CT findings Management Include: Seizure with Todd's paralysis Hypoglycemia Hyperglycemia Migraine with aura Hemiplegic migraine Functional neurological disorder Bell's palsy Vestibular neuritis Labyrinthitis Peripheral vertigo Brain tumor Subdural hematoma Multiple sclerosis relapse ADEM Encephalitis Brain abscess Meningitis Syncope Drug intoxication Alcohol intoxication Conversion disorder Hypertensive encephalopathy Posterior reversible encephalopathy syndrome Metabolic encephalopathy Wernicke encephalopathy Peripheral neuropathy Cervical myelopathy Periodic paralysis Myasthenia gravis Botulism Hypokalemic paralysis Sepsis-associated encephalopathy Heat stroke Psychogenic disorders --- Section 5 Stroke Chameleons Explain: Posterior circulation stroke Thalamic stroke Basilar artery occlusion Brainstem stroke Cerebellar stroke Medullary infarction Pontine infarction Lacunar stroke Isolated aphasia Isolated vertigo Isolated diplopia Confusion Delirium Coma Seizure-like presentation Acute dementia presentation Visual syndromes Ataxia Movement disorders Alien hand syndrome Alexia Neglect Transient global amnesia Locked-in syndrome Wake-up stroke Capsular warning syndrome Include diagnostic pearls. --- Section 6 Clinical Vignettes Include at least 12 real-life style cases. Example: Case 1 72-year-old diabetic male Sudden right hemiparesis Blood sugar 32 mg/dL Diagnosis? Learning point Repeat for: Todd's paralysis Migraine Hypoglycemia Functional weakness Basilar stroke Posterior stroke Cerebellar stroke Thalamic stroke Vestibular syndrome Brain tumor MS relapse Bell's palsy Each case should end with: "Would you thrombolyse?" --- Section 7 Bedside Examination FAST BEFAST NIHSS HINTS examination Finger rub Skew deviation Head impulse test Gaze palsy Eye movement examination Pronator drift Hoover sign Give-way weakness Midline splitting Sensory tricks Include diagrams. --- Section 8 Diagnostic Algorithm Create beautiful flowcharts: Patient with acute focal deficit ↓ Stroke code ↓ CT ↓ CTA ↓ MRI DWI ↓ Perfusion ↓ Stroke? ↓ Mimic? ↓ Chameleon? ↓ Management --- Section 9 Imaging High-quality images showing: Normal CT Hyperdense MCA sign Ischemic stroke Hemorrhage Diffusion restriction FLAIR mismatch Perfusion mismatch Posterior stroke Cerebellar infarction Todd paralysis MRI Migraine perfusion Hypoglycemia MRI MS plaques Tumor Subdural hematoma PRES Brain abscess Each image should have arrows and annotations. --- Section 10 Comparison Tables Stroke vs Mimics Stroke vs Migraine Stroke vs Todd paralysis Stroke vs Bell palsy Stroke vs Functional disorder Posterior stroke vs Vestibular neuritis Stroke vs Hypoglycemia Stroke vs Syncope Stroke vs Seizure Stroke vs Brain tumor --- Section 11 Red Flags When NOT to miss stroke Posterior circulation clues Basilar warning signs Red flags for mimics Emergency pearls --- Section 12 Thrombolysis in Mimics Can mimics receive thrombolysis? Evidence Complications Safety Outcome Guidelines --- Section 13 Landmark Studies Summarize: NINDS ECASS WAKE-UP EXTEND DAWN DEFUSE-3 Relevant studies on stroke mimics and thrombolysis safety. Provide: - Study design - Population - Key findings - Clinical impact --- Section 14 Latest Guidelines AHA/ASA ESO Indian Stroke Guidelines UpToDate recommendations --- Section 15 Take Home Messages 15 high-yield consultant pearls. --- Final Slide Thank You Questions --- Additional Requirements Include throughout: ✓ Clinical Pearls ✓ Exam Pearls for DM Neurology ✓ DNB Viva Questions ✓ Frequently Asked Consultant Questions ✓ Mnemonics ✓ Memory tricks ✓ Diagnostic algorithms ✓ Emergency management flowcharts ✓ High-yield summary boxes ✓ References on the final slide in Vancouver style Ensure the presentation is highly visual, clinically relevant, evidence-based, and suitable for a 30–40 minute neurology residency seminar with minimal text per slide and maximum educational impact.
ischemic stroke MRI DWI diffusion weighted brain infarct
An axial Diffusion-Weighted Imaging (DWI) MRI scan of the brain demonstrating multifocal acute ischemic stroke. The image displays high signal intensity (hyperintensity) representing diffusion restriction in three primary regions, indicated by white arrows. These include the left anterior temporal lobe, the left basal ganglia, and the right posterior temporoparietal cortex. The areas of restriction appear bright white against the dark gray background of the normal cerebral parenchyma, indicating acute cytotoxic edema. The distribution of these infarcts in bilateral middle cerebral artery (MCA) territories suggests a proximal embolic source or simultaneous bilateral arterial occlusions. This imaging modality is essential for identifying early ischemic changes not visible on standard CT, facilitating the assessment of the core infarct versus salvageable penumbra in acute stroke management.
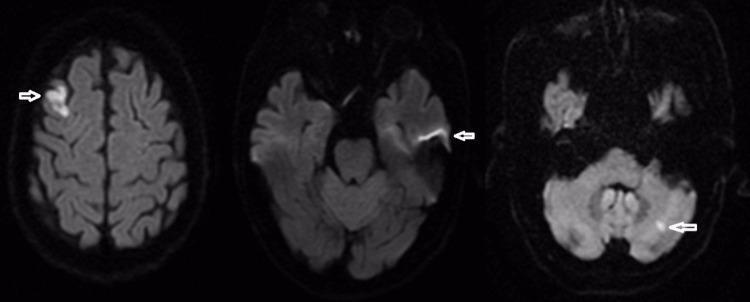
Diagnostic axial brain MRI series utilizing Diffusion-Weighted Imaging (DWI). The sequence demonstrates multiple areas of acute ischemic infarction characterized by focal hyperintense (bright) signal abnormalities. The infarcts are multifocal and involve different vascular territories. Specifically, cortical hyperintensities are visible in the bilateral frontal lobes, with the right-sided lesion appearing more extensive and irregular, following the gyral contours. An additional focal area of restricted diffusion is evident in the left cerebellar hemisphere, marked by a white arrow, representing a posterior circulation infarct. The distribution of these lesions suggests an embolic etiology or multi-territory vascular involvement. This imaging is characteristic of acute cerebral ischemia and is used clinically to localize acute infarcts and assess stroke burden in patients presenting with focal neurological deficits such as dysphagia or motor dysfunction.
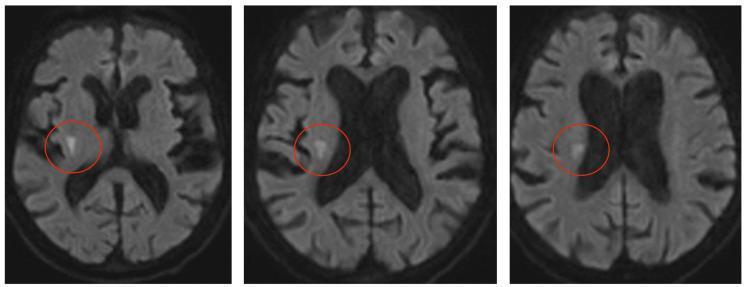
Diagnostic Image: Three axial slices of a Diffusion-Weighted Imaging (DWI) MRI sequence of the brain. The images demonstrate an acute ischemic infarct located in the right hemisphere, highlighted by red circles. The lesion appears as a focal area of hyperintensity, signifying restricted diffusion. Anatomically, the infarct originates in the right basal ganglia and extends superiorly through the subcortical white matter into the corona radiata. The middle and superior slices show the lesion lateral to the lateral ventricles, which appear enlarged, possibly due to age-related atrophy. The hyperintense region has an irregular morphology that is contiguous across the sequential slices. This clinical finding is diagnostic of an acute stroke in the middle cerebral artery territory, demonstrating the typical presentation of restricted diffusion in early ischemia.
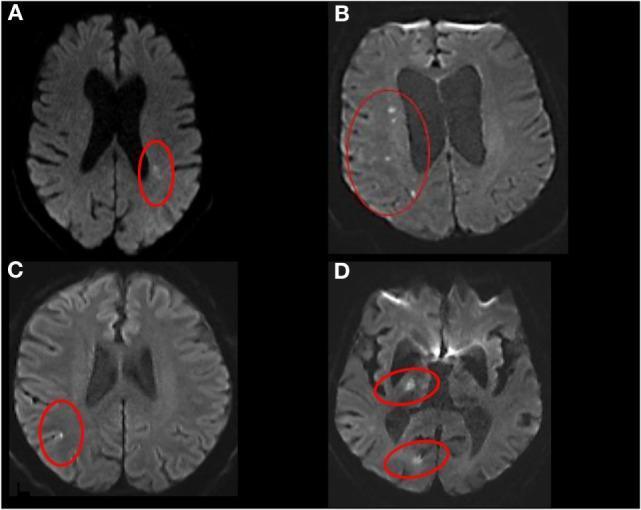
Diagnostic axial brain MRI series utilizing Diffusion-Weighted Imaging (DWI) to illustrate various topographical patterns of acute ischemic stroke. The figure is divided into four panels, with hyperintense lesions (indicative of restricted diffusion) highlighted by red circles. Panel A demonstrates a single subcortical infarct, appearing as a localized hyperintensity in the periventricular white matter. Panel B shows multiple subcortical infarcts, characterized by scattered, small hyperintense foci throughout the deep white matter. Panel C identifies a cortical infarct, where the hyperintensity is confined to the cerebral cortex. Panel D illustrates non-confluent cortical-subcortical infarcts, featuring two distinct, non-adjacent hyperintense lesions—one in a cortical region and another in a deeper subcortical structure. This radiological series serves as an educational tool for neuroradiology and neurology to differentiate stroke mechanisms based on infarct distribution, aiding in the classification of vascular territories and lesion morphology.
HINTS examination head impulse skew deviation posterior stroke vestibular
A clinical photograph demonstrating the 'test of skew,' a component of the HINTS (Head Impulse, Nystagmus, Test of Skew) examination used to differentiate central from peripheral causes of acute vestibular syndrome. The image shows an examiner’s hand placed over a patient's left eye while the patient's right eye remains uncovered and is highlighted by a rectangular box to indicate observation. During this maneuver, the examiner performs an alternate cover test while the patient maintains fixation on a central target (typically the examiner’s nose). The clinical focus is to detect skew deviation—a vertical ocular misalignment. In central vestibular disorders, such as a brainstem stroke, uncovering an eye may reveal a corrective vertical shift (refixation saccade). Conversely, the absence of vertical deviation, as seen in this clinical demonstration, is more characteristic of peripheral vestibular conditions like vestibular neuritis. This diagnostic procedure is essential for evaluating patients presenting with continuous vertigo, nystagmus, and nausea.
TABLE 4 Components of the HINTS and HINTS plus examinations (from Kattah et al.36 and Newman-Toker et al.136). <table><thead><tr><th>HINTS examination component</th><th>Usual findinga in vestibular neuritis</th><th>Usual findinga in stroke</th><th>Considerations</th></tr></thead><tbody><tr><td>Head impulse test</td><td>Presence of a corrective saccade when head is rotated rapidly toward the affected side (the corrective saccade is toward the same side as the fast phase of nystagmus)</td><td>Bilateral absence of a corrective saccade</td><td>Can be falsely reassuring in patients with AICA or labyrinthine infarcts. Has only been validated in AVS patients with nystagmus.</td></tr><tr><td>Nystagmus testing</td><td>Unidirectional horizontal (sometimes with a slight torsional component) nystagmus, always beating to same side with gaze</td><td>Pure vertical, torsional, or direction-changing horizontal, gaze-evoked nystagmus (beats right when looking right and beats left when looking left)</td><td>Central cases can mimic the nystagmus of vestibular neuritis closely. It is especially true that cases with unilateral gaze-evoked nystagmus and none looking straight or to the other side could be peripheral or central.</td></tr><tr><td>Test of skew</td><td>Vertical refixation (shift in eye position) absent</td><td>Vertical refixation (shift in eye position) present</td><td>Horizontal shifts of the eyes with alternate cover testing are common in the general population and do not represent "skew" deviation. Diagonal refixation would count as a worrisome finding.</td></tr><tr><td colspan="4">HINTS plus</td></tr><tr><td>Hearing test by finger rubb</td><td>Hearing intact</td><td>New unilateral hearing loss</td><td>Helps to identify AICA or labyrinthine infarcts.</td></tr></tbody></table>
Evidentiary Table. (continued) <table><thead><tr><th>Author & Year Published</th><th>Class of Evidence</th><th>Setting & Study Design</th><th>Methods & Outcome Measures</th><th>Results</th><th>Limitations & Comments</th></tr></thead><tbody><tr><td>Kerber et al<sup>82</sup> (2015)</td><td>III for Q4</td><td>Prospective cohort study at 1 center in Michigan; the target population was patients presenting for acute dizziness without an obvious cause who also had examination findings (ie, nystagmus [spontaneous or gaze-evoked] or imbalance when walking) that could be attributable to neurologic dysfunction</td><td>Evaluated the ability of the combination of bedside predictors of stroke—including both the ABCD2 score and the specialized OM examination-to stratify stroke risk using an MRI-based industry standard; study examinations were performed before the MRI whenever possible or blinded to the results of the MRI; OM examination was performed including a nystagmus assessment, assessment of skew deviation, and the head impulse test; primary outcome was an imaging-based definition of stroke, specifically any acute infarction or ICH on MRI as determined by a neuroradiologist</td><td>N=320 patients; stroke rate 11% in multivariable logistic regression models, ABCD2 OR 1.74 (95% CI 1.20 to 2.5); HINTS positive OR 2.82 (95% CI 0.96 to 8.30); false-negative frequency (ie, frequency of stroke in the lowest-risk categories) was as follows: ABCD2 <4, 5.1% (8/157); OM assessment, 5.9% (9/152) (4.9% [4/82], for HINTS peripheral findings); other CNS features, 7.8% (17/219); and prior stroke, 10.8% (28/260); the OM assessment was positive for a central lesion in 20 of the 29 stroke patients (69%); of the 9 stroke patients who did not have the central OM findings, 7 patients were in the no-nystagmus category (5) and/or had an acute infarction that was possibly incidental (3)</td><td>15% did not receive MRI within 14 d; physical examination was performed in a structured fashion by a study investigator, either a neurologist fellowship trained in neuro-otology or vascular neurology, or an emergency medicine physician fellowship trained in vascular neurology—not generalizable to the general EM professional population</td></tr></tbody></table>
PRES posterior reversible encephalopathy syndrome MRI FLAIR
Diagnostic axial MRI brain scans demonstrating Posterior Reversible Encephalopathy Syndrome (PRES). The image set consists of two rows: Fluid-Attenuated Inversion Recovery (FLAIR) sequences on top and Diffusion-Weighted Imaging (DWI B-1000) sequences on the bottom. The FLAIR images show characteristic high signal intensity (hyperintensities) primarily located in the bilateral parietal and occipital lobes, indicating vasogenic edema. The corresponding DWI images demonstrate areas of altered signal in the same anatomical distribution, suggesting acute water restriction or cytotoxic edema within the posterior cerebral territories. The findings illustrate the classic neuroimaging features of PRES, often associated with malignant hypertension or cytotoxic medications. The distribution follows a predominantly posterior pattern, which is a hallmark for distinguishing this condition from typical arterial territory infarcts. These sequences are essential for evaluating the extent of cerebral involvement and distinguishing between reversible vasogenic edema and irreversible ischemic injury.
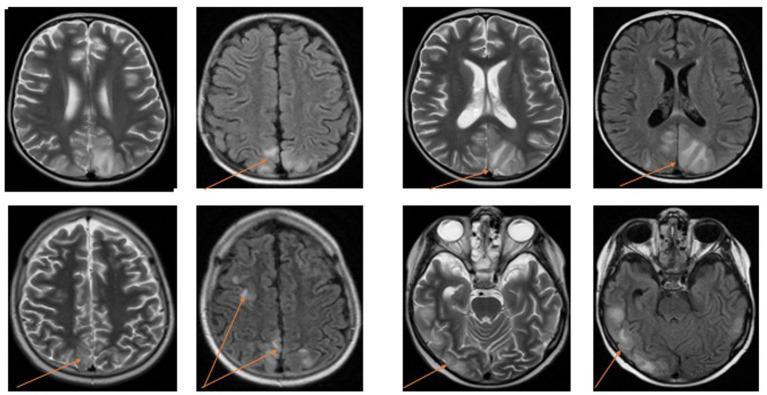
Diagnostic Imaging: This composite shows multiple axial brain MRI slices from two patients, utilizing T2-weighted and Fluid-Attenuated Inversion Recovery (FLAIR) sequences. The images demonstrate the classic presentation of Posterior Reversible Encephalopathy Syndrome (PRES). Key findings include bilateral, often symmetrical, areas of hyperintense signal within the subcortical white matter and overlying cortex. These abnormalities are most prominent in the posterior regions, specifically the occipital and parietal lobes, though frontal lobe and temporal lobe involvement is also visible. Orange arrows highlight focal areas of vasogenic edema, which appear as bright signal intensities on both T2 and FLAIR images. The FLAIR sequences clearly distinguish these pathological signal changes from the dark, suppressed cerebrospinal fluid (CSF) in the ventricles and sulci. The distribution pattern is highly characteristic of the vasogenic edema seen in PRES, often associated with acute hypertension or preeclampsia/eclampsia. This imaging series serves as an educational example of neuroradiological manifestations of cerebral autoregulation failure.
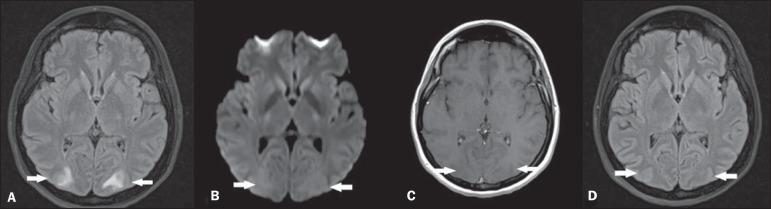
Diagnostic axial brain MRI series illustrating Posterior Reversible Encephalopathy Syndrome (PRES). Panel A (FLAIR) shows hallmark bilateral, symmetric hyperintensities in the white matter of the occipital lobes, indicative of vasogenic edema. Panel B (Diffusion-Weighted Imaging) demonstrates no restricted diffusion in these areas, confirming the absence of cytotoxic edema or acute infarction. Panel C (T1-weighted post-contrast) shows no pathological gadolinium enhancement, highlighting the lack of blood-brain barrier breakdown. Panel D (Follow-up FLAIR at 4 weeks) shows complete radiological resolution of the previous hyperintense lesions. This comparison demonstrates the classic reversible neuroimaging features of vasogenic edema associated with PRES, typically seen in clinical contexts such as hypertensive crisis, preeclampsia, or immunosuppressive therapy.
hyperdense MCA sign CT stroke hemorrhage
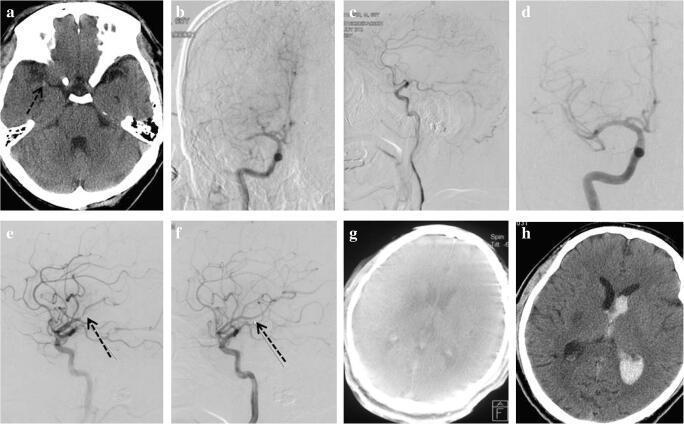
This composite of clinical imaging illustrates a case of acute ischemic stroke and its management. Image (a) is a non-contrast head CT showing a hyperdense right middle cerebral artery (MCA) sign, indicative of an acute thrombus. Images (b) and (c) are frontal and lateral digital subtraction angiograms (DSA) demonstrating a complete occlusion of the M1 segment of the right MCA. Subsequent DSA frames (d-f) capture spontaneous recanalization following intravenous thrombolysis (IVT); (d) shows initial flow restoration, (e) reveals thrombus migration to the MCA bifurcation, and (f) demonstrates complete vessel patency after thrombus resolution. Image (g) is a Dyna-CT used for immediate post-procedure assessment, showing no early hemorrhage. However, image (h) is a follow-up non-contrast CT at 24 hours post-IVT, revealing a secondary hemorrhagic transformation within the right thalamus and ventricular system. This series serves as an educational example of the 'hyperdense MCA sign,' dynamic recanalization during thrombolysis, and the potential complication of intracranial hemorrhage.
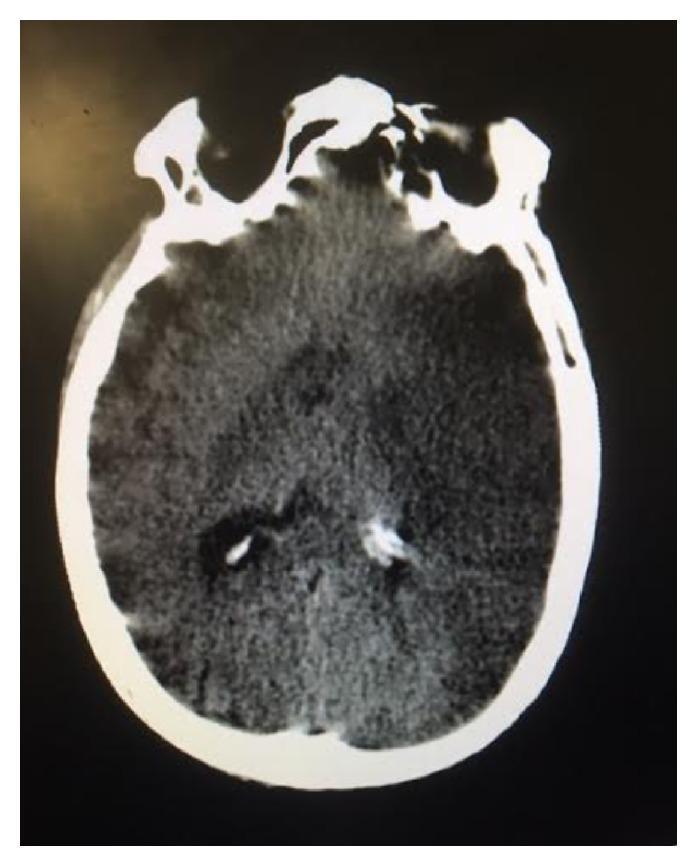
This diagnostic image is an axial non-contrast computed tomography (CT) scan of the brain, demonstrating features consistent with an acute ischemic event. The scan reveals a significant area of altered density within the left middle cerebral artery (MCA) territory. Specifically, there is a prominent focal hyperdensity within the proximal left MCA, often referred to as a 'hyperdense MCA sign,' which suggests acute arterial thromboembolism. Corresponding to this vascular finding, the brain parenchyma in the left hemisphere shows early signs of edema, characterized by subtle effacement of the cortical sulci and minimal compression of the left lateral ventricle's frontal horn. There is no evidence of intracranial hemorrhage or midline shift at this stage. This imaging is characteristic for evaluating hyperacute or acute ischemic stroke in a clinical setting, illustrating the early radiological indicators used for neurovascular assessment and triage for reperfusion therapies.
This composite of diagnostic images illustrates the neuroimaging evolution and management of ischemic and hemorrhagic strokes. Panels A-D focus on an ischemic stroke: (A) axial non-contrast CT shows a 'hyperdense middle cerebral artery' sign (arrow), indicating acute thrombus; (B) and (C) digital subtraction angiography (DSA) demonstrate proximal left MCA occlusion followed by successful intra-arterial recanalization; (D) axial diffusion-weighted MRI (DWI) at day 7 reveals a residual infarction in the left basal ganglia and periventricular white matter. Panels E-F demonstrate a hemorrhagic stroke: (E) acute axial CT shows an extensive hyperdense intracerebral hemorrhage (ICH) in the right basal ganglia with intraventricular extension; (F) follow-up CT at day 24 displays the chronic residual lesion with decreased density (hypodensity) representing blood resorption and tissue encephalomalacia. The series highlights the critical role of rapid prehospital and inpatient imaging in differentiating stroke types to guide immediate clinical interventions like thrombolysis, mechanical thrombectomy, and blood pressure management.
basilar artery occlusion posterior circulation stroke CT angiography
This diagnostic imaging panel demonstrates basilar artery occlusion (BAO) and associated posterior circulation ischemic changes. Figure A is an axial non-contrast CT scan of the brain at the level of the posterior fossa, showing diffuse hypodensity in the pons and both cerebellar hemispheres, indicative of acute infarction or edema. A hyperdense basilar artery sign is also visible, suggesting acute thrombus. Figure B is a CT angiography (CTA) image in a coronal-oblique projection, revealing a long-segment filling defect and abrupt vessel cut-off involving the mid and caudal portions of the basilar artery, confirming a diagnosis of basilar artery occlusion. These images illustrate key neuroradiological findings used in the pc-ASPECTS (posterior circulation Acute Stroke Prognosis Early CT Score) system for evaluating stroke severity and predicting clinical outcomes in patients presenting with comatose states or neurological deficits related to the posterior circulation.
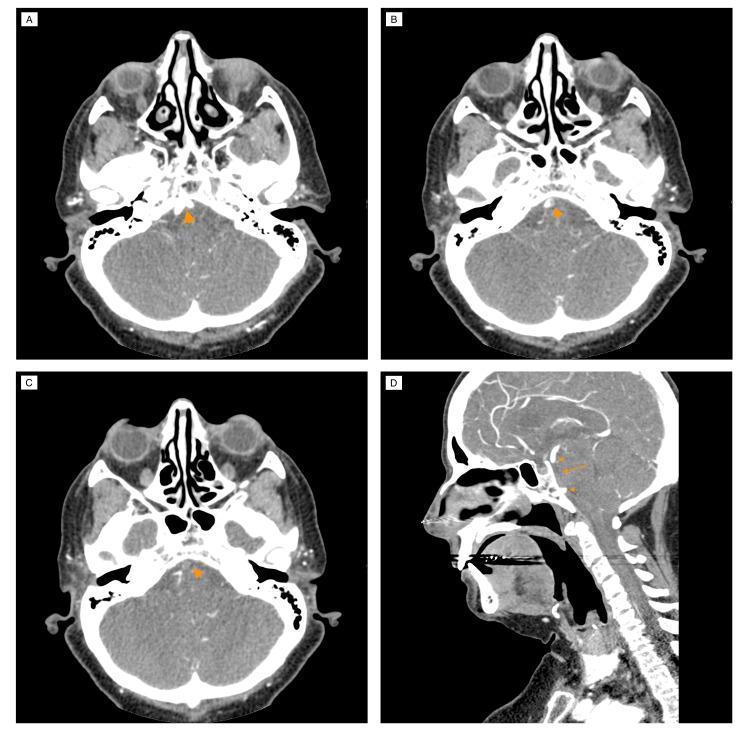
This diagnostic imaging composite displays a computed tomography (CT) cerebral angiography series focused on the posterior circulation, specifically illustrating basilar artery occlusion (BAO). Panel A (axial) shows the confluence of the vertebral arteries into a normally opacified basilar artery (arrowhead). Panels B and C (axial) demonstrate the progression of pathology, with Panel B showing a partial filling defect (arrowhead) due to an endoluminal thrombus, and Panel C showing a total absence of contrast opacification (arrowhead), indicating complete proximal occlusion. Panel D provides a reconstructed sagittal section that delineates the longitudinal extent of the thrombus within the proximal and middle segments of the basilar artery (arrow). A clear contrast cutoff is visible at the artery's origin (lower arrowhead), while the distal segment of the basilar artery shows re-opacification (upper arrowhead). This visual evidence suggests collateral retrograde flow from the anterior circulation via the posterior communicating arteries. The series serves as a clinical education tool for identifying posterior circulation stroke (PCS) and evaluating arterial patency via CT angiography.
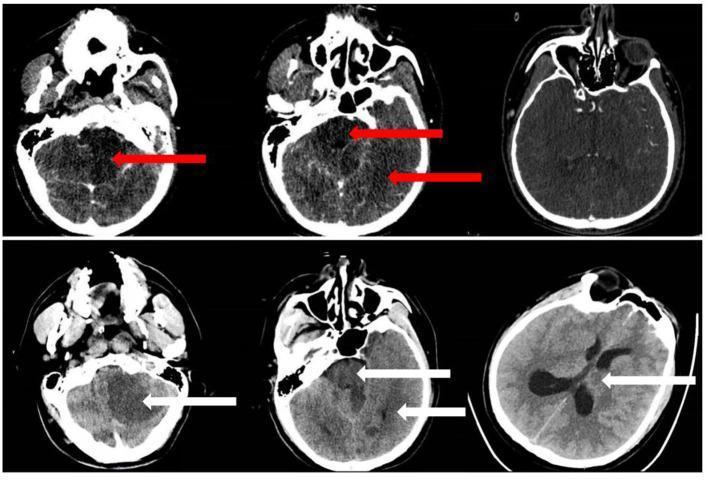
This diagnostic comparison displays axial brain CT images from a patient with basilar artery occlusion (BAO), illustrating the assessment of early ischemic changes using the posterior circulation Acute Stroke Prognosis Early CT Score (pc-ASPECTS). The upper row contains CT angiography source images (CTA-SI), where red arrows highlight focal hypoattenuation in the midbrain, left cerebellum, and left posterior cerebral artery (PCA) territory. The lower row shows follow-up non-contrast CT (NCCT) scans, where white arrows indicate progressive ischemic evolution, characterized by increased hypoattenuation in the previously noted regions and new involvement of the left thalamus. The visual findings demonstrate the transition from a pc-ASPECTS of 6 on initial CTA-SI to a lower score of 5 on NCCT, indicating expanding infarction. These images serve as an educational example of neuroradiological evaluation for posterior circulation strokes, emphasizing the identification of subtle density changes in the brainstem, cerebellum, and diencephalon to predict clinical outcomes.
"stroke mimics" thrombolysis safety outcome
mkdir -p /tmp/workspace/stroke-mimics-pptx && ls /tmp/workspace/