
Differences between bph and carcinoma of prostate Pathology and histology of prostate Give answers should include only 3 mins
BPH vs carcinoma prostate histology comparison
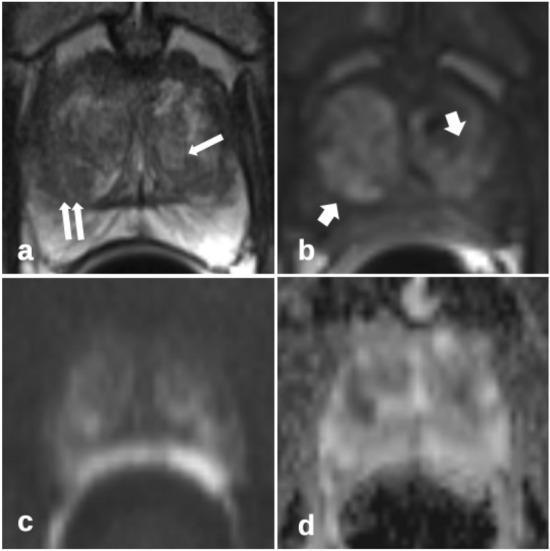
This four-panel diagnostic image displays multiparametric magnetic resonance imaging (mpMRI) of the prostate in a 57-year-old patient with benign prostatic hyperplasia (BPH). Panel (a) is a T2-weighted axial image showing typical BPH nodules in the transition zone (TZ) and marked biopsy traces indicated by long arrows as linear, hypointense signal alterations. Panel (b) illustrates a T1-weighted early-phase dynamic perfusion image where short arrows highlight a non-specific heterogeneous perfusion pattern within the transition zone, lacking marked asymmetry or focal high signal intensity. Panel (c) shows diffusion-weighted imaging (DWI) at a high b-value (b=1400), and panel (d) presents the corresponding apparent diffusion coefficient (ADC) map. These sequences collectively demonstrate the absence of suspicious restricted diffusion or focal enhancement characteristic of prostate carcinoma. The educational focus is on distinguishing the symmetric, heterogeneous enhancement patterns of benign transition zone hyperplasia from the focal, asymmetric, and homogeneous patterns typically associated with malignant lesions according to PI-RADSv2.1 criteria.
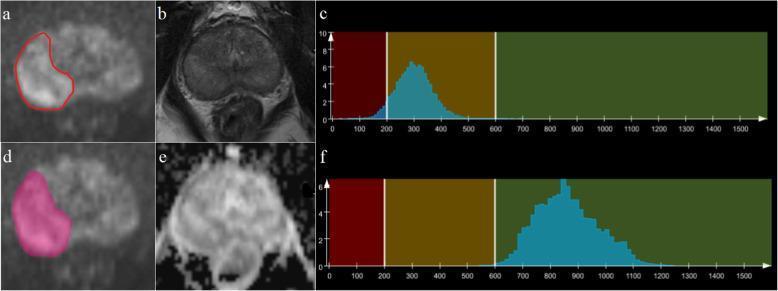
Multiparametric magnetic resonance imaging (mpMRI) and histogram analysis of the prostate in a 63-year-old male with benign prostatic hypertrophy (BPH). The panel includes axial views: (a, d) Diffusion-weighted imaging (DWI) at b=1500 s/mm2 showing an irregular lesion in the left peripheral zone delineated by red contour and pink segmentation mask; (b) T2-weighted (T2W) image providing detailed anatomical visualization of the prostate zonal anatomy and central gland enlargement; (e) Apparent Diffusion Coefficient (ADC) map showing corresponding restricted diffusion. Accompanying histograms (c, f) display quantitative signal intensity distributions for the T2W (c) and ADC (f) data, categorized into color-coded intensity zones (red, yellow, green). This composite demonstrates the workflow for whole-lesion texture and histogram analysis used to differentiate benign hypertrophy from prostatic carcinoma by evaluating parameters such as mean intensity, skewness, and kurtosis within the segmented volume of interest.
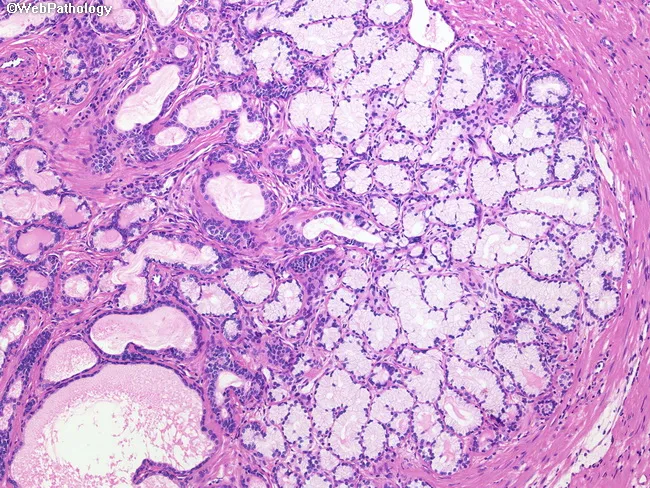
This histopathology image shows prostate tissue with mucinous differentiation within a benign prostatic hyperplasia (BPH) nodule. Prepared as a formalin-fixed, paraffin-embedded section and visualized by brightfield light microscopy, the slide is stained with Hematoxylin and Eosin (H&E). The right half of the field demonstrates extensive mucinous metaplasia in which the normal glandular epithelium is replaced by mucin-secreting cells. The involved glands appear lighter pink due to abundant mucin within the lumen and cytoplasm, producing a pale, glassy appearance compared with adjacent non-mucinous glands. Glandular architecture remains benign without overt invasion or high-grade cytologic atypia. The mucin pools are intra- and peri-luminal, sometimes compressing surrounding stroma but preserving overall prostatic acinar arrangement. This entity is considered an incidental, benign variant, with no malignant potential, and must be distinguished from mucinous (colloid) adenocarcinoma, which would demonstrate infiltrative growth and mucin lakes with malignant epithelial cells. The image highlights a spectrum of prostatic mucinous differentiation, emphasizing that mucinous metaplasia can occur within BPH nodules and often lacks clinical consequence. Clinically, recognition avoids misdiagnosis of prostatic mucinous carcinoma; pathologists should correlate with PSA, imaging, and clinical history for accurate interpretation. Clinical relevance emphasized.
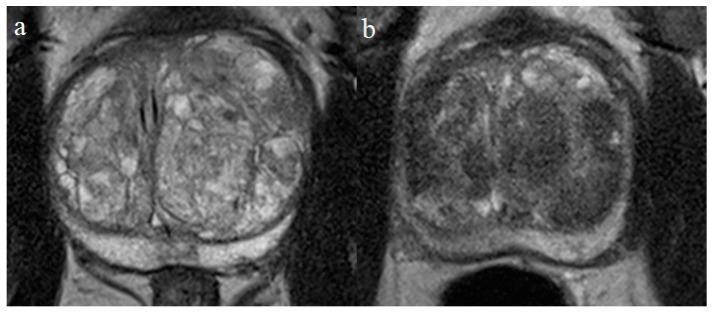
Comparison of pre- and post-treatment axial T2-weighted turbo spin echo (TSE) magnetic resonance imaging (MRI) of the prostate. Image (a) shows Benign Prostatic Hyperplasia (BPH) with a significantly enlarged prostate gland. There is a prominent, heterogeneous, hyperintense adenoma in the transition zone, particularly in the left lobe, which is seen compressing and displacing the prostatic urethra. Image (b) shows the same patient three months following prostatic artery embolization (PAE). The follow-up scan demonstrates a marked reduction in prostate volume and a diffuse decrease in T2 signal intensity within the treated areas. This global T2-hypointensity and more homogeneous texture correspond to tissue infarction and subsequent fibrosis of the prostatic adenoma. The compression on the prostatic urethra is visibly relieved compared to the baseline image. This diagnostic comparison illustrates the efficacy of minimally invasive interventions in reducing glandular volume and altering tissue composition in symptomatic BPH.
prostate adenocarcinoma histology Gleason grading
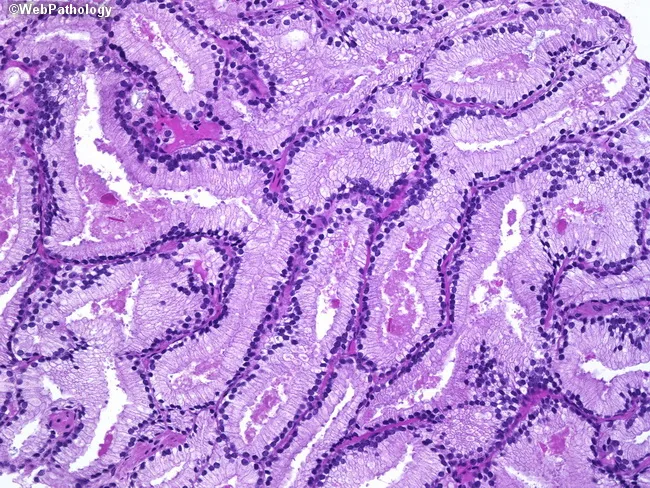
High-power histology image of prostatic acinar adenocarcinoma (Gleason score 3+3=6) viewed under bright-field light microscopy. The specimen demonstrates well-formed, back-to-back glands infiltrating the periglandular stroma, consistent with low-grade malignant acinar architecture. Gland lumina are generally round to slightly elongated, lined by a single layer of cuboidal to columnar epithelial cells with mild cytologic atypia, small central nuclei, and occasional stratification. The basal cell layer characteristic of benign prostatic acini is not evident within the malignant glands, and there is minimal desmoplastic reaction. The glands vary in size but maintain a predominantly tubular, well-differentiated appearance without prominent cribriform, fused, or solid growth patterns, which aligns with Gleason pattern 3. Nuclei show modest enlargement; nucleoli are rarely conspicuous in this field. Overall morphology supports a low-grade prostatic adenocarcinoma, with infiltration into surrounding stroma but without high-grade features locally evident. This image captures a classic example applicable to educational discussions of prostate cancer grading, prognosis, and management implications. Clinically relevant keywords include prostate cancer, acinar adenocarcinoma, Gleason 3+3, tumor architecture, well-formed glands, low grade, and active surveillance considerations. It complements histology teaching of tumor grading systems and is suitable for radiologic-pathologic correlation and pathology review.
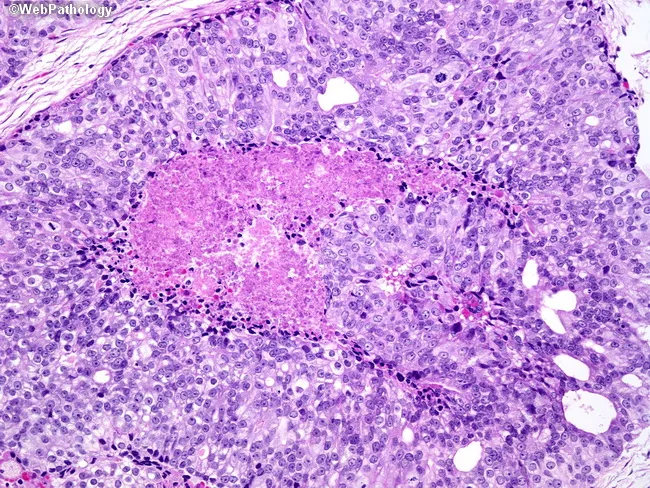
Histopathology: Prostate tissue examined by light microscopy after Hematoxylin and Eosin staining reveals high-grade prostatic adenocarcinoma with solid nests exhibiting comedonecrosis. The center shows necrotic ghost remnants surrounded by a layer of karyorrhectic debris; at the periphery, layers of viable malignant epithelial cells display enlarged, hyperchromatic nuclei and prominent nucleoli. The architectural pattern includes solid and cribriform nests with occasional back-to-back glands, consistent with Gleason pattern 5. Overall Gleason score is 10 (5+5). Notable features include extensive tumor necrosis, conspicuous cytologic atypia, and a high nuclear-to-cytoplasmic ratio. Tumor invasion of the adjacent stroma is evident in places, with limited mitotic activity but aggressive phenotype suggested by necrotic cores and dense cellularity. Clinically, this histology indicates a highly aggressive, poorly differentiated lesion with elevated metastatic potential and poorer prognosis compared with lower Gleason scores. This finding supports definitive management with multimodal therapy and close staging. For educational and diagnostic use, this image demonstrates comedonecrosis in prostatic adenocarcinoma, cribriform/high-grade patterns, and the cytologic features that contribute to Gleason grading and prognostic assessment.
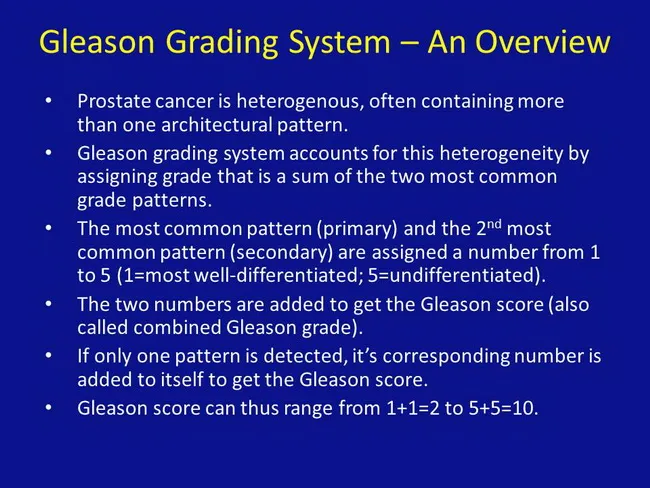
Imaging modality: Not applicable; this is an educational infographic illustrating the Gleason Grading System for prostate cancer. Primary subject: Gleason grading; Prostate gland tissue; histopathology overview. The figure explains that prostate adenocarcinoma is graded by two most prevalent architectural patterns observed in needle core biopsy or prostatectomy specimens. Patterns are numbered 1 through 5, with 1 being well differentiated (well-formed glands) and 5 being undifferentiated. The most common pattern (primary) and the second most common pattern (secondary) are assigned numbers and added to produce the Gleason score (e.g., 3+4 = 7; also called combined Gleason grade). If only a single pattern is detected, that pattern is summed with itself to yield the score (e.g., 3+3 = 6). The final score ranges from 2 to 10 in older definitions but commonly reported as 6 to 10 in modern practice, with higher scores indicating more aggressive disease. The diagnostic significance lies in prognosis and treatment planning; higher scores correlate with worse prognosis and may prompt intensified therapy, surveillance strategies, or risk stratification. Clinically, Gleason grading is integrated with PSA levels and imaging findings to guide biopsy decisions, active surveillance versus definitive therapy, and eligibility for systemic treatment. This framework supports educational, research, and clinical decision scenarios, including risk-adapted management, stratification into low-, intermediate-, and high-risk groups, and comparative pathology teaching for learners globally.
BPH vs Carcinoma of Prostate - Pathology & Histology
PART 1 - DIFFERENCES: BPH vs Carcinoma of Prostate
| Feature | BPH | Carcinoma of Prostate |
|---|---|---|
| Nature | Non-neoplastic, benign hyperplasia | Malignant neoplasm (adenocarcinoma) |
| Zone affected | Transition zone (periurethral) | Peripheral zone (~70% of cases) |
| Age | Begins ~40s; symptomatic 60s-70s | Rare <50 yrs; increases sharply after 60 |
| Aetiology | Androgen-related hyperplasia (DHT dependent) | Androgens, genetic mutations, environmental factors |
| Gross appearance | Well-defined nodules compressing urethra to slit-like lumen | Firm, gritty, gray-white lesion with ill-defined margins infiltrating the gland |
| Gland architecture | Large glands with papillary infoldings and branching | Smaller glands, crowded, no papillary infolding, no branching |
| Basal cell layer | Present (2-cell layer: secretory + basal) | Absent (single layer of cuboidal/columnar cells) |
| Nucleoli | Inconspicuous | Prominent nucleoli - key histological feature |
| Stromal component | Proliferation of smooth muscle + fibrous stroma | Desmoplastic stroma; minimal in early disease |
| Corpora amylacea | Often present (rounded pink concretions) | Less characteristic |
| Capsule invasion | No | Yes (extracapsular extension in advanced disease) |
| Urethral obstruction | Early (central location compresses urethra) | Late (peripheral location; symptoms late) |
| Rectal exam (DRE) | Enlarged, smooth, rubbery gland | Irregular hard nodules in peripheral zone |
| Metastasis | Does NOT metastasize | Yes - lymph nodes, bone (osteoblastic), liver |
| Bone metastases | None | Osteoblastic (sclerotic) - axial skeleton |
| PSA | Modestly elevated | Markedly elevated (useful for monitoring, not perfect for screening) |
| Treatment | Alpha-blockers, 5-alpha reductase inhibitors, TURP | Androgen deprivation, radiation, surgery |
PART 2 - PATHOLOGY & HISTOLOGY IN DETAIL
A. BPH Pathology
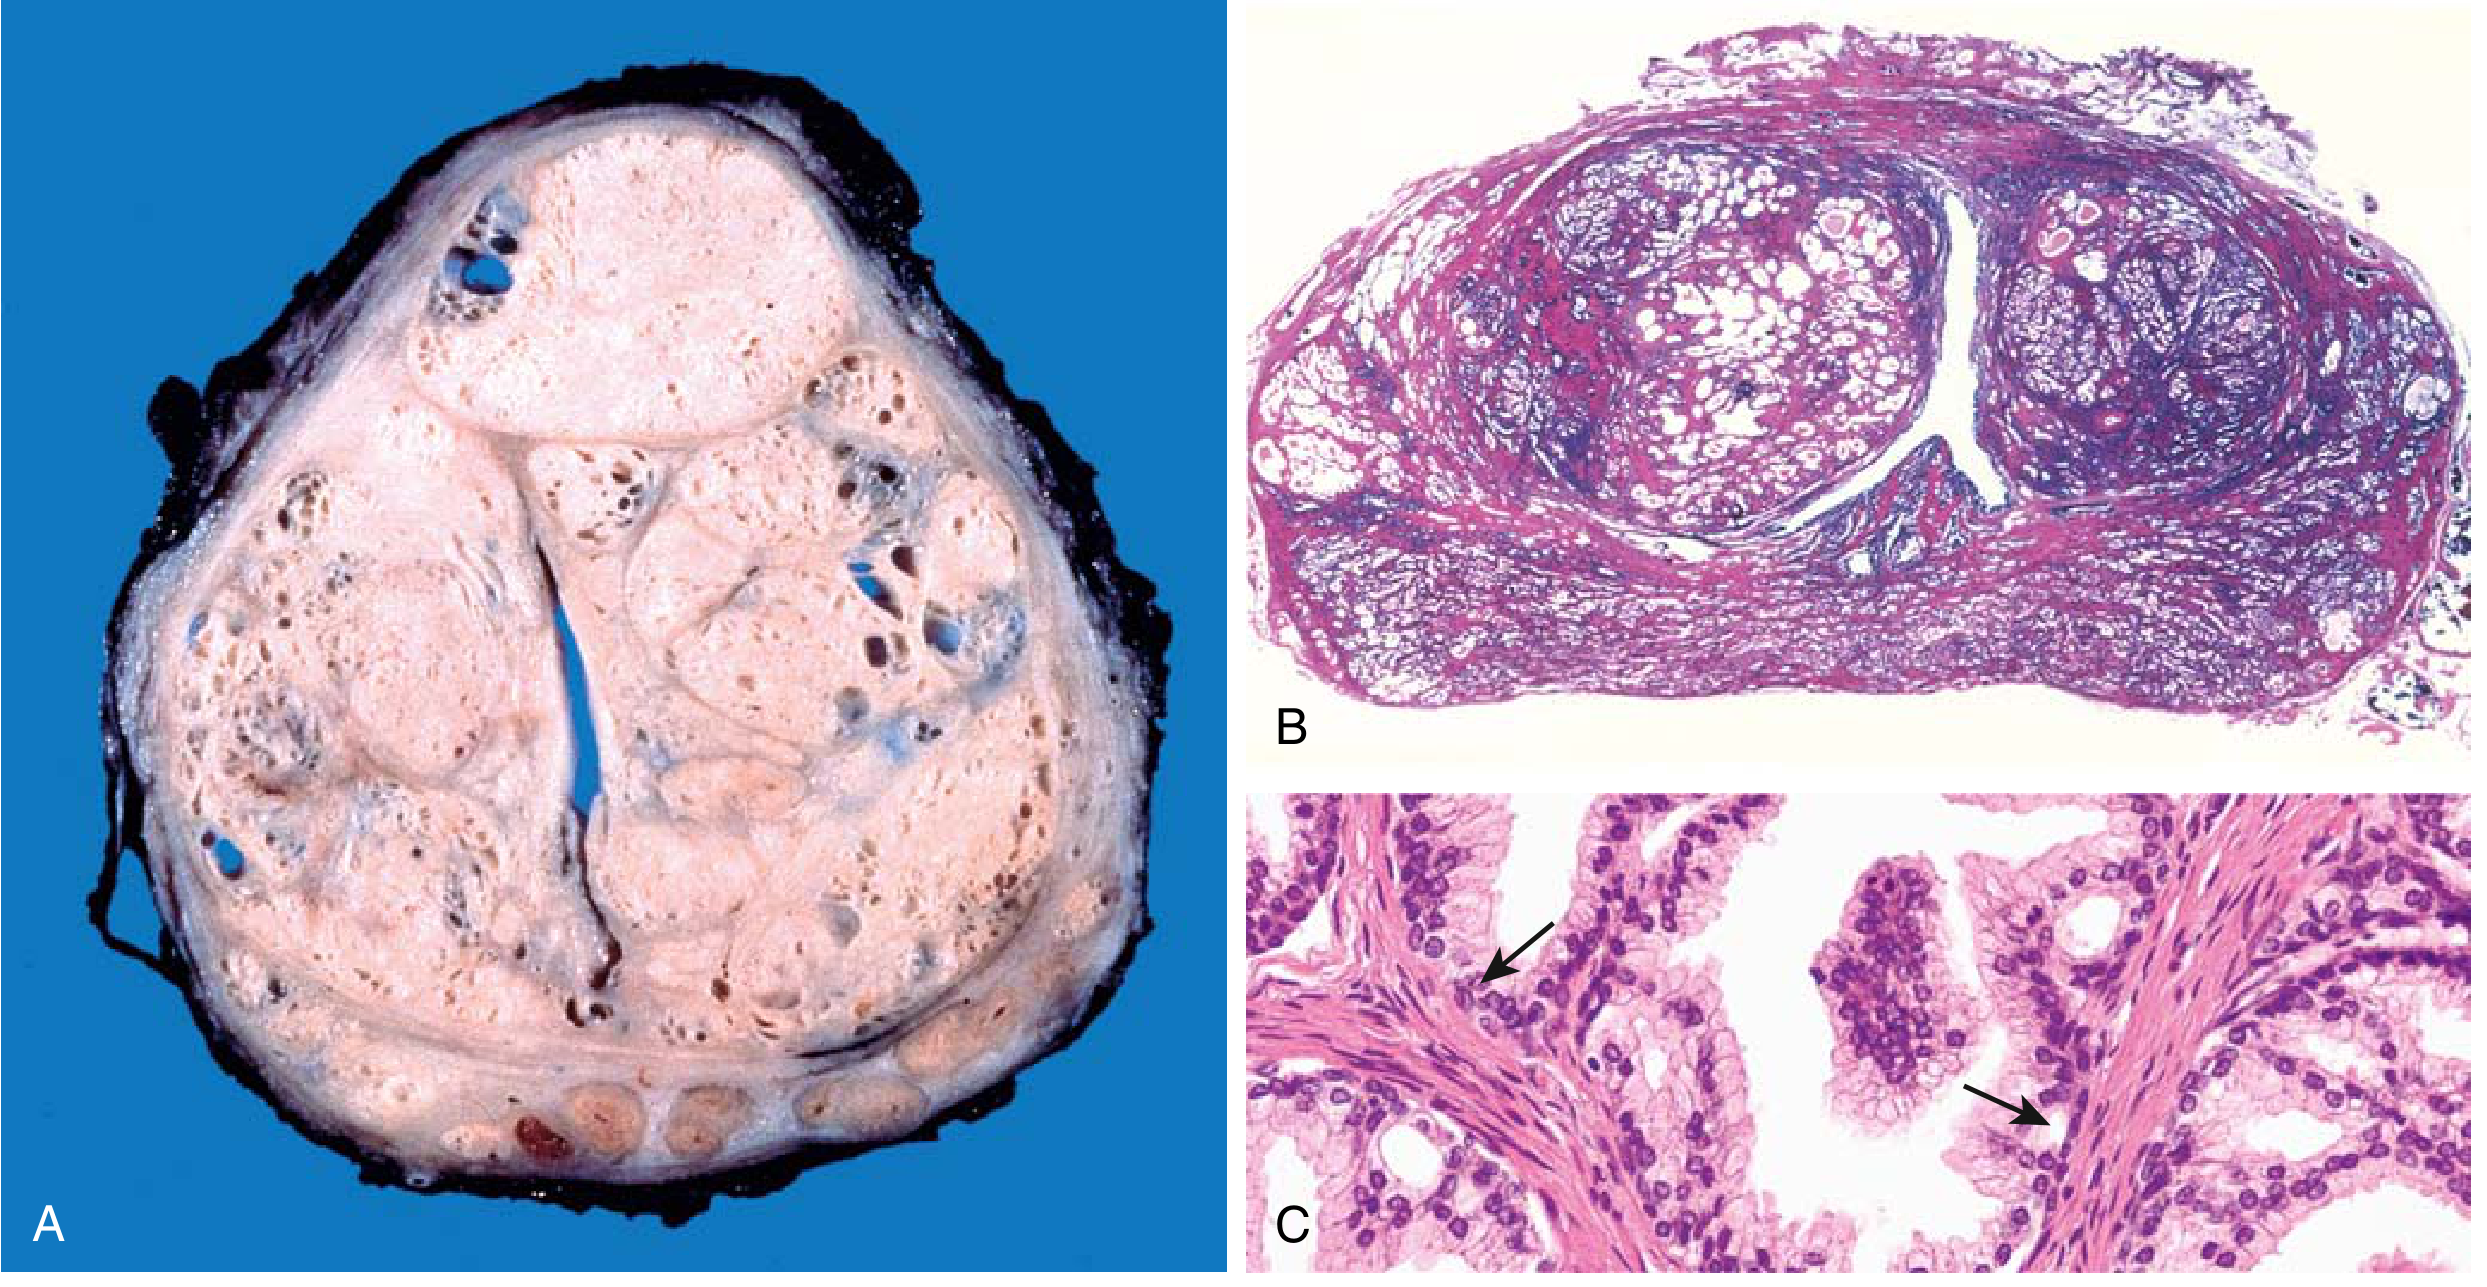
- Well-defined, rubbery nodules in the transition/central zone
- Nodules compress the prostatic urethra into a slit-like lumen
- Bladder wall hypertrophy and trabeculation develops secondary to outflow obstruction
- Nodules composed of varying combinations of:
- Proliferating glandular epithelium (glandular type)
- Fibromuscular stroma (stromal type)
- Or both
- Glands are large with papillary infoldings into the lumen
- Two-cell layer preserved: luminal columnar secretory cells + basal cells (key feature distinguishing BPH from carcinoma)
- Corpora amylacea (rounded, eosinophilic concretions) frequently seen in gland lumina
- Mitoses are rare; no nuclear atypia
B. Carcinoma of Prostate Pathology
- Arises in peripheral zone (posterior) in ~70% cases - palpable on DRE
- Cut section: firm, gritty, gray-white tissue with ill-defined infiltrating margins
- Contrast: spongy appearance of normal peripheral zone vs solid cancerous tissue
- Most are moderately differentiated adenocarcinomas producing well-defined glands
- Glands are smaller than benign glands and crowded together
- Lined by single uniform layer of cuboidal/low columnar epithelium
- No basal cell layer (critical diagnostic feature)
- No papillary infoldings or branching (unlike BPH)
- Prominent nucleoli - key cytological marker of malignancy
- Mild nuclear pleomorphism; mitoses are uncommon in low-grade
- ~80% of cases also show High-Grade Prostatic Intraepithelial Neoplasia (HGPIN) - the presumed precursor lesion
| Grade | Architecture |
|---|---|
| 1 | Well-formed, round, uniform glands (most differentiated) |
| 2 | Well-formed glands, slightly more variation |
| 3 | Infiltrating glands, irregular spacing - most common |
| 4 | Poorly formed, fused, or cribriform glands |
| 5 | No gland formation; cords, sheets, solid nests with comedonecrosis |
- Gleason Score = Primary pattern + Secondary pattern (e.g., 3+4 = 7)
- Score 6 = low risk | Score 7 = intermediate | Score 8-10 = high risk / aggressive
- Modern classification uses 5 Grade Groups based on Gleason score