Afib with cvr

Reading File
Finding Sources
Searching Images

atrial fibrillation ECG rhythm strip

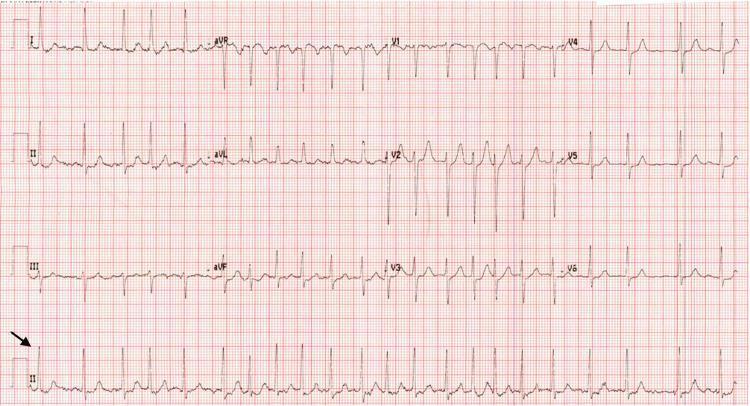
This diagnostic image is a 12-lead electrocardiogram (ECG) printed on standard grid paper, demonstrating new-onset atrial fibrillation. The ECG displays the standard limb leads (I, II, III), augmented limb leads (aVR, aVL, aVF), and precordial leads (V1-V6), with a rhythm strip for lead II at the bottom. The tracing is characterized by an irregularly irregular rhythm and the absence of discernible P waves. In their place, the baseline exhibits fine, irregular fibrillatory (f) waves, most prominently seen in lead V1 and the rhythm strip (indicated by a black arrow). The QRS complexes appear narrow and vary in their R-R intervals, a hallmark of irregular ventricular response in atrial fibrillation. Precordial leads V1 through V6 show a progression of R-wave amplitude. There is no evidence of significant ST-segment elevation or depression, suggesting an absence of acute myocardial infarction. This visual serves as a classic educational example of atrial fibrillation pathophysiology and diagnostic ECG features.
This diagnostic image is a 12-lead electrocardiogram (ECG) printed on standard grid paper, demonstrating new-onset atrial fibrillation. The ECG displays the standard limb leads (I, II, III), augmented limb leads (aVR, aVL, aVF), and precordial leads (V1-V6), with a rhythm strip for lead II at the bottom. The tracing is characterized by an irregularly irregular rhythm and the absence of discernible P waves. In their place, the baseline exhibits fine, irregular fibrillatory (f) waves, most prominently seen in lead V1 and the rhythm strip (indicated by a black arrow). The QRS complexes appear narrow and vary in their R-R intervals, a hallmark of irregular ventricular response in atrial fibrillation. Precordial leads V1 through V6 show a progression of R-wave amplitude. There is no evidence of significant ST-segment elevation or depression, suggesting an absence of acute myocardial infarction. This visual serves as a classic educational example of atrial fibrillation pathophysiology and diagnostic ECG features.

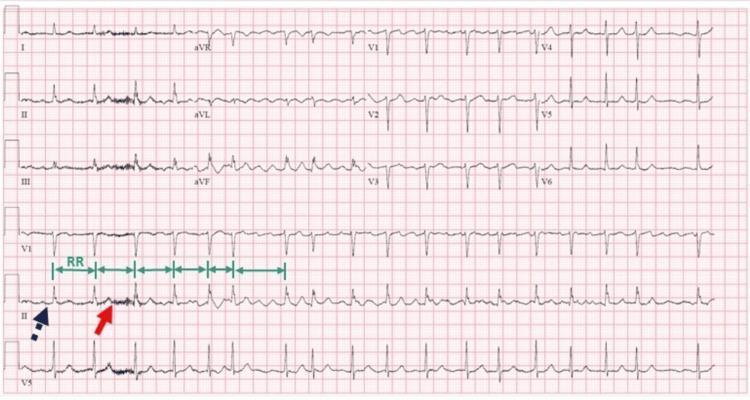
This diagnostic image is a 12-lead electrocardiogram (ECG) printed on standard grid paper, demonstrating classic features of atrial fibrillation. The tracing shows a rhythm characterized by 'irregularly irregular' R-R intervals, which are explicitly marked with green bidirectional arrows in the rhythm strip to highlight the variability in heart rate. A defining feature of this ECG is the complete absence of organized P waves preceding the QRS complexes. Instead, the baseline exhibits fibrillatory waves—small, rapid, and irregular oscillations—most clearly visible in the rhythm strip of Lead II (indicated by a solid red arrow) and Lead V1. The purple dashed arrow highlights the flat or undulating baseline where a P wave would normally be expected in sinus rhythm. The QRS complexes appear narrow, suggesting normal ventricular conduction despite the supraventricular arrhythmia. This visual material is a primary educational resource for cardiology and internal medicine, illustrating the fundamental diagnostic criteria for atrial fibrillation.
This diagnostic image is a 12-lead electrocardiogram (ECG) printed on standard grid paper, demonstrating classic features of atrial fibrillation. The tracing shows a rhythm characterized by 'irregularly irregular' R-R intervals, which are explicitly marked with green bidirectional arrows in the rhythm strip to highlight the variability in heart rate. A defining feature of this ECG is the complete absence of organized P waves preceding the QRS complexes. Instead, the baseline exhibits fibrillatory waves—small, rapid, and irregular oscillations—most clearly visible in the rhythm strip of Lead II (indicated by a solid red arrow) and Lead V1. The purple dashed arrow highlights the flat or undulating baseline where a P wave would normally be expected in sinus rhythm. The QRS complexes appear narrow, suggesting normal ventricular conduction despite the supraventricular arrhythmia. This visual material is a primary educational resource for cardiology and internal medicine, illustrating the fundamental diagnostic criteria for atrial fibrillation.

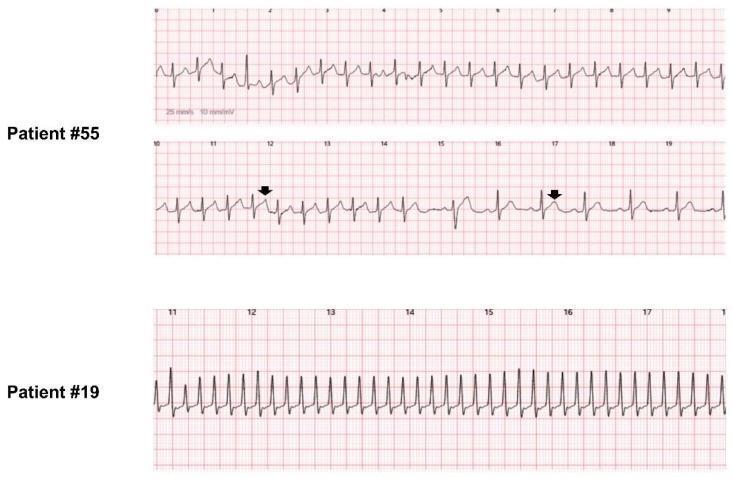
This diagnostic image displays three electrocardiography (ECG) rhythm strips recorded by a watch-type wearable device (w-ECG) for two different patients. The upper two strips (Patient #55) illustrate paroxysmal supraventricular tachycardia (PSVT), specifically atrioventricular nodal reentrant tachycardia (AVNRT), fast-slow type. Black arrows highlight distinct differences in T-wave morphology between tachycardia and sinus rhythm phases, indicating variations in ventricular repolarization. The middle strip captures the sudden termination of tachycardia with an 'A-no-V' mode of termination. The bottom strip (Patient #19) demonstrates a narrow QRS complex tachycardia characterized by a regular, rapid rhythm and consistent morphology, later diagnosed as atypical atrial flutter following radiofrequency catheter ablation for atrial fibrillation. The comparison demonstrates the clinical utility of w-ECG devices in discriminating QRS morphology, detecting P-waves, and identifying subtle repolarization changes in cardiac arrhythmias like SVT and atrial flutter for diagnostic and post-procedural monitoring.

This diagnostic image displays three electrocardiography (ECG) rhythm strips recorded by a watch-type wearable device (w-ECG) for two different patients. The upper two strips (Patient #55) illustrate paroxysmal supraventricular tachycardia (PSVT), specifically atrioventricular nodal reentrant tachycardia (AVNRT), fast-slow type. Black arrows highlight distinct differences in T-wave morphology between tachycardia and sinus rhythm phases, indicating variations in ventricular repolarization. The middle strip captures the sudden termination of tachycardia with an 'A-no-V' mode of termination. The bottom strip (Patient #19) demonstrates a narrow QRS complex tachycardia characterized by a regular, rapid rhythm and consistent morphology, later diagnosed as atypical atrial flutter following radiofrequency catheter ablation for atrial fibrillation. The comparison demonstrates the clinical utility of w-ECG devices in discriminating QRS morphology, detecting P-waves, and identifying subtle repolarization changes in cardiac arrhythmias like SVT and atrial flutter for diagnostic and post-procedural monitoring.

Searching PubMed

"atrial fibrillation" AND "rate control"

Reading File
Reading File
Your credits are exhausted. You can purchase a top-up or subscribe to a plan to continue using Orris. If you're already subscribed, your daily credits will reset tomorrow.

Everything

Your credits are exhausted. You can purchase a top-up or subscribe to a plan to continue using Orris. If you're already subscribed, your daily credits will reset tomorrow.
This is a shared conversation. Sign in to Orris to start your own chat.