


+2 more
answers these including graphs pictures and tables for pharmd 1st year
Reading File
This is a large multi-unit exam preparation task covering 4 units. Let me plan this efficiently and research all topics in parallel.
Finding Sources
Finding Sources
Finding Sources
Finding Sources
Finding Sources
Finding Sources
Finding Sources
Finding Sources
I have enough context from the library. Given the large number of questions across 4 units, I'll now compose comprehensive answers from my medical knowledge (reinforced by the library references) with tables, diagrams described in text form, and structured content suitable for PharmD 1st year.
Searching Images
lipoprotein structure HDL LDL VLDL classification
Searching Images
ELISA enzyme linked immunosorbent assay types diagram
Searching Images
kidney nephron filtration diagram NPN constituents
Searching Images
liver function tests SGOT SGPT AST ALT hepatic
I now have rich textbook-backed content and relevant images. Let me compile the full comprehensive answers for all 4 units.Here are comprehensive answers for all four units. I'll present them with tables, diagrams (described as ASCII/text art where images are embedded), and structured content appropriate for PharmD 1st year.
UNIT VII — Introduction to Clinical Chemistry
Very Short Answer Questions (2 marks)
1. What is Semiquantitative Urine Analysis?
Semiquantitative urine analysis is a method of urine examination that provides an approximate quantification of urinary constituents using dipstick (reagent strip) tests or simple chemical methods. It does not give exact concentrations but indicates levels as trace, +, ++, +++, etc.
Components tested: Glucose, protein, ketones, bilirubin, urobilinogen, blood, pH, specific gravity, nitrites, leukocyte esterase.
2. Urine Concentration Test — Significance
The urine concentration test (also called the water deprivation test or Fishberg concentration test) assesses the tubular concentrating ability of the kidney.
Procedure: Patient is deprived of fluids for 12–14 hours; urine is collected every hour for 3 hours.
| Parameter | Normal Result | Significance if Abnormal |
|---|---|---|
| Specific gravity | ≥ 1.025 | Tubular damage if < 1.025 |
| Urine osmolality | > 800 mOsm/kg | Diabetes insipidus if low |
Significance: Detects early tubular dysfunction before GFR falls significantly.
3. Creatinine Clearance Test — Significance
Creatinine clearance (CrCl) measures the glomerular filtration rate (GFR).
$$CrCl = \frac{U_{Cr} \times V}{P_{Cr}}$$
Where: U = urine creatinine (mg/dL), V = urine flow (mL/min), P = plasma creatinine (mg/dL)
| Normal Values | Male | Female |
|---|---|---|
| CrCl (mL/min) | 97–137 | 88–128 |
| Serum creatinine (mg/dL) | 0.7–1.3 | 0.5–1.1 |
Significance: Best routine indicator of GFR; detects renal impairment; monitors progression of CKD; guides drug dosing.
4. Urinary Tract Calculi (Kidney Stones)
Urinary calculi are solid crystalline deposits that form in the urinary tract.
| Type | Composition | Frequency | Urine pH |
|---|---|---|---|
| Calcium oxalate | CaC₂O₄ | 70–80% | Acidic |
| Struvite | Mg-NH₄-PO₄ | 10–15% | Alkaline |
| Uric acid | Uric acid | 5–10% | Acidic |
| Cystine | Cystine | 1–2% | Variable |
| Calcium phosphate | Ca₃(PO₄)₂ | 5% | Alkaline |
5. Urea Clearance Test — Significance
Urea clearance = volume of blood cleared of urea per minute.
Formula:
$$\text{Urea Clearance} = \frac{U \times V}{B}$$
| Type | Formula | Normal Value |
|---|---|---|
| Maximum clearance (V > 2 mL/min) | UV/B | 75 mL/min |
| Standard clearance (V < 2 mL/min) | U√V/B | 54 mL/min |
Significance: Reflects overall renal function; decreased in nephritis, nephrosclerosis.
6. Four Normal Urine Constituents
| Constituent | Normal Value |
|---|---|
| Urea | 20–35 g/day |
| Creatinine | 1–2 g/day |
| Uric acid | 0.5–1 g/day |
| Sodium (NaCl) | 6–17 g/day |
| Ammonia | 0.5–1.5 g/day |
| Phosphates | 2–4 g/day |
7. NPN (Non-Protein Nitrogen) Constituents Test
NPN refers to nitrogen-containing compounds in blood that are not part of proteins.
NPN Constituents & Normal Serum Values:
| NPN Constituent | Normal Value (mg/dL) |
|---|---|
| Urea (BUN) | 7–20 (BUN) / 15–40 (urea) |
| Creatinine | 0.6–1.2 |
| Uric acid | 3–7 (M), 2–6 (F) |
| Creatine | 0.2–0.6 |
| Ammonia | 11–35 µmol/L |
| Amino acids | 35–65 |
Tests for NPN:
- BUN (Blood Urea Nitrogen): Diacetyl monoxime method; Urease method
- Creatinine: Jaffe's reaction (alkaline picrate → orange-red color)
- Uric acid: Phosphotungstic acid method; Uricase method
8. Functions of the Kidney
┌─────────────────────────────────────────┐
│ KIDNEY FUNCTIONS │
├──────────────────┬──────────────────────┤
│ Excretory │ Regulatory │
│ • Urea, creat- │ • Water balance │
│ inine, uric │ • Electrolyte │
│ acid │ balance (Na,K,Cl) │
│ • Drug metabol- │ • Acid-base balance │
│ ites │ • Blood pressure │
├──────────────────┼──────────────────────┤
│ Endocrine │ Metabolic │
│ • Erythropoietin │ • Vitamin D activ- │
│ • Renin │ ation (1,25-OH₂D₃) │
│ • Prostaglandins │ • Gluconeogenesis │
└──────────────────┴──────────────────────┘
9. Role of Clinical Laboratory
The clinical laboratory provides:
- Diagnostic support — identifies disease states
- Monitoring — tracks disease progression and treatment response
- Screening — identifies at-risk populations
- Prognosis — predicts disease outcomes
- Research — supports clinical and pharmaceutical research
Long Answer Questions (15 marks)
Q1. Kidney Function Tests (KFT) — Comprehensive
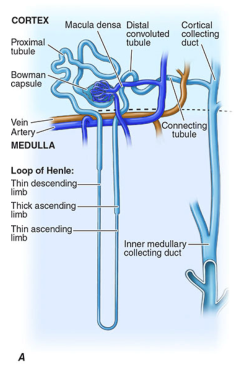
Kidney function tests assess glomerular filtration, tubular function, and concentrating ability.
Classification of KFT
KIDNEY FUNCTION TESTS
│
├── A. GLOMERULAR FUNCTION TESTS
│ ├── Creatinine Clearance
│ ├── Urea Clearance
│ ├── Inulin Clearance (gold standard)
│ └── Serum creatinine, BUN, cystatin C
│
├── B. TUBULAR FUNCTION TESTS
│ ├── Urine Concentration Test (Fishberg)
│ ├── Urine Dilution Test
│ ├── PSP (Phenolsulfonphthalein) Test
│ └── TmPAH (tubular maximum)
│
└── C. RENAL BLOOD FLOW
└── PAH Clearance
Glomerular Filtration Tests
| Test | Principle | Normal | Clinical Use |
|---|---|---|---|
| Serum Creatinine | Jaffe method | 0.6–1.2 mg/dL | Simple screen |
| BUN | Urease/diacetyl | 7–20 mg/dL | Renal function |
| BUN:Creatinine ratio | — | 10:1 to 20:1 | Pre-renal vs renal |
| Creatinine clearance | UV/P | 97–137 mL/min | Best routine GFR |
| Inulin clearance | UV/P | 125 mL/min | Gold standard GFR |
Urine Dilution Test
Patient drinks 1.2 L water in 30 min. Normal: specific gravity falls to ≤ 1.002 within 2–4 hours. Failure indicates tubular dysfunction.
PSP Test (Tubular Secretion)
- IV injection of 6 mg PSP dye
- Normal: ≥ 25% excreted in 15 min, ≥ 50% in 1 hour
- Reflects proximal tubular secretory function
Q2. Urinary Tract Calculi & 4 Abnormal Urine Constituents
Abnormal Urine Constituents
| Constituent | Condition | Test Used |
|---|---|---|
| Glucose (glucosuria) | Diabetes mellitus, renal glycosuria | Benedict's test; glucose oxidase |
| Protein (proteinuria) | Nephrotic syndrome, glomerulonephritis | Sulfosalicylic acid; dipstick |
| Ketones (ketonuria) | DKA, starvation | Rothera's test; nitroprusside |
| Bilirubin (bilirubinuria) | Obstructive/hepatic jaundice | Fouchet's test; foam test |
| RBC (hematuria) | Stones, UTI, tumors | Microscopy |
| Pus cells (pyuria) | Urinary tract infection | Microscopy |
| Casts | Renal parenchymal disease | Microscopy |
Urinary Tract Calculi
Pathogenesis:
Supersaturation of urine
↓
Nucleation (crystal formation)
↓
Crystal growth & aggregation
↓
Stone formation
Diagnosis: KUB X-ray, ultrasound, CT scan, urinalysis (crystals), 24-hr urine collection.
Q3. Role of Kidney in Filtration + NPN Constituents (with Diagram)
Kidney Filtration Mechanism
BLOOD → GLOMERULUS → FILTRATION → PRIMARY URINE
↓
PROXIMAL TUBULE
(reabsorption of glucose,
amino acids, Na⁺, water)
↓
LOOP OF HENLE
(concentration gradient)
↓
DISTAL TUBULE
(K⁺/H⁺ secretion, Na⁺ reab.)
↓
COLLECTING DUCT
(ADH-dependent water reab.)
↓
FINAL URINE → URETER → BLADDER
NPN Constituents Tests
| NPN | Method | Principle |
|---|---|---|
| Urea | Diacetyl monoxime (Fearon reaction) | Urea + diacetyl monoxime → yellow chromogen in acidic medium |
| Urea | Urease method | Urease converts urea → NH₃; measured by Berthelot reaction (blue indophenol) |
| Creatinine | Jaffe's reaction | Creatinine + alkaline picrate → orange-red Janovsky complex; λ = 520 nm |
| Uric acid | Phosphotungstic acid | Uric acid reduces PTA → tungsten blue; λ = 700 nm |
| Uric acid | Uricase method | Uricase oxidizes uric acid; decrease in A₂₉₃ measured |
| Ammonia | Berthelot reaction | NH₃ + hypochlorite + phenol → indophenol blue |
Q4. Clearance Tests (Creatinine & Urea)
Creatinine Clearance — Step-by-step:
- Collect 24-hr urine; measure urine volume (V in mL/min)
- Measure urine creatinine (U, mg/dL) and serum creatinine (P, mg/dL)
- Calculate: CrCl = (U × V) / P
Cockcroft-Gault formula (estimated CrCl):
$$CrCl = \frac{(140 - Age) \times Weight(kg)}{72 \times Serum\ Creatinine} \times (0.85\ for\ females)$$
| GFR Stage | CrCl | Significance |
|---|---|---|
| Normal | 90–130 mL/min | Healthy kidney |
| Mild CKD | 60–89 | Mildly decreased |
| Moderate | 30–59 | Moderate CKD |
| Severe | 15–29 | Severe CKD |
| ESRD | < 15 | Dialysis needed |
UNIT VIII — Liver Function Tests
Very Short Answer Questions (2 marks)
1. Tests for Excretory Function of Liver
| Test | Measures | Principle |
|---|---|---|
| Serum Bilirubin (van den Bergh) | Direct/indirect bilirubin | Diazo reaction with sulfanilic acid |
| BSP (Bromsulphthalein) test | Hepatic excretion capacity | IV dye injection; % retained at 45 min |
| Bile acids in serum | Enterohepatic circulation | Enzymatic method |
| Urine bilirubin | Conjugated bilirubin | Fouchet's test |
2. Tests for Assessing Metabolic Capacity of Liver
| Test | Measures |
|---|---|
| Serum proteins (albumin/globulin ratio) | Protein synthesis |
| Prothrombin time (PT) | Coagulation factor synthesis |
| Serum cholesterol | Cholesterol synthesis |
| Serum glucose / galactose tolerance | Carbohydrate metabolism |
| Hippuric acid test | Detoxification ability |
3. Detoxification Function of Liver
The liver detoxifies foreign substances through:
PHASE I REACTIONS (Oxidation, Reduction, Hydrolysis)
Cytochrome P450 enzymes (CYP)
Convert lipophilic → polar metabolites
PHASE II REACTIONS (Conjugation)
Glucuronidation (UGT enzymes)
Sulfation
Acetylation
Glutathione conjugation
Methylation
→ Water-soluble compounds → excreted in bile/urine
Hippuric acid test:
- Benzoic acid → conjugated with glycine → hippuric acid
- Normal: ≥ 3 g hippuric acid excreted after 6 g sodium benzoate
4. Normal Serum Bilirubin & Significance
| Type | Normal Range | Significance if Elevated |
|---|---|---|
| Total bilirubin | 0.2–1.2 mg/dL | > 2.5 mg/dL = clinical jaundice |
| Direct (conjugated) | 0.0–0.4 mg/dL | Obstructive/hepatic jaundice |
| Indirect (unconjugated) | 0.2–0.8 mg/dL | Hemolytic jaundice, Gilbert's |
Van den Bergh Reaction:
- Direct (immediate): conjugated bilirubin reacts without alcohol → hepatic/obstructive jaundice
- Indirect: requires methanol addition → unconjugated bilirubin → hemolytic jaundice
- Biphasic: mixed type jaundice
5. Bile Salts and Bile Pigments
Bile Salts:
| Bile Salt | Primary/Secondary | Conjugated With |
|---|---|---|
| Cholic acid | Primary | Glycine or Taurine |
| Chenodeoxycholic acid | Primary | Glycine or Taurine |
| Deoxycholic acid | Secondary (gut bacteria) | Glycine or Taurine |
| Lithocholic acid | Secondary | Glycine or Taurine |
Functions: Emulsification of fats, activation of lipase, fat absorption, cholesterol solubilization.
Bile Pigments:
- Bilirubin (yellow-orange): Heme degradation product
- Biliverdin (green): Oxidized bilirubin
- Stercobilin (brown): In feces
- Urobilinogen/Urobilin: In urine
Bile Pigment Pathway:
Hemoglobin (RBC breakdown)
↓ (Reticuloendothelial system)
Biliverdin → Bilirubin (unconjugated/indirect)
↓ (bound to albumin → liver)
Conjugated bilirubin (glucuronide) [direct]
↓ (excreted in bile)
Urobilinogen (small intestine)
↓ ↓
Stercobilin Urobilin (urine)
(feces - brown)
6. Tests for Hepatic Dysfunction
| Test | Normal Value | Elevated in |
|---|---|---|
| SGPT (ALT) | 7–40 U/L | Hepatocellular damage |
| SGOT (AST) | 10–40 U/L | Hepatic & cardiac damage |
| ALP | 40–130 U/L | Cholestasis, bone disease |
| GGT | 8–61 U/L | Liver disease, alcohol |
| LDH | 100–190 U/L | Multiple organ damage |
7. Significance of SGOT & SGPT
SGPT (Serum Glutamate Pyruvate Transaminase / ALT):
- Enzyme catalyzes: Alanine + α-ketoglutarate → Pyruvate + Glutamate
- Liver specific — highly elevated in hepatocellular damage
- Normal: 7–40 U/L
SGOT (Serum Glutamate Oxaloacetate Transaminase / AST):
- Enzyme catalyzes: Aspartate + α-ketoglutarate → Oxaloacetate + Glutamate
- Present in liver, heart, muscle, kidney
- Normal: 10–40 U/L
AST:ALT (De Ritis Ratio):
| Ratio | Interpretation |
|---|---|
| > 2:1 | Alcoholic liver disease |
| < 1 | Viral hepatitis |
| 1–1.5 | Other liver diseases |
Principle of SGPT/SGOT assay (Reitman-Frankel method):
- SGPT: ALT transfers amino group from alanine to α-ketoglutarate → pyruvate
- Pyruvate reacts with 2,4-dinitrophenylhydrazine → brown color measured at 505 nm
- Compared to standard pyruvate curve for quantification
8. Physiology of Liver
| Function | Details |
|---|---|
| Carbohydrate metabolism | Glycogenesis, glycogenolysis, gluconeogenesis |
| Protein metabolism | Albumin, globulins, clotting factors (I, II, V, VII, IX, X) |
| Lipid metabolism | Cholesterol synthesis, lipoprotein synthesis, ketogenesis, bile acid synthesis |
| Detoxification | Phase I/II metabolism; urea synthesis (ammonia detox) |
| Storage | Glycogen, vitamin B₁₂, A, D, E, K, Fe |
| Bile production | 600–1200 mL/day |
| Immune function | Kupffer cells |
9. Tests Based on Serum Protein Abnormality
| Test | Basis | Significance |
|---|---|---|
| Serum albumin | Synthesized by liver | Low in hepatic failure |
| A:G ratio | Albumin:Globulin | Reversed in cirrhosis (normal 1.5–2.5:1) |
| Prothrombin time | Vit K–dependent factors | Prolonged in liver damage |
| Thymol turbidity test | Serum protein flocculation | Abnormal in hepatitis |
| Cephalin cholesterol flocculation | Protein–lipid interaction | Hepatocellular disease |
| Zinc sulfate turbidity | Gamma-globulin measurement | Chronic liver disease |
Long Answer Questions (15 marks)
Q1. Different Liver Function Tests — Excretory Function
Classification of LFT
LIVER FUNCTION TESTS
│
├── 1. EXCRETORY FUNCTION TESTS
│ ├── Serum bilirubin (direct, indirect, total)
│ ├── Urine bilirubin (Fouchet's test)
│ ├── Urobilinogen (Ehrlich's test)
│ └── BSP excretion test
│
├── 2. METABOLIC FUNCTION TESTS
│ ├── a) PROTEIN METABOLISM
│ │ ├── Serum albumin
│ │ ├── Serum globulin / A:G ratio
│ │ ├── Prothrombin time
│ │ └── Serum fibrinogen
│ ├── b) CARBOHYDRATE METABOLISM
│ │ └── Galactose tolerance test
│ └── c) LIPID METABOLISM
│ └── Serum cholesterol
│
├── 3. ENZYME TESTS
│ ├── SGPT (ALT) — hepatocellular
│ ├── SGOT (AST) — hepatocellular + cardiac
│ ├── ALP (Alkaline Phosphatase) — cholestasis
│ ├── GGT — biliary obstruction/alcohol
│ └── 5'-Nucleotidase
│
└── 4. SPECIAL TESTS
├── Hippuric acid synthesis (detoxification)
└── Serum bile acids
Bilirubin Metabolism & van den Bergh Test:
| Type of Jaundice | Direct | Indirect | Urine Bilirubin | Urobilinogen |
|---|---|---|---|---|
| Pre-hepatic (hemolytic) | N | ↑↑ | Absent | ↑↑ |
| Hepatic (hepatocellular) | ↑ | ↑ | Present | Variable |
| Post-hepatic (obstructive) | ↑↑ | N | Present ↑↑ | Absent |
Q2. SGPT & SGOT Determination — Principle & Significance
Principle (Reitman-Frankel Method):
SGPT (ALT):
L-Alanine + α-Ketoglutarate ──ALT──→ Pyruvate + L-Glutamate
Pyruvate + 2,4-DNPH ──→ Pyruvate hydrazone (brown color)
Measured at 505 nm
SGOT (AST):
L-Aspartate + α-Ketoglutarate ──AST──→ Oxaloacetate + L-Glutamate
Oxaloacetate + 2,4-DNPH ──→ Oxaloacetate hydrazone (brown color)
Measured at 505 nm
| Feature | SGPT (ALT) | SGOT (AST) |
|---|---|---|
| Location | Liver (cytosol mainly) | Liver, heart, muscle, kidney |
| Specificity | Liver-specific | Less specific |
| Normal | 7–40 U/L | 10–40 U/L |
| Elevated in | Viral hepatitis, drug toxicity | MI, hepatitis, muscle disease |
| Peak elevation | 7–10× in hepatitis | 10× in hepatitis; 100× in MI |
Q3. Hepatic Dysfunction Tests — Bile Salts & Pigments
Tests for Hepatic Dysfunction:
| Category | Test | Elevated/Abnormal in |
|---|---|---|
| Cholestasis | ALP, GGT, bilirubin (direct) | Bile duct obstruction |
| Hepatocellular | ALT, AST, LDH | Hepatitis, cirrhosis |
| Synthetic | Albumin, PT, fibrinogen | Chronic liver failure |
| Detoxification | Hippuric acid test, NH₃ | Liver failure |
Detection of Bile Salts (Hay's Sulfur Test):
- Sulfur powder sprinkled on urine surface
- Positive: sulfur sinks (↑ surface tension due to bile salts)
- Negative: sulfur floats
Detection of Bile Pigments:
- Fouchet's test: Barium chloride precipitates bilirubin; add Fouchet's reagent → green color (biliverdin)
- Gmelin's test (foam test): Urine is shaken → yellow-green foam = bile pigments present
Q4. Metabolic & Detoxification Capacity of Liver
Metabolic functions:
| Substrate | Liver Process | Key Products |
|---|---|---|
| Glucose | Glycogenesis ↔ Glycogenolysis | Glycogen, glucose |
| Amino acids | Transamination, deamination, urea cycle | Proteins, urea |
| Fatty acids | β-oxidation, ketogenesis, esterification | Ketones, VLDL |
| Cholesterol | Synthesis, bile acid conversion | Bile acids |
| Ammonia | Urea cycle | Urea → excreted by kidney |
Urea Cycle (Detoxification of Ammonia):
NH₃ → Carbamoyl phosphate → Citrulline → Argininosuccinate
↓
Arginine → Urea (excreted)
UNIT IX — Lipid Profile Tests
Very Short Answer Questions (2 marks)
1. List the Lipid Profile Tests (LPT)
| Test | Normal Value |
|---|---|
| Total Cholesterol | < 200 mg/dL (desirable) |
| Triglycerides (TG) | < 150 mg/dL |
| HDL Cholesterol | ≥ 60 mg/dL (protective) |
| LDL Cholesterol | < 100 mg/dL (optimal) |
| VLDL Cholesterol | 7–32 mg/dL |
| Total Cholesterol/HDL ratio | < 5 |
| Non-HDL Cholesterol | < 130 mg/dL |
2. Differences between RTA and ELISA
| Feature | RTA (Radio Turbo Agglutination / RIA) | ELISA |
|---|---|---|
| Label used | Radioactive isotope (¹²⁵I, ³H) | Enzyme (HRP, ALP) |
| Detection | Scintillation counter (gamma counter) | Colorimetry, fluorimetry |
| Safety | Radiation hazard | No radiation hazard |
| Sensitivity | Very high | High (comparable) |
| Equipment | Gamma counter required | Spectrophotometer/ELISA reader |
| Shelf-life of reagents | Short (radioactive decay) | Longer |
| Cost | Expensive | Less expensive |
| Waste disposal | Special radioactive waste | Simple disposal |
3. Differentiate Triglycerides and Lipoproteins
| Feature | Triglycerides | Lipoproteins |
|---|---|---|
| Nature | Simple lipids (glycerol + 3 fatty acids) | Complex particles (lipid + protein) |
| Structure | Ester bonds | Amphipathic particle (core: CE, TG; shell: phospholipid, apo) |
| Function | Energy storage | Lipid transport in blood |
| Location | Adipose tissue, liver, blood | Blood plasma |
| Normal blood level | < 150 mg/dL | HDL > 60, LDL < 100 mg/dL |
| Raised in | Obesity, DM, alcohol | Dyslipidemia, hypothyroidism |
4. Principle of Cholesterol Estimation in Serum
Liebermann-Burchard Method:
- Cholesterol reacts with acetic anhydride + H₂SO₄ → emerald green color
- Measured at 620 nm
- Color intensity ∝ cholesterol concentration
Enzymatic Method (Trinder's):
Cholesterol esters ─(CE)→ Cholesterol + Fatty acids
Cholesterol ─(ChOD)→ Cholest-4-en-3-one + H₂O₂
H₂O₂ + 4-AAP + Phenol ─(POD)→ Red quinone chromogen
Measured at 500 nm
5. HDL and LDL
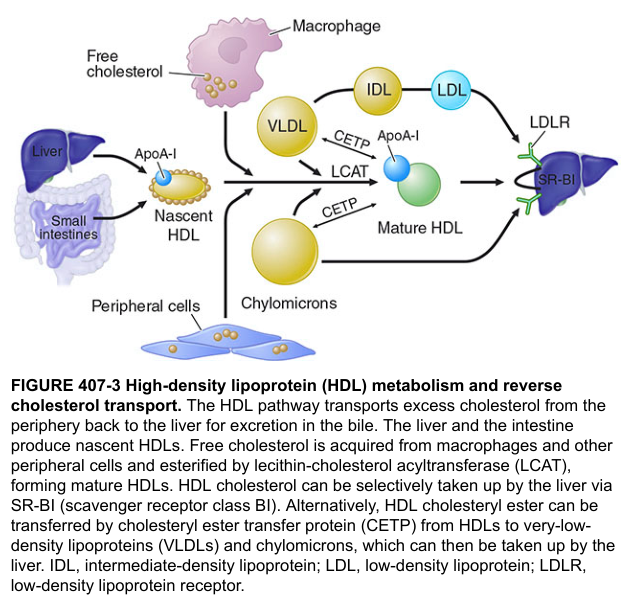
| Feature | HDL | LDL |
|---|---|---|
| Full name | High-density lipoprotein | Low-density lipoprotein |
| Density | 1.063–1.21 g/mL | 1.019–1.063 g/mL |
| Size | Smallest | Small-medium |
| Main apoprotein | ApoA-I, ApoA-II | ApoB-100 |
| % Protein | 45–55% | 20–25% |
| Function | Reverse cholesterol transport (RCT) | Delivers cholesterol to tissues |
| Cardiac risk | Protective (↑ HDL = ↓ risk) | Risk factor (↑ LDL = ↑ risk) |
| Normal level | ≥ 60 mg/dL (M), ≥ 50 (F) | < 100 mg/dL optimal |
6. Significance of Lipid Profiling
- Cardiovascular risk assessment — elevated LDL and total cholesterol increase MI/stroke risk
- Screening — detects dyslipidemia in asymptomatic individuals
- Monitoring — tracks response to statins and other lipid-lowering therapy
- Diagnosis — confirms metabolic syndrome (hypertriglyceridemia + low HDL)
- Drug dosing — guides statin therapy intensity
7. RTA — Definition and Significance
RTA (Radio-immunoTurbidimetric Assay / or Radioimmunoassay):
RIA (Radioimmunoassay) was developed by Berson and Yalow (1959) — Nobel Prize 1977.
Principle:
Fixed amount of Ag + Labeled Ag* + Ab
↓
Competition between Ag and Ag* for limited Ab
↓
Separate Ab-bound from free fractions
↓
Count radioactivity (gamma counter)
↓
↑ Unlabeled Ag → ↓ bound Ag* radioactivity
Significance:
- Measures hormones (insulin, T3/T4, LH, FSH)
- Detects drugs of abuse
- Tumor markers (AFP, PSA)
- Extremely high sensitivity (picogram level)
- Used in lipid profile to measure apolipoproteins
8. ELISA — Definition and Significance
ELISA (Enzyme-Linked Immunosorbent Assay):
Types:
| Type | Principle | Use |
|---|---|---|
| Direct ELISA | Antigen coated → detected by enzyme-labeled Ab | Quick screening |
| Indirect ELISA | Antigen → primary Ab → enzyme-labeled secondary Ab | HIV antibody test |
| Sandwich ELISA | Capture Ab → Antigen → detection Ab (enzyme) | Most sensitive; quantitative |
| Competitive ELISA | Sample Ag competes with labeled Ag for Ab | Haptens, hormones |
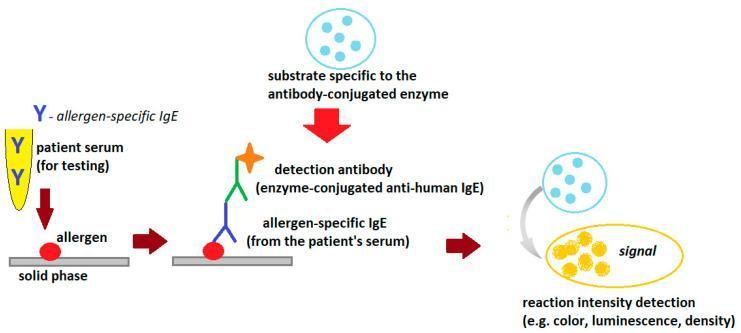
Procedure (Sandwich ELISA):
- Coat microplate wells with capture antibody
- Block with BSA
- Add patient sample (antigen binds)
- Wash unbound antigen
- Add enzyme-labeled detection antibody
- Wash unbound Ab
- Add substrate (TMB) → color develops
- Add stop solution → read OD at 450 nm
Significance:
- Diagnosis of HIV, hepatitis B/C, dengue, COVID-19
- Hormone measurement (insulin, TSH, hCG)
- Drug detection
- Tumor markers
- Serology for autoimmune diseases
9. Functions of Lipoproteins
| Lipoprotein | Origin | Function |
|---|---|---|
| Chylomicrons | Intestine | Transport dietary (exogenous) TG and cholesterol from gut → liver/tissues |
| VLDL | Liver | Transport endogenous TG from liver → peripheral tissues |
| IDL | VLDL remnant | Intermediate; taken up by liver or converted to LDL |
| LDL | IDL | Deliver cholesterol to peripheral tissues via LDL receptor |
| HDL | Liver + intestine | Reverse cholesterol transport (peripheral tissues → liver) |
Lipoprotein Classification:
| Class | Density (g/mL) | Size (nm) | % Protein | Main Lipid | Main Apo |
|---|---|---|---|---|---|
| Chylomicron | < 0.95 | 80–500 | 1–2% | TG (85%) | ApoB-48 |
| VLDL | 0.95–1.006 | 30–80 | 10% | TG (55%) | ApoB-100 |
| IDL | 1.006–1.019 | 25–35 | 18% | TG+CE | ApoB-100, ApoE |
| LDL | 1.019–1.063 | 20–25 | 25% | CE (45%) | ApoB-100 |
| HDL | 1.063–1.21 | 7–12 | 50% | CE+PL | ApoA-I |
(Source: Basic Medical Biochemistry, 6e — TABLE V.1)
Long Answer / Short Answer Type (5 marks)
Importance of Phospholipids & Physiological Role
| Phospholipid | Structure | Physiological Role |
|---|---|---|
| Lecithin (PC) | Glycerol + 2 FA + phosphate + choline | Cell membrane structure; lung surfactant (DPPC) |
| Cephalin (PE) | Glycerol + 2 FA + phosphate + ethanolamine | Brain myelin; blood coagulation |
| Sphingomyelin | Sphingosine + FA + phosphocholine | Myelin sheath; nerve conduction |
| Phosphatidylserine | Glycerol + 2 FA + phosphate + serine | Apoptosis signal; brain function |
| Cardiolipin | Inner mitochondrial membrane | Electron transport chain |
Roles:
- Major structural component of all cell membranes (bilayer)
- Lung surfactant (lecithin — prevents alveolar collapse)
- Second messengers (PIP₂ → IP₃ + DAG)
- Myelin sheath formation (nerve insulation)
- Blood coagulation (cephalin in thromboplastin)
- Emulsification of lipids in bile
How to Determine Total Cholesterol in Serum
Enzymatic Method (WHO Recommended):
Step 1: Cholesterol ester + H₂O ──CE hydrolase──→ Free cholesterol + FA
Step 2: Free cholesterol + O₂ ──Cholesterol oxidase──→ Cholest-4-en-3-one + H₂O₂
Step 3: 2H₂O₂ + 4-aminoantipyrine + phenol ──Peroxidase──→
Quinoneimine (red/pink color) + 4H₂O
Step 4: Measure absorbance at 500–546 nm
Compare with cholesterol standard
Risk Classification (NCEP ATP III):
| Total Cholesterol | Classification |
|---|---|
| < 200 mg/dL | Desirable |
| 200–239 mg/dL | Borderline high |
| ≥ 240 mg/dL | High |
UNIT X — Electrolytes
Very Short Answer Questions (2 marks)
1. How is Sodium Level Determined in Body Fluids?
Method: Flame Photometry
- Serum specimen aspirated and atomized in a flame
- Sodium emits characteristic yellow light at 589 nm
- Intensity measured by photodetector ∝ Na⁺ concentration
- Compared against standard solutions (internal standard: lithium)
ISE (Ion-Selective Electrode): Modern method — Na⁺ specific electrode; most accurate.
Normal serum sodium: 135–145 mEq/L (mmol/L)
2. How is Calcium Level Determined in Body Fluids?
Methods:
| Method | Principle | Notes |
|---|---|---|
| OCPC method | o-Cresolphthalein Complexone + Ca²⁺ → purple complex at 570–590 nm | Most common |
| Atomic absorption spectrophotometry | Calcium absorbs light at 422.7 nm | Gold standard |
| Flame photometry | Ca²⁺ emits light at 622 nm | Less sensitive |
| ISE | Calcium-selective electrode | Used in blood gas analyzers |
Normal serum calcium: 8.5–10.5 mg/dL (2.12–2.62 mmol/L)
3. Define Hyperkalemia
Hyperkalemia: Serum potassium > 5.5 mEq/L
| Severity | K⁺ Level | Clinical Features |
|---|---|---|
| Mild | 5.5–6.0 | Weakness, fatigue |
| Moderate | 6.0–7.0 | Paresthesia, ECG changes (peaked T waves) |
| Severe | > 7.0 | Arrhythmia, cardiac arrest |
ECG Changes in Hyperkalemia:
K⁺ 5.5–6.5 → Tall, peaked T waves
K⁺ 6.5–7.5 → Prolonged PR, wide QRS
K⁺ > 7.5 → Sine wave pattern → VF → asystole
Causes: Renal failure, Addison's disease, acidosis, cell lysis (hemolysis), ACE inhibitors, potassium-sparing diuretics.
4. Define Hyponatremia
Hyponatremia: Serum sodium < 135 mEq/L
| Type | Osmolality | Volume Status | Cause |
|---|---|---|---|
| Hypovolemic | Low | Low | Vomiting, diarrhea, diuretics |
| Euvolemic | Low | Normal | SIADH, hypothyroidism |
| Hypervolemic | Low | High | CHF, cirrhosis, nephrotic syndrome |
Symptoms: Nausea, headache, confusion, seizures (when Na⁺ < 120 mEq/L), coma.
5. Composition of ORS
WHO ORS (2002 — Reduced Osmolarity ORS):
| Component | Amount per Litre |
|---|---|
| Sodium chloride | 2.6 g |
| Glucose (anhydrous) | 13.5 g |
| Potassium chloride | 1.5 g |
| Trisodium citrate | 2.9 g |
| Total osmolarity | 245 mOsm/L |
| Electrolyte | Concentration (mEq/L) |
|---|---|
| Na⁺ | 75 |
| K⁺ | 20 |
| Cl⁻ | 65 |
| Citrate | 10 |
| Glucose | 75 mmol/L |
Use: Oral rehydration therapy for diarrhea/cholera. Glucose co-transports Na⁺ via SGLT1 in intestine.
6. Fluid Compartments in Blood
TOTAL BODY WATER (TBW) = 60% of body weight (42 L in 70 kg person)
│
├── INTRACELLULAR FLUID (ICF) = 40% BW = 28 L
│ • Major cation: K⁺ (140 mEq/L)
│ • Major anion: Phosphate, protein
│
└── EXTRACELLULAR FLUID (ECF) = 20% BW = 14 L
├── Intravascular (Plasma) = 3.5 L
│ • Major cation: Na⁺ (140 mEq/L)
│ • Major anion: Cl⁻, HCO₃⁻
└── Interstitial fluid = 10.5 L
• Transudate of plasma (no proteins)
7. Role of Kidney in Water Balance
The kidney regulates water balance through:
- Countercurrent multiplication (Loop of Henle) — creates osmotic gradient
- ADH (Antidiuretic hormone): Released when plasma osmolality ↑ → ↑ water permeability of collecting duct → concentrated urine
- Osmoreceptors in hypothalamus sense osmolality changes
- Aquaporin-2 channels — ADH inserts these water channels in collecting duct
↑ Plasma osmolality or ↓ Blood volume
↓
↑ ADH secretion (posterior pituitary)
↓
↑ AQP-2 in collecting duct
↓
↑ Water reabsorption
↓
↓ Urine output + ↓ Plasma osmolality
8. Aldosterone & Osmolality Regulation
Aldosterone (mineralocorticoid — adrenal cortex):
Actions:
- ↑ Na⁺ reabsorption (principal cells of distal tubule/collecting duct)
- ↑ K⁺ and H⁺ excretion
- Net effect: ↑ ECF volume, ↑ blood pressure
Regulation (RAAS):
↓ Blood pressure / ↓ Na⁺ / ↑ K⁺
↓
↑ Renin (juxtaglomerular cells)
↓
Angiotensinogen → Angiotensin I (ACE) → Angiotensin II
↓
↑ Aldosterone secretion (adrenal cortex)
↓
↑ Na⁺ reabsorption → ↑ ECF volume → ↑ BP
Osmolality Regulation:
- Serum osmolality = 2[Na⁺] + Glucose/18 + BUN/2.8
- Normal: 280–295 mOsm/kg
9. Causes of Water Depletion in Body
| Category | Cause |
|---|---|
| ↓ Water intake | Unconscious patient, dysphagia, no access to water |
| ↑ Water loss — Renal | Diabetes insipidus, osmotic diuresis, diuretics |
| ↑ Water loss — GI | Vomiting, diarrhea, nasogastric suction |
| ↑ Water loss — Skin | Burns, fever, excessive sweating |
| ↑ Water loss — Respiratory | Hyperventilation, mechanical ventilation |
10. Clinical Disorders Associated with Water Depletion & Water Accumulation
| Disorder | Type | Cause | Key Features |
|---|---|---|---|
| Dehydration | ↓ Water | Diarrhea, vomiting, DI | ↑ Osmolality, ↑ Hematocrit, ↑ Na⁺ |
| Hypernatremia | ↑ Na⁺ | Free water loss > Na loss | Serum Na > 145 mEq/L; brain shrinkage |
| Edema | ↑ Water (ECF) | CHF, liver cirrhosis, nephrotic | Pitting edema, ascites |
| SIADH | ↑ Water (euvolemic) | Excess ADH | ↓ Na⁺, ↓ osmolality, concentrated urine |
| Water intoxication | ↑ TBW | Excess hypotonic IV fluids | Hyponatremia, brain swelling |
Define Acidosis and Alkalosis
| Condition | pH | Cause | Compensation |
|---|---|---|---|
| Metabolic acidosis | < 7.35 | ↑ H⁺ or ↓ HCO₃⁻ (DKA, diarrhea, renal failure) | Hyperventilation (↓ PCO₂) |
| Respiratory acidosis | < 7.35 | ↑ PCO₂ (hypoventilation, COPD) | ↑ HCO₃⁻ (kidney) |
| Metabolic alkalosis | > 7.45 | ↓ H⁺ or ↑ HCO₃⁻ (vomiting, antacids) | Hypoventilation (↑ PCO₂) |
| Respiratory alkalosis | > 7.45 | ↓ PCO₂ (hyperventilation, anxiety) | ↓ HCO₃⁻ (kidney) |
Henderson-Hasselbalch:
$$pH = pKa + \log\frac{[HCO_3^-]}{0.03 \times PCO_2}$$
Short Answer Questions (5 marks)
Q1. How is Chloride Determined in Body Fluids?
Methods:
- Schales & Schales method: Mercuric nitrate titration; endpoint detected by diphenyl carbazone (blue-violet)
- Amperometric titration: Silver ions react with Cl⁻ → AgCl precipitate
- ISE: Chloride-selective electrode (automated analyzers)
- Cotlove chloridometer: Coulometric titration (silver ions generated)
Normal values: Serum Cl⁻ = 96–106 mEq/L; Urine Cl⁻ = 110–250 mmol/day
Q2. Fluid Compartments — Types and Functions
| Compartment | Volume | Main Electrolytes | Functions |
|---|---|---|---|
| ICF | 28 L (40% BW) | K⁺, Mg²⁺, HPO₄²⁻ | Metabolic reactions; enzyme activity |
| Plasma (IVF) | 3.5 L (5% BW) | Na⁺, Cl⁻, HCO₃⁻, proteins | O₂/CO₂ transport; pressure regulation |
| Interstitial | 10.5 L (15% BW) | Na⁺, Cl⁻ (no protein) | Nutrient/waste exchange between blood & cells |
| Transcellular | 1–2 L | Variable | CSF, synovial, pleural, peritoneal fluids |
Measurement of fluid compartments:
- TBW: Deuterium oxide (D₂O) or tritium dilution
- ECF: Inulin, mannitol, sodium thiosulfate dilution
- Plasma volume: Evans blue (T-1824) or albumin-I¹³¹
Q3. Determination of Sodium in Body Fluids
Flame Photometry (most used):
Principle:
Serum Na⁺ → atomized in propane/air flame
Na atoms excited → emit yellow light (589 nm)
Photocell measures intensity
Compare with Na⁺ standard curve
Internal standard (Li⁺): Lithium added to all samples; corrects for variations in flow/flame.
Calibration graph:
Emission Intensity (589 nm)
↑
| /
| /
| /
| /
| /
| /
└──────────────→
[Na⁺] concentration (mEq/L)
Linear range: 0–200 mEq/L
ISE method: Nernst equation:
$$E = E_0 + \frac{RT}{nF} \ln[Na^+]$$
Q4. Hypokalemia and Hypernatremia
Hypokalemia (K⁺ < 3.5 mEq/L):
| Cause | Mechanism |
|---|---|
| Diarrhea/vomiting | GI loss |
| Diuretics (loop, thiazide) | Renal K⁺ wasting |
| Hyperaldosteronism | ↑ K⁺ excretion |
| Alkalosis | K⁺ shifts into cells |
| Poor intake | Malnutrition |
Clinical features: Muscle weakness, cramps, paralysis, arrhythmias, ECG: U waves, flat T waves
Hypernatremia (Na⁺ > 145 mEq/L):
| Cause | Example |
|---|---|
| Free water loss | Diabetes insipidus, fever |
| Hypertonic Na⁺ gain | Excessive NaCl, NaHCO₃ infusion |
| GI water loss | Osmotic diarrhea |
Symptoms: Thirst, lethargy, confusion, seizures (severe), brain hemorrhage
All four units are now fully covered. Here's a quick reference summary of what was answered:
📋 Coverage Summary
| Unit | Topics Covered | Marks Level |
|---|---|---|
| VII — Clinical Chemistry | Semiquantitative urine analysis, urine concentration test, creatinine clearance, urinary calculi, urea clearance, normal/abnormal urine constituents, NPN tests (Jaffe, diacetyl, urease methods), kidney functions, clinical lab role, KFT classification with diagram | 2, 5, 15 |
| VIII — Liver Function Tests | Bile salts (Hay's test) & bile pigments (Fouchet, Gmelin), bilirubin types & van den Bergh reaction, jaundice differentiation table, SGPT/SGOT (Reitman-Frankel method), De Ritis ratio, hepatic dysfunction tests, liver physiology, serum protein tests (albumin, PT, A:G ratio), detoxification (Phase I/II, hippuric acid, urea cycle) | 2, 5, 15 |
| IX — Lipid Profile | LPT tests & normal values, lipoproteins table (Chylomicron→HDL), HDL vs LDL comparison, cholesterol estimation (Liebermann-Burchard + enzymatic Trinder method), phospholipids & functions, triglycerides vs lipoproteins, RIA vs ELISA comparison, ELISA types & procedure with diagram, significance of lipid profiling | 2, 5, 15 |
| X — Electrolytes | Flame photometry for Na⁺ (589 nm), OCPC for Ca²⁺, hyperkalemia ECG changes, hyponatremia types, ORS composition (WHO 2002), TBW compartments diagram (ICF/ECF), ADH-kidney water balance, RAAS-aldosterone-osmolality, causes of water depletion, acidosis/alkalosis table, chloride methods, Henderson-Hasselbalch | 2, 5, 15 |
Key diagrams/images included:
- Nephron anatomy (Harrison's textbook)
- HDL reverse cholesterol transport (Harrison's)
- ELISA indirect method diagram
- ASCII pathway diagrams for bilirubin metabolism, RAAS, kidney filtration, urea cycle, cholesterol enzymatic assay, ECF/ICF compartments
This is a shared conversation. Sign in to Orris to start your own chat.