
Teach me ecg from basic to pro level
Reading File
ECG interpretation is a fundamental clinical skill. Here's a quick orientation while I pull detailed content from medical textbooks:
- The ECG records electrical activity of the heart across 12 leads, each viewing the heart from a different angle
- A systematic approach (rate, rhythm, axis, intervals, morphology) prevents missed findings
- Common patterns range from normal sinus rhythm to life-threatening arrhythmias like VF and STEMI
Searching sources...
Finding Sources
Finding Sources
Finding Sources
Finding Sources
Reading File
Reading File
Finding Sources
Reading File
Finding Sources
Finding Sources
Finding Sources
Finding Sources
Reading File
Reading File
Loading Image
Reading File
Loading Image
Loading Image
Reading File
I now have excellent content from Harrison's (22nd Ed), Costanzo Physiology, and Tintinalli's Emergency Medicine. Let me compile the comprehensive ECG guide.
ECG Interpretation: Basic to Advanced
Sources: Harrison's Principles of Internal Medicine 22E, Costanzo Physiology 7th Ed, Tintinalli's Emergency Medicine, Braunwald's Heart Disease
PART 1 - THE BASICS: What Is an ECG?
The ECG (electrocardiogram) measures tiny electrical potential differences on the body surface that reflect the sequence of depolarization and repolarization spreading through the heart. Because different parts of the heart depolarize at different times - atria before ventricles, in specific sequences - voltage gradients are created that can be detected by surface electrodes.
- Costanzo Physiology 7th Ed, p. 149
PART 2 - THE ECG PAPER
The standard ECG is printed on graph paper with two grid sizes:
| Grid | Time | Voltage |
|---|---|---|
| Small box | 0.04 s (40 ms) | 0.1 mV |
| Large box (5 small boxes) | 0.20 s (200 ms) | 0.5 mV |
Paper speed: 25 mm/s (standard). Each large box = 0.2 seconds. 5 large boxes = 1 second.
PART 3 - THE WAVEFORMS

Fig. Normal ECG from Lead II showing all labeled waves and intervals - Costanzo Physiology 7E
| Wave/Segment | What It Represents |
|---|---|
| P wave | Atrial depolarization |
| PR interval | Atrial depolarization + AV node conduction (start of P to start of QRS) |
| QRS complex | Ventricular depolarization |
| ST segment | Isoelectric period = plateau of ventricular action potential |
| T wave | Ventricular repolarization |
| QT interval | Total ventricular electrical activity (QRS + ST + T) |
Key normal values:
- P wave duration: < 120 ms (< 3 small boxes)
- PR interval: 120-200 ms (3-5 small boxes)
- QRS duration: < 120 ms (< 3 small boxes)
- QT interval (corrected/QTc): < 440 ms men, < 460 ms women
- Normal PR: ~160 ms; shortened by sympathetic stimulation, lengthened by parasympathetic
Why does QRS duration equal P wave duration despite larger ventricles? Because the His-Purkinje system conducts far faster than the atrial conducting system, so the ventricles depolarize just as quickly.
PART 4 - THE 12 LEADS
The 12 leads view the heart from 12 different angles, grouped as:
Limb Leads (Frontal Plane)
| Lead | View |
|---|---|
| Lead I | Left side of heart (left arm positive) |
| Lead II | Inferior-left (left foot positive) |
| Lead III | Inferior-right (left foot positive vs right arm) |
| aVR | Right shoulder (inverted) |
| aVL | Left shoulder |
| aVF | Inferior (foot) |
Precordial/Chest Leads (Horizontal Plane)
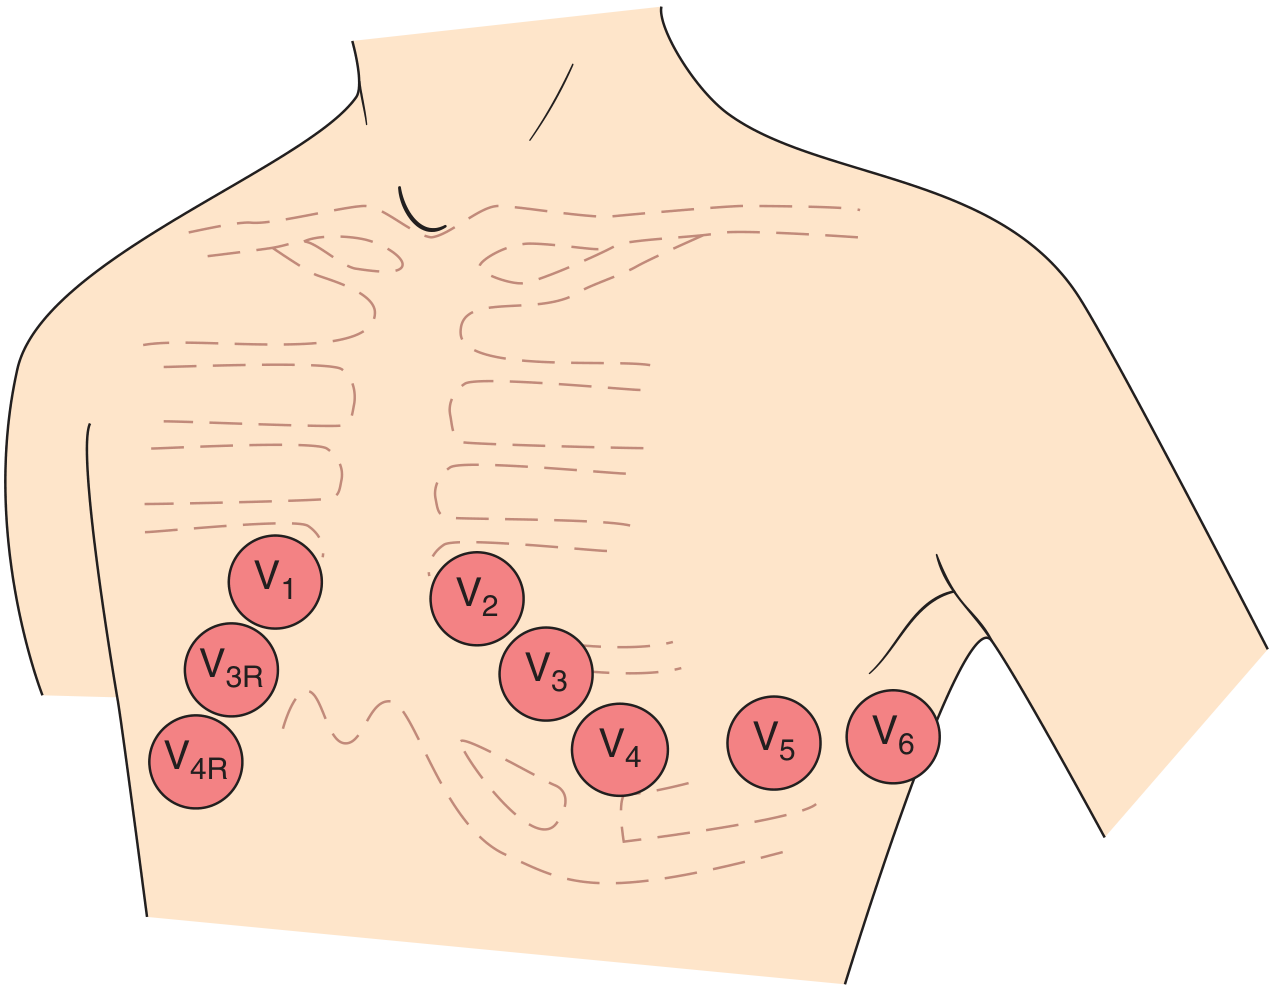
Fig. Precordial lead positions - Harrison's 22E
| Lead | Position | View |
|---|---|---|
| V1 | 4th intercostal space, right sternal border | Right ventricle |
| V2 | 4th intercostal space, left sternal border | Septum |
| V3 | Between V2 and V4 | Anterior wall |
| V4 | 5th intercostal space, midclavicular line | Anterior wall |
| V5 | Anterior axillary line (same level as V4) | Lateral wall |
| V6 | Midaxillary line (same level as V4) | Lateral wall |
Regional Groupings for Ischemia Localization
- Inferior wall: II, III, aVF
- Anterior wall: V1-V4
- Lateral wall: I, aVL, V5-V6
- Right ventricle: right-sided leads V3R-V6R
PART 5 - A SYSTEMATIC APPROACH (THE GOLDEN METHOD)
Never interpret an ECG randomly. Always use this order:
1. Rate
- Fast method: Count large boxes between two R waves. Divide 300 by that number.
- 1 box = 300 bpm; 2 = 150; 3 = 100; 4 = 75; 5 = 60; 6 = 50
- Precise method: Heart rate = 1 / R-R interval (in seconds) x 60
- Normal: 60-100 bpm; Bradycardia: < 60; Tachycardia: > 100
2. Rhythm
- Is there a P wave before every QRS? Is there a QRS after every P?
- Are P waves regular? Are R-R intervals equal?
- Normal sinus rhythm = regular P waves with consistent PR interval, followed by QRS
3. Axis
Normal QRS axis: -30° to +100°
| Axis | Leads I & aVF |
|---|---|
| Normal | Both positive |
| Left axis deviation (< -30°) | I positive, aVF negative |
| Right axis deviation (> +100°) | I negative, aVF positive |
| Extreme axis (no man's land) | Both negative |
Left axis deviation causes: left anterior fascicular block, inferior MI, LVH
Right axis deviation causes: RVH, left posterior fascicular block, lateral MI, pulmonary hypertension
4. Intervals
- PR interval - prolonged (> 200 ms) = heart block
- QRS duration - widened (> 120 ms) = bundle branch block or ventricular origin
- QT interval - QTc > 440-460 ms = risk of torsades de pointes
5. P wave morphology
- Peaked in II: right atrial enlargement (P pulmonale)
- Biphasic/notched in V1: left atrial enlargement (P mitrale)
6. QRS morphology
- R-wave progression across V1-V6
- Abnormal Q waves (> 40 ms wide or > 1/4 QRS height = pathological)
7. ST segment & T waves
- ST elevation or depression
- T wave inversions, hyperacute T waves
PART 6 - NORMAL ECG EXAMPLE
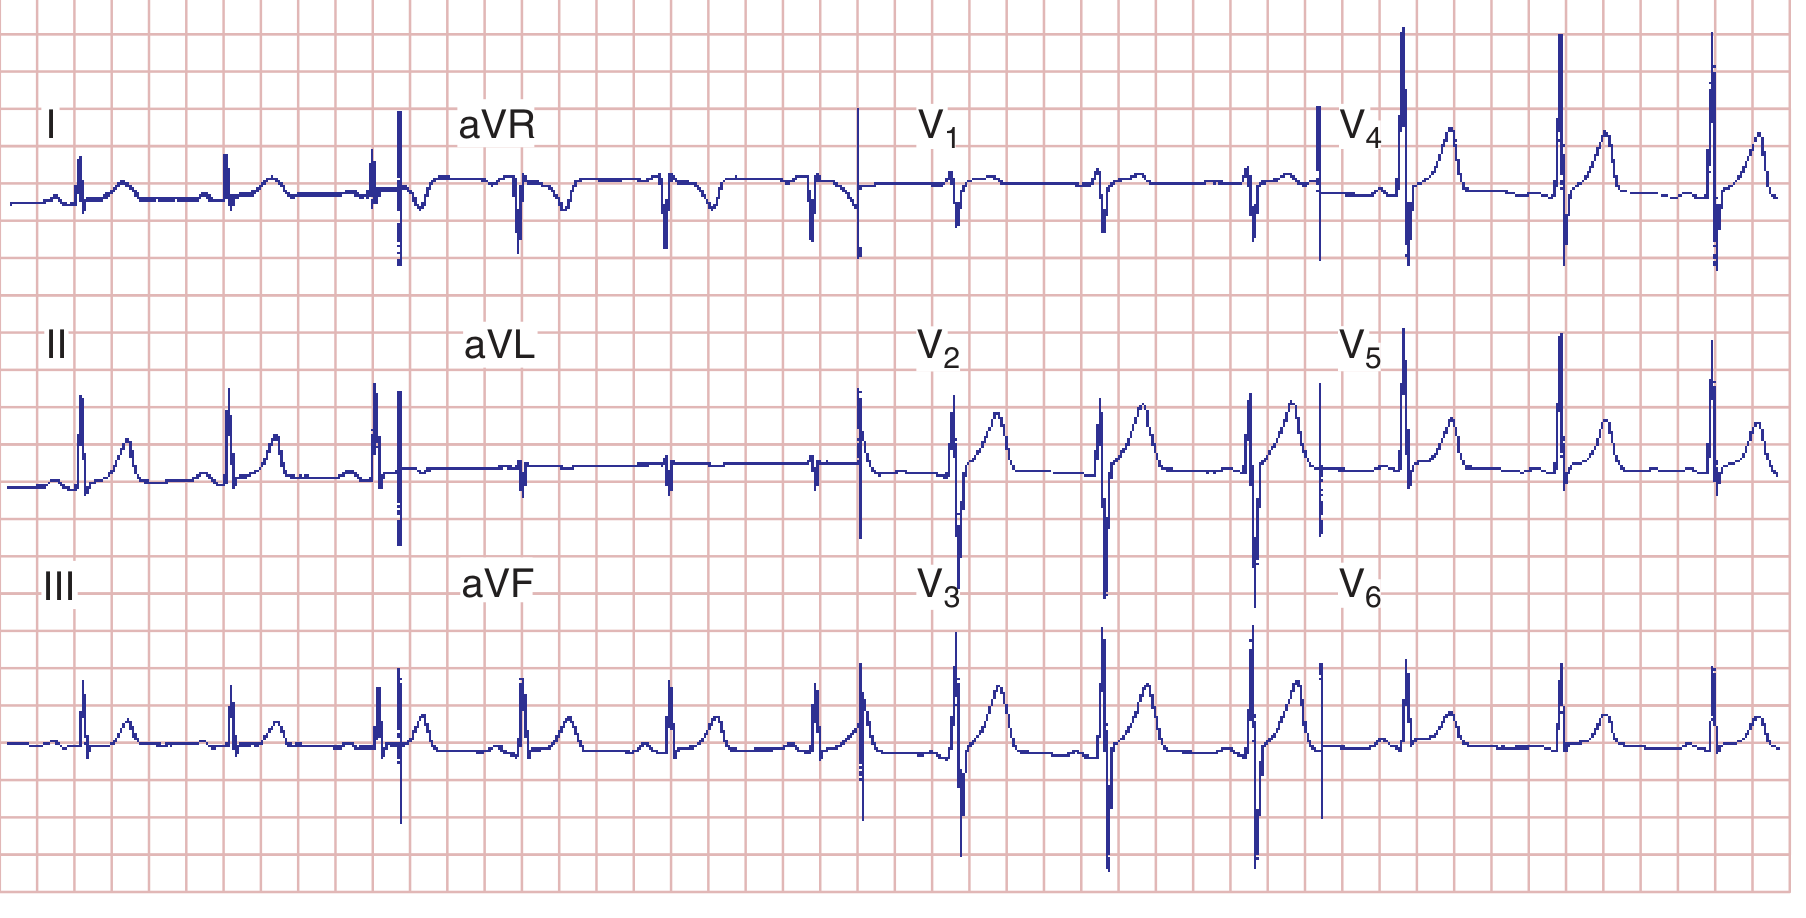
Fig. Normal 12-lead ECG. Heart rate 75 bpm, PR 160 ms, QRS 80 ms, QT 360 ms, QTc ~390 ms, axis +70°. Normal R-wave progression with transition zone at V1. - Harrison's 22E
In V1, you see a small r wave (septal depolarization going right) followed by a deep S wave (main ventricular vector going left). In V6, there is a small septal q wave then a dominant tall R wave. This is normal R-wave progression.
PART 7 - CHAMBER HYPERTROPHY
Left Ventricular Hypertrophy (LVH)
- Sokolow-Lyon criterion: S in V1 + R in V5 or V6 > 35 mm
- Cornell criterion: R in aVL + S in V3 > 28 mm (men), > 20 mm (women)
- Repolarization changes: ST depression + T-wave inversion in lateral leads (I, aVL, V5-V6)
Right Ventricular Hypertrophy (RVH)
- Dominant R wave in V1 (R > S in V1)
- Right axis deviation
- T-wave inversions in right precordial leads (V1-V3)
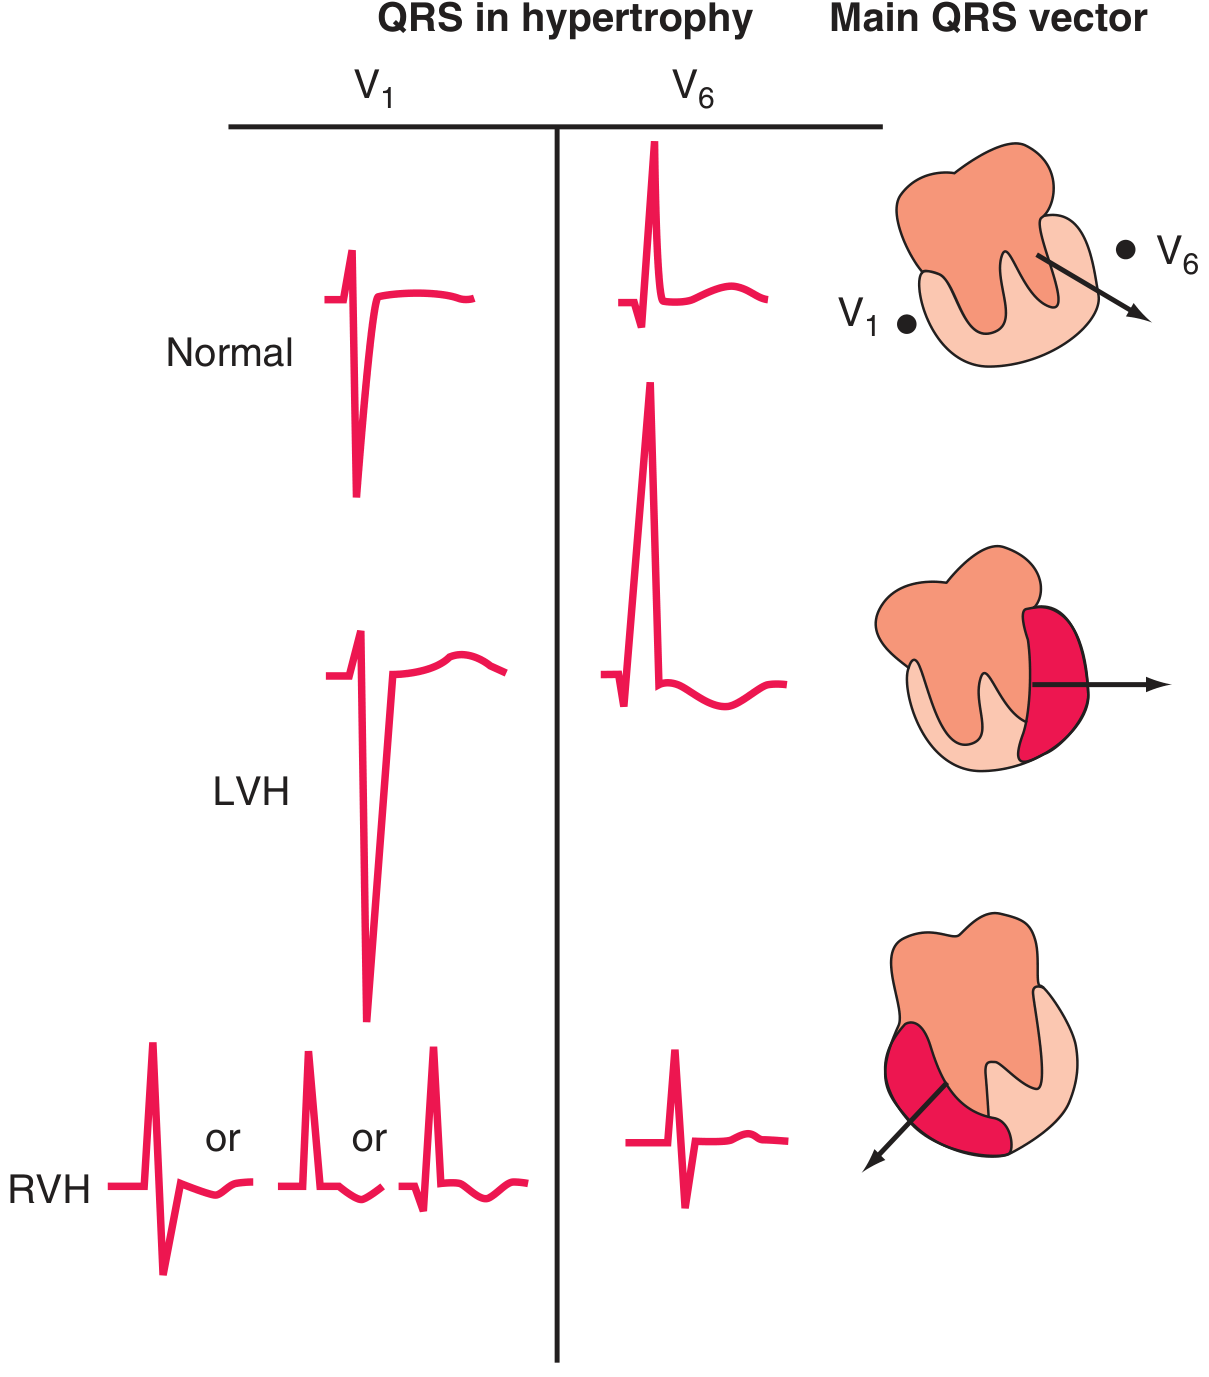
Fig. LVH shifts QRS forces leftward/posteriorly (deep S in V1, tall R in V6). RVH shifts forces rightward (dominant R in V1, deep S in V6). - Harrison's 22E
PART 8 - CONDUCTION ABNORMALITIES
PR Interval Abnormalities (Heart Block)
| Type | PR Interval | QRS | Key Feature |
|---|---|---|---|
| 1st degree AV block | > 200 ms, constant | Normal | Every P conducts, just delayed |
| 2nd degree Mobitz I (Wenckebach) | Progressively lengthens | Normal | PR gets longer until a QRS drops |
| 2nd degree Mobitz II | Fixed, may be normal | Often wide | Sudden dropped QRS without PR change |
| 3rd degree (complete) | No relationship | Wide (escape) | P and QRS are completely dissociated |
Clinical note: Mobitz II and 3rd degree block often require pacing. Mobitz I is generally benign.
Bundle Branch Blocks
Wide QRS (> 120 ms) = bundle branch block or ventricular origin
| Feature | RBBB | LBBB |
|---|---|---|
| V1 morphology | rSR' (rabbit ears) | Broad notched QS or rS |
| V6 morphology | Wide S wave | Broad notched R, no S |
| Clinical | Often benign | Often pathological (IHD, cardiomyopathy) |
| ST/T | T inversion V1-V3 | Discordant ST changes (opposite to QRS) |
Fascicular blocks (hemiblocks): These do not widen the QRS significantly. Instead:
- Left anterior fascicular block (LAFB): left axis deviation (axis < -45°)
- Left posterior fascicular block (LPFB): right axis deviation (axis > +110°) - rare, must exclude other causes
PART 9 - ISCHEMIA AND MYOCARDIAL INFARCTION
The ECG is central to diagnosing acute and chronic ischemic heart disease. Ischemia lowers the resting membrane potential and shortens action potential duration, creating voltage gradients (currents of injury) that shift the ST segment. - Harrison's 22E
The Evolution of an MI
| Stage | ECG Change |
|---|---|
| Hyperacute (minutes) | Tall, peaked "hyperacute" T waves |
| Acute (hours) | ST elevation (STEMI) |
| Hours to days | T-wave inversions develop |
| Days to weeks | Pathological Q waves form |
| Old MI | Persistent Q waves, normalized ST/T |
STEMI Localization Table
(From Tintinalli's Emergency Medicine)
| MI Location | Leads with ST Elevation | Culprit Artery |
|---|---|---|
| Anterior | V1-V4 | LAD |
| Anteroseptal | V1-V2 (± V3) | LAD (proximal) |
| Anterolateral | V1-V6, I, aVL | LAD + circumflex |
| Lateral | I, aVL | Circumflex |
| Inferior | II, III, aVF | RCA (most common) or circumflex |
| Inferolateral | II, III, aVF, V5-V6 | RCA or circumflex |
| Right ventricular | II, III, aVF + V4R-V6R elevation | RCA (proximal) |
| True posterior | Tall R + ST depression V1-V2 (mirror image) | RCA or circumflex |
Reciprocal changes: ST depression in leads opposite the infarct zone indicates a larger area at risk, more severe CAD, and increased mortality.
STEMI Criteria (standard leads)
- At least 2 contiguous leads with:
- ST elevation ≥ 1 mm in limb leads
- ST elevation ≥ 2 mm in V1-V3 (men), ≥ 1.5 mm in V2-V3 (women)
- New LBBB may represent STEMI equivalent (though < 10% of new LBBB patients actually have AMI)
NSTEMI / Unstable Angina
- ST depression (subendocardial ischemia)
- T-wave inversions
- Transient ST elevation that resolves
- Normal ECG does NOT exclude ACS
PART 10 - ARRHYTHMIAS
Supraventricular Arrhythmias
| Arrhythmia | Heart Rate | Rhythm | Key Feature |
|---|---|---|---|
| Sinus tachycardia | 100-180 | Regular | Normal P waves, identifiable cause |
| Sinus bradycardia | < 60 | Regular | Normal P waves |
| Atrial fibrillation | Variable (150-180 untreated) | Irregularly irregular | No discernible P waves; fibrillatory baseline |
| Atrial flutter | 300 (atrial), 150 (ventricular, 2:1 block) | Regular | Sawtooth flutter waves, best in II, III, aVF |
| SVT (AVNRT/AVRT) | 150-250 | Regular | Narrow QRS, P waves hidden in or just after QRS |
| Multifocal atrial tachycardia | > 100 | Irregular | ≥ 3 different P wave morphologies |
Ventricular Arrhythmias
| Arrhythmia | Rate | Morphology | Significance |
|---|---|---|---|
| PVC | Premature | Wide bizarre QRS, no P wave, compensatory pause | Common; worrisome if frequent or in runs |
| Ventricular tachycardia (VT) | 100-250 | Wide QRS (> 120 ms), AV dissociation | Life-threatening |
| Ventricular fibrillation (VF) | Chaotic | No organized complexes | Cardiac arrest; immediate defibrillation |
| Torsades de pointes | 200-250 | "Twisting" around baseline | Associated with long QT; polymorphic VT |
Distinguishing VT from SVT with aberrancy (Brugada criteria):
- No RS complex in any precordial lead? → VT
- RS interval > 100 ms in any V lead? → VT
- AV dissociation present? → VT
- Morphology criteria (LBBB or RBBB pattern in V1, V6)? → VT
- If all 4 negative: SVT with aberrancy
PART 11 - SPECIAL PATTERNS (ADVANCED)
Wolff-Parkinson-White (WPW)
- Short PR interval (< 120 ms)
- Delta wave (slurred upstroke of QRS)
- Wide QRS
- Mechanism: accessory pathway (Bundle of Kent) bypasses AV node, pre-excites ventricles
- Danger: if AF develops, can conduct at very rapid rates → VF
Brugada Pattern
- Right bundle branch block appearance in V1-V2
- Coved ST elevation in V1-V2 (type 1 = diagnostic)
- Associated with sudden cardiac death in structurally normal hearts
- Sodium channelopathy (SCN5A)
Long QT Syndrome
- QTc > 440 ms (men) or > 460 ms (women)
- Risk of torsades de pointes → VF
- Causes: congenital (LQTS 1-3), drugs (quinidine, sotalol, haloperidol, macrolides), electrolyte disturbances (hypokalemia, hypomagnesemia)
Electrolyte Effects on ECG
| Electrolyte | ECG Changes |
|---|---|
| Hyperkalemia | Peaked T waves → wide QRS → sine wave → VF |
| Hypokalemia | Prominent U waves, flat T waves, prolonged QU |
| Hypercalcemia | Short QT interval |
| Hypocalcemia | Prolonged QT interval |
Pulmonary Embolism (PE)
- Sinus tachycardia (most common)
- New right heart strain: right axis deviation, RBBB, T inversions V1-V3
- Classic (but rare) S1Q3T3: deep S in lead I, Q wave in lead III, T inversion in lead III
- Atrial fibrillation may develop
Pericarditis
- Diffuse ST elevation (concave/saddle-shaped, in almost all leads)
- PR depression (pathognomonic - opposite of STE direction)
- Evolves through 4 stages
PART 12 - A QUICK CLINICAL MEMORY AID
Rate → Rhythm → Axis → Intervals → P waves → QRS → ST/T
("Really Rhythmic Athletes Ignore Pointless QRS Stuff" → RRAIPQS)
Instant differentials by finding:
| Finding | Think |
|---|---|
| Irregularly irregular, no P waves | Atrial fibrillation |
| Sawtooth waves at 300 bpm | Atrial flutter |
| Wide QRS + AV dissociation | Ventricular tachycardia |
| ST elevation inferior (II, III, aVF) | Inferior STEMI (RCA) |
| ST elevation anterior (V1-V4) | Anterior STEMI (LAD) |
| Delta wave + short PR | WPW syndrome |
| Coved STE V1-V2 + RBBB-like | Brugada pattern |
| Peaked T waves + wide QRS | Hyperkalemia |
| Prolonged QT + twisting VT | Torsades de pointes |
| Diffuse saddle STE + PR depression | Pericarditis |
| S1Q3T3 + sinus tachycardia | Pulmonary embolism |
PART 13 - PROGRESSIVE SKILL BUILDING
Beginner - Master the normal ECG first. Learn to identify every wave and interval. Practice measuring the PR, QRS, and QT on paper.
Intermediate - Apply the systematic 7-step approach to every ECG without shortcuts. Learn all STEMI patterns and the major arrhythmias. Understand axis.
Advanced - Know the Sgarbossa criteria (LBBB + MI), Wellens syndrome (biphasic or inverted T in V2-V3 = critical LAD stenosis), de Winter T waves (anterior STEMI equivalent), and AIVR (accelerated idioventricular rhythm). Master the Brugada algorithm for wide complex tachycardias.
Expert - Interpret ambulatory 24-hour Holter recordings, understand heart rate variability and QT dispersion, recognize pacemaker rhythms and pacemaker malfunction, perform risk stratification post-MI.
Sources: Harrison's Principles of Internal Medicine 22E | Costanzo Physiology 7th Ed | Tintinalli's Emergency Medicine | Braunwald's Heart Disease 15th Ed
This is a shared conversation. Sign in to Orris to start your own chat.