
Make me learn cohort study in detail from park book psm easily
Reading File
Finding Sources
Finding Sources
Reading File
Finding Sources
Reading File
Reading File
Reading File
Reading File
Reading File
Loading Image
Reading File
I now have all the content I need from Park's book. Let me compile the comprehensive, easy-to-learn response.
📚 Cohort Study - Complete Notes from Park's PSM
Source: Park's Textbook of Preventive and Social Medicine
1. What is a Cohort Study?
A cohort study is an analytical (observational) study undertaken to obtain additional evidence to refute or support an association between a suspected cause and a disease.
Other names used:
- Prospective study
- Longitudinal study
- Incidence study
- Forward-looking study
The most widely used term is "cohort study".
2. Distinguishing Features (Remember: 3 points)
| # | Feature |
|---|---|
| a | Cohorts are identified prior to the appearance of the disease under investigation |
| b | Study groups are observed over time to determine the frequency of disease |
| c | The study proceeds forward from cause to effect (unlike case-control which goes backward) |
3. Design - The Big Picture
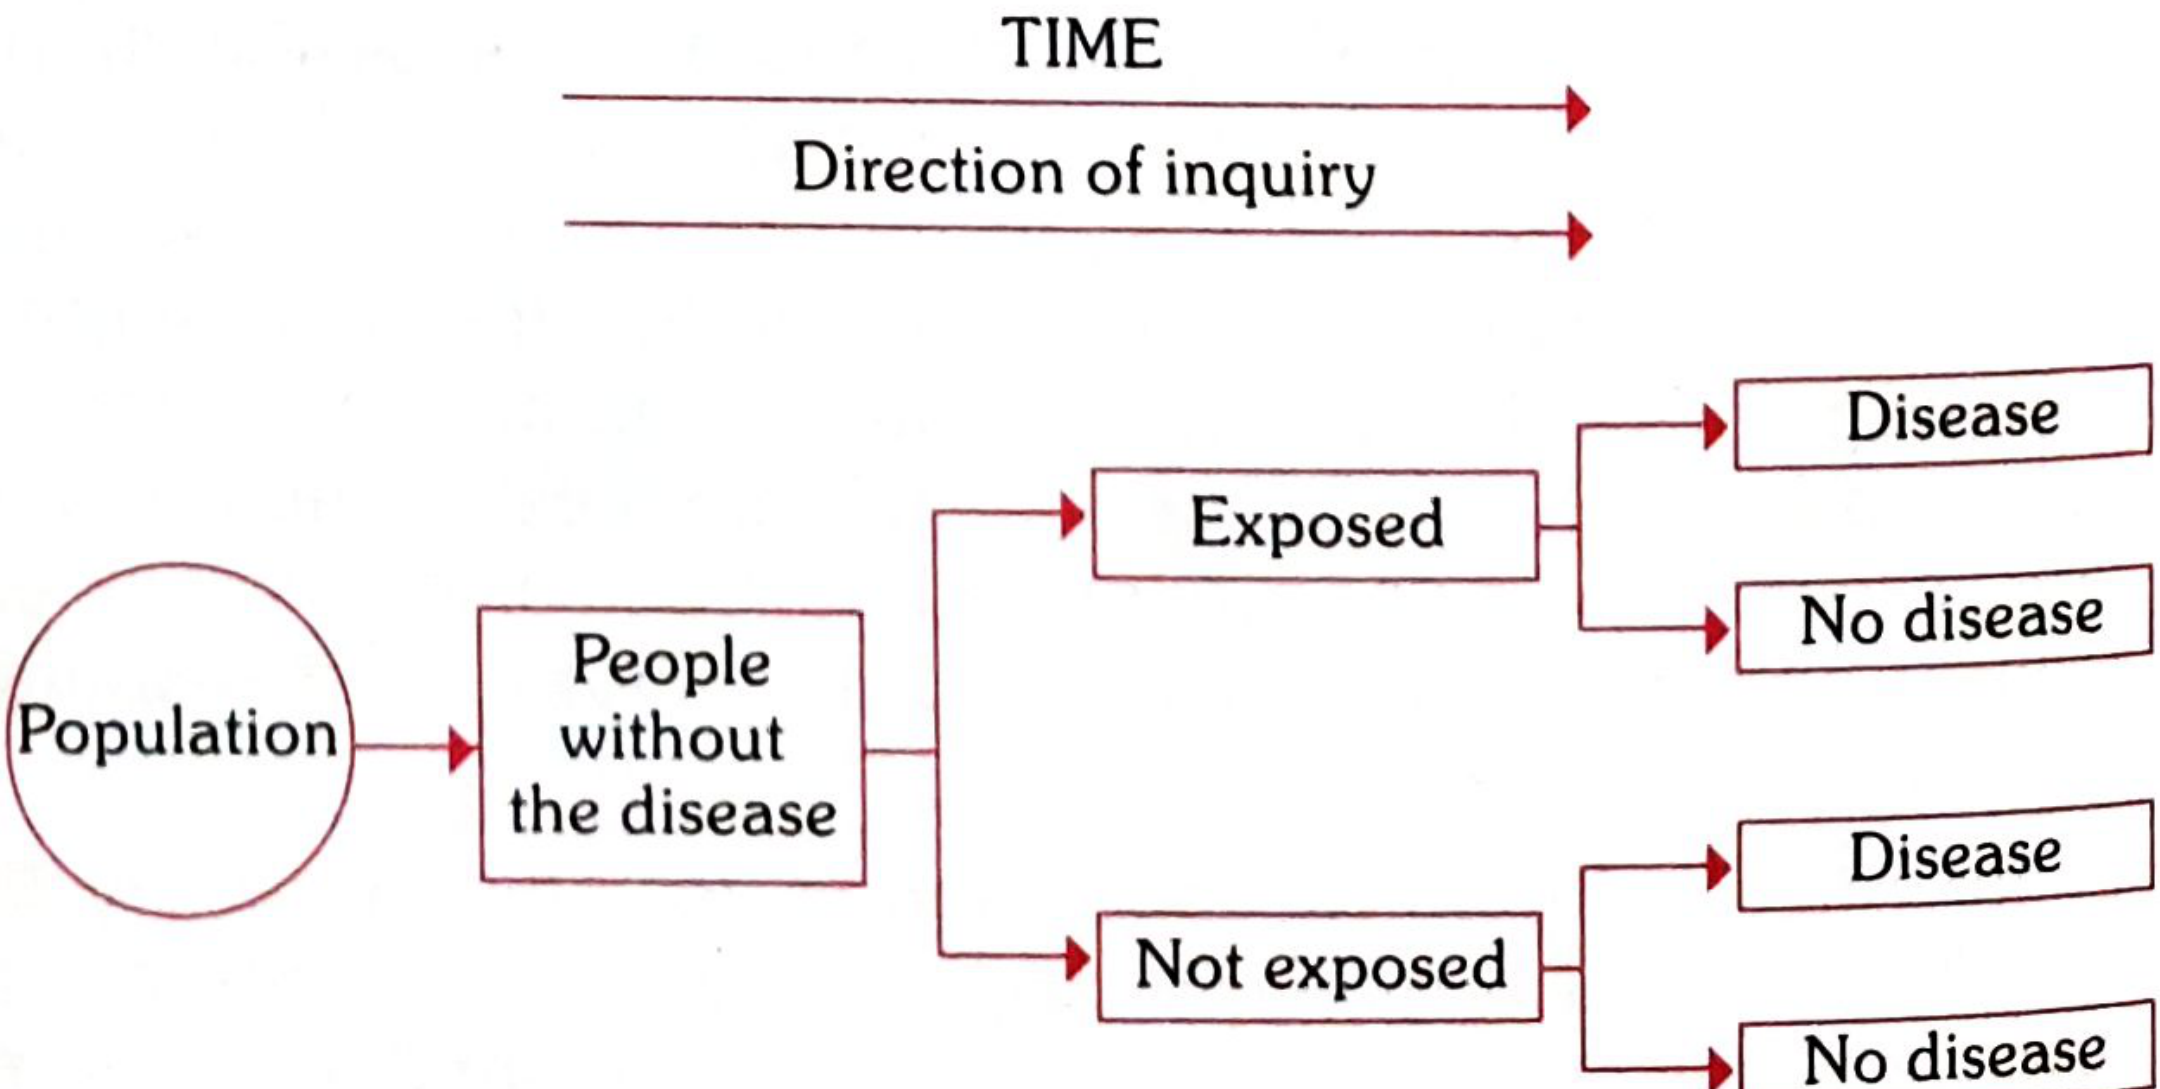
Flow: Population → People without the disease → Split into Exposed vs Not Exposed → Follow over time → Both groups may develop Disease or remain No disease
Key concept: Direction of inquiry goes forward in time (cause → effect).
4. Concept of "Cohort"
A cohort = a group of people who share a common characteristic or experience within a defined time period.
Examples:
- Birth cohort - people born in the same year (e.g., birth cohort of 2010)
- Exposure cohort - persons exposed to a common drug, vaccine, or infection within a defined period
- Marriage cohort - group married in the same period
- A cohort might be all those who survived a myocardial infarction in one particular year
The comparison group may be:
- The general population from which the cohort is drawn, OR
- Another cohort with little/no exposure to the substance in question
5. Indications for Cohort Studies (4 points)
Cohort studies are indicated when:
(a) There is good evidence of an association between exposure and disease (from clinical observations + descriptive + case-control studies)
(b) Exposure is rare, but incidence of disease is high among exposed - e.g., workers in industries, those exposed to X-rays
(c) Attrition of study population can be minimized - i.e., follow-up is easy, cohort is stable, cooperative and easily accessible
(d) Ample funds are available
6. Framework of a Cohort Study
The approach: CAUSE → EFFECT (compare with case-control: effect → cause)
- In case-control: both exposure AND disease have already occurred when the study begins
- In cohort study: exposure has occurred, but the disease has NOT yet occurred
The 2×2 Table (Table 16):
| Cohort | Disease: YES | Disease: NO | Total |
|---|---|---|---|
| Exposed to putative aetiological factor | a | b | a + b |
| Not exposed to putative aetiological factor | c | d | c + d |
Interpretation: If a/(a+b) is significantly higher than c/(c+d), it suggests the disease and suspected cause are associated.
Key rules for assembling cohorts:
- Cohorts must be free from the disease under study at the start
- Both groups should be equally susceptible to the disease
- Both groups should be comparable for all possible confounding variables
- Diagnostic and eligibility criteria must be defined beforehand
"A well-designed cohort study is considered the most reliable means of showing an association between a suspected risk factor and a disease."
7. Types of Cohort Studies
(1) Prospective Cohort Studies
- Study starts in the present and follows subjects into the future
- Exposure data collected as disease develops
- Example: Doll's study on British doctors (smoking and lung cancer, 1951)
(2) Retrospective Cohort Studies (Historical Cohort)
- Uses past records to identify the cohort
- The cohort is identified in the past and the disease outcome has already occurred by the time the study is initiated
- Example: Doll's study of asbestos workers - records from 1930s were used
- Advantage: Less time-consuming and less expensive than prospective studies
(3) Combination (Retrospective + Prospective)
- Both elements combined
- Cohort identified from past records, assessed up to date for outcome, then followed prospectively into the future
- Example: Court-Brown and Doll (1957) - assembled a cohort in 1955 of 13,352 patients who received radiation therapy for ankylosing spondylitis (1934-1954), evaluated deaths from leukaemia/aplastic anaemia, then followed prospectively forward
8. Elements of a Cohort Study (5 steps)
- Selection of study subjects
- Obtaining data on exposure
- Selection of comparison groups
- Follow-up
- Analysis
Step 1: Selection of Study Subjects
(a) General population: Used when the exposure or cause is fairly frequent. Cohorts assembled from well-defined geographical areas.
- Classic example: Framingham Heart Study
(b) Special groups:
- Select groups - professional groups (doctors, nurses, teachers, civil servants), insured persons, college alumni, volunteers. They are homogeneous and offer easy follow-up.
- Example: Doll's prospective study on smoking/lung cancer - British doctors listed in Medical Register of UK in 1951
- Example: Dorn's study on 293,658 veterans with life insurance policies in the USA
- Exposure groups - if exposure is rare, select a cohort known to have experienced the exposure (e.g., radiologists exposed to X-rays, factory workers)
Step 2: Obtaining Data on Exposure
Methods to record exposure:
- Interviews and questionnaires
- Medical examination / clinical records
- Biological specimens (blood, urine)
- Environmental measurements
- Employment records
Step 3: Selection of Comparison Groups
Three ways:
(a) Internal comparisons - No outside control needed. A single cohort is classified into sub-groups by degree of exposure (e.g., ½ pack, 1 pack, 2 packs of cigarettes/day). Mortality rates are compared within the cohort.
(Table 17 - Age standardized death rates per 100,000 men/year by smoking amount):
| Cigarettes | Death rate |
|---|---|
| ½ pack | 95.2 |
| ½-1 pack | 107.8 |
| 1-2 packs | 229.2 |
| 2+ packs | 264.2 |
Shows a clear dose-response relationship!
(b) External comparisons - When degree of exposure data is unavailable, an outside control is used (e.g., smokers vs non-smokers; radiologists vs ophthalmologists). Both groups must be similar in demographics except for the exposure.
(c) Comparison with general population rates - The mortality experience of the exposed group is compared with the general population in the same geographic area (e.g., uranium mine workers vs general population lung cancer rates). The ratio of observed to expected values measures the effect.
Step 4: Follow-up
- Regular periodic examination of all cohort members yields the most information
- Despite best efforts, losses to follow-up are inevitable (death, migration, withdrawal)
- These losses may bias results
- Target: achieve as close to 95% follow-up as possible
Step 5: Analysis
Data analyzed in terms of:
(a) Incidence rates - calculated directly in exposed and non-exposed groups
Example (Table 18 - Smoking and lung cancer):
| Smoking | Lung cancer | No lung cancer | Total |
|---|---|---|---|
| Yes | 70 (a) | 6930 (b) | 7000 |
| No | 3 (c) | 2997 (d) | 3000 |
- Incidence among smokers = 70/7000 = 10 per 1000
- Incidence among non-smokers = 3/3000 = 1 per 1000
- P < 0.001 (statistically significant)
(b) Estimation of risk using two key indices:
9. Risk Measures in Cohort Studies
Relative Risk (RR) = Risk Ratio
RR = Incidence in exposed / Incidence in non-exposed
Using the example above:
RR = 10/1 = 10
- The larger the RR, the stronger the association between cause and effect
- Important in aetiological (causation) enquiries
- But RR does not reflect public health importance as well as attributable risk does
Attributable Risk (AR) = Risk Difference
AR = Incidence in exposed - Incidence in non-exposed
Also expressed as attributable risk percentage (AR%):
AR% = (Incidence in exposed - Incidence in non-exposed) / Incidence in exposed × 100
Why AR matters more for public health?
(Table 20 - Oral contraceptives and cardiovascular complications):
| Age group | RR | AR (per 100,000 patient-years) |
|---|---|---|
| 30-39 years | 2.8 | 3.5 |
| 40-44 years | 2.8 | 20.0 |
- RR is the same (2.8) in both age groups
- BUT AR is >5 times higher in older women
- This is why oral contraceptives are not recommended for women >35 years - the absolute risk is much greater
(Table 21 - Smoking: RR vs AR for different diseases):
| Cause of death | Smokers death rate/1000 | Non-smokers death rate/1000 | RR | AR% |
|---|---|---|---|---|
| Lung cancer | 0.90 | 0.07 | 12.86 | 92.2% |
| CHD | 4.87 | 4.22 | 1.15 | 13.3% |
Key lesson: Smoking accounts for 92% of lung cancer - a very high attributable risk.
10. Advantages of Cohort Studies
(a) Incidence rates can be calculated directly
(b) Multiple outcomes related to one exposure can be studied simultaneously - e.g., cohort studies on smoking and lung cancer also revealed association with coronary heart disease, peptic ulcer, cancer oesophagus, etc.
(c) Provides a direct estimate of relative risk
(d) Dose-response ratios can be calculated
(e) Certain forms of bias minimized - because comparison groups are formed before disease develops, misclassification of exposed vs unexposed is reduced
11. Disadvantages of Cohort Studies
(a) Very expensive and time-consuming - especially for diseases with long latency
(b) Large study population needed - unsuitable for rare diseases
(c) Changes over time - diagnostic criteria may change; the "healthy worker effect" can distort results
(d) Losses to follow-up - attrition can introduce bias
(e) Ethical problems may arise if those found to be at risk are not treated/intervened
(f) Not suitable for rare diseases
12. Famous Examples of Cohort Studies
| Study | Investigator | Exposure | Outcome |
|---|---|---|---|
| British Doctors Study | Doll & Hill (1951) | Smoking | Lung cancer & other diseases |
| Framingham Heart Study | - | Multiple risk factors | Cardiovascular disease |
| Veterans Study (USA) | Dorn | Smoking | Mortality in 293,658 veterans |
| Radiation & Ankylosing Spondylitis | Court-Brown & Doll (1957) | Radiation therapy | Leukaemia/aplastic anaemia |
13. Quick Comparison: Cohort vs Case-Control
| Feature | Cohort Study | Case-Control Study |
|---|---|---|
| Direction | Cause → Effect (forward) | Effect → Cause (backward) |
| Starting point | Exposure (before disease) | Disease (already occurred) |
| Measure of risk | Relative Risk (direct) | Odds Ratio (indirect) |
| Incidence rate | Can calculate | Cannot calculate directly |
| Cost | Expensive, time-consuming | Less expensive, faster |
| Best for | Common diseases | Rare diseases |
| Bias | Less recall bias | More recall/selection bias |
| Sample size | Large | Smaller |
14. One-Line Memory Tricks
- Cohort = Cause first, then follow for disease ("C for Cause-first")
- RR from Cohort, OR from Case-control
- Framingham = Cohort study classic
- Doll's British Doctors Study = most famous cohort
- 95% follow-up = the gold standard target
- AR% tells you how much disease you can prevent - more useful for public health policy
- Park's Textbook of Preventive and Social Medicine, pp. 83-92
This is a shared conversation. Sign in to Orris to start your own chat.