
Complications of hemodialysis
"hemodialysis"[MeSH Terms] AND "complications"[MeSH Terms]
hemodialysis complications diagram
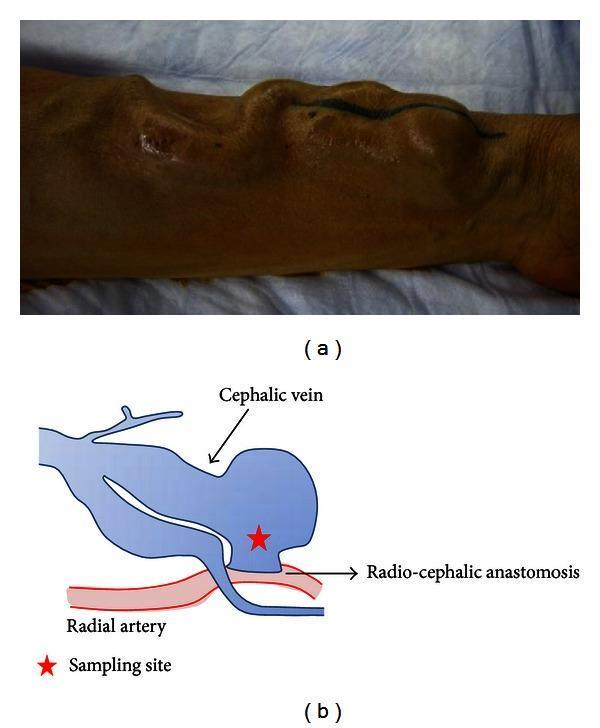
This composite educational material displays clinical and schematic representations of an overflow arteriovenous (AV) fistula. Panel (a) is a clinical photograph of a patient's forearm, showing a severely dilated, tortuous, and bulging cephalic vein characteristic of high-flow fistula complications. The overlying skin exhibits hyperpigmentation, scarring, and a black marking identifying a region of interest. Panel (b) is an anatomical diagram illustrating the underlying radio-cephalic anastomosis. It depicts the surgical connection between the radial artery (red) and the cephalic vein (blue), highlighting the resulting venous dilation and a specific sampling site marked with a red star near the anastomosis. This content is intended for medical education regarding hemodialysis access complications, vascular surgery, and the pathophysiology of high-flow AV fistulas in renal failure patients.
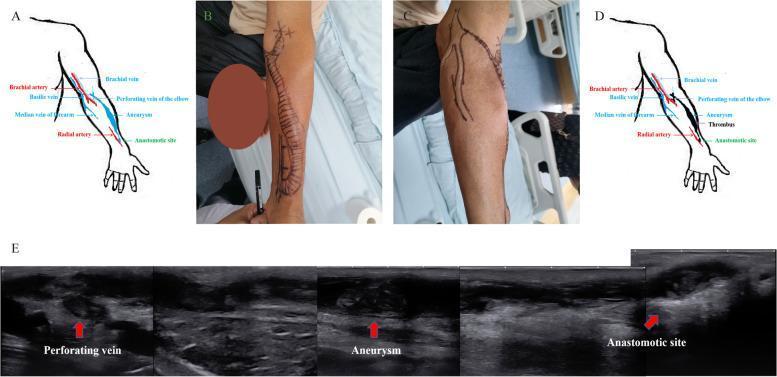
A multi-panel figure illustrating a thrombosed arteriovenous fistula (AVF) in a hemodialysis patient. (A) Anatomical diagram showing a radiocephalic AVF with an aneurysm in the median vein of the forearm and outflow through a perforating vein to the brachial vein. (B, C) Clinical photographs of the left upper limb with skin markings delineating a tortuous, dilated superficial venous pathway and visible distension consistent with venous aneurysms. (D) Schematic illustrating the location of a thrombus extending from the anastomotic site to the elbow. (E) Grayscale ultrasound images of the 'Perforating vein', 'Aneurysm', and 'Anastomotic site'. The ultrasound reveals dilated vascular lumens containing heterogeneous echogenic material, diagnostic of intraluminal thrombosis. The educational focus is on the clinical and radiological presentation of AVF complications, specifically aneurysm formation and subsequent thrombosis in a patient with end-stage renal disease.
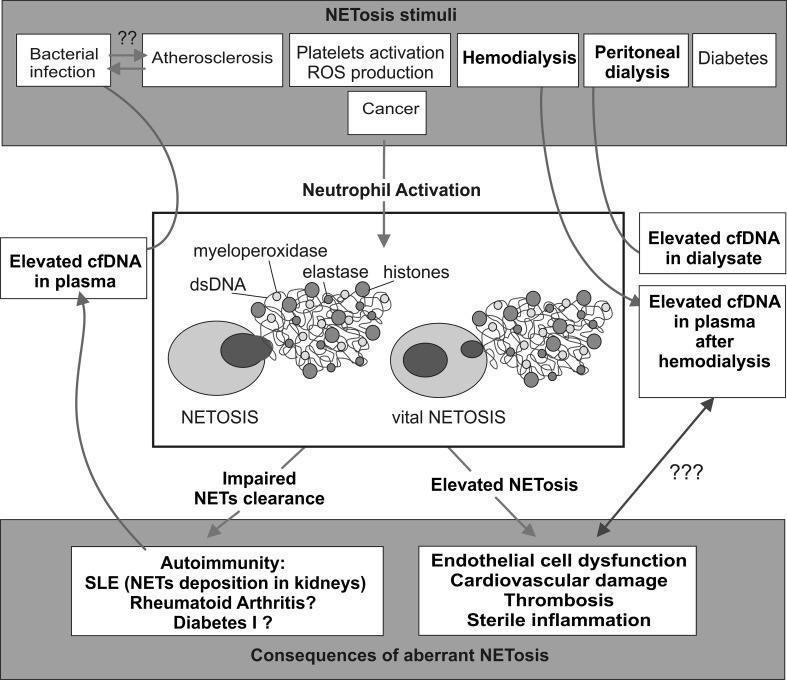
A pathophysiology diagram illustrating the pathways of NETosis activation, neutrophil response, and clinical consequences. The flowchart is organized into three horizontal sections. The top section, 'NETosis stimuli', lists triggers including bacterial infection, atherosclerosis, platelet activation with ROS production, hemodialysis, peritoneal dialysis, diabetes, and cancer. The middle section, 'Neutrophil Activation', depicts the biological process of suicidal NETosis and vital NETosis, illustrating the extracellular release of a meshwork composed of dsDNA, myeloperoxidase, elastase, and histones. Lateral boxes highlight clinical biomarkers such as elevated cell-free DNA (cfDNA) in plasma and dialysate. The bottom section, 'Consequences of aberrant NETosis', connects impaired NET clearance to autoimmune conditions like SLE and Rheumatoid Arthritis, as well as systemic complications including endothelial cell dysfunction, cardiovascular damage, thrombosis, and sterile inflammation. This educational graphic serves to demonstrate the link between innate immune dysregulation and chronic inflammatory diseases.
![This medical informatics flowchart illustrates a data pipeline for real-time predictive analytics in a clinical setting, specifically for hemodialysis monitoring. The diagram shows data ingestion from two primary sources: clinical 'BVM and Machine Data' (depicting a patient in a dialysis chair) and 'Other treatment and demographic data' from a data warehouse. These inputs feed into a centralized 'Cloud Database' within an AWS cloud environment. The processing layer consists of two parallel pathways: a training/logic path leading to an 'ML Model' (represented by gears) and a real-time 'Function to generate features [F(x)]'. Both pathways converge at an 'End Point Interface', which serves the processed data to a 'Real-time Prediction Storage' unit. The final output is visualized on a 'Real-time dashboard' (depicted as a speedometer gauge) designed to alert clinicians to acute changes in Relative Blood Volume (RBV). This architecture demonstrates the integration of machine learning into clinical decision support systems for predicting intradialytic complications.](https://cdn.orris.care/cdss_images/pmc_clinical_VQA_56abd4ae3f8be317a244325df377757edb313e272d04dbf0a9f3a73e433b598f.jpg)
This medical informatics flowchart illustrates a data pipeline for real-time predictive analytics in a clinical setting, specifically for hemodialysis monitoring. The diagram shows data ingestion from two primary sources: clinical 'BVM and Machine Data' (depicting a patient in a dialysis chair) and 'Other treatment and demographic data' from a data warehouse. These inputs feed into a centralized 'Cloud Database' within an AWS cloud environment. The processing layer consists of two parallel pathways: a training/logic path leading to an 'ML Model' (represented by gears) and a real-time 'Function to generate features [F(x)]'. Both pathways converge at an 'End Point Interface', which serves the processed data to a 'Real-time Prediction Storage' unit. The final output is visualized on a 'Real-time dashboard' (depicted as a speedometer gauge) designed to alert clinicians to acute changes in Relative Blood Volume (RBV). This architecture demonstrates the integration of machine learning into clinical decision support systems for predicting intradialytic complications.
Complications of Hemodialysis
I. Intradialytic (Acute) Complications
1. Hypotension (Most Common)
- Excessive ultrafiltration (UF) beyond vascular refilling capacity - the most common cause
- Underestimation of the patient's "dry weight"
- Osmolar shift: solute removal reduces plasma osmolality and favors fluid shift out of the intravascular space
- Heat transfer from dialysate causes vasodilation, counteracting compensatory vasoconstriction
- Impaired cardiac reserve (ischemia, arrhythmia, pericardial tamponade)
- Antihypertensive medications
- Sepsis/reduced vascular tone
- Meal ingestion during dialysis (lowers peripheral vascular resistance)
- Early in session → pre-existing hypovolemia (GI losses, bleeding, sepsis)
- Late in session → excessive UF; also consider cardiac/pericardial disease
- Halt UF; place patient in Trendelenburg position
- Oral salt (broth) or IV isotonic saline 100-500 mL
- Reduce blood flow rate; administer oxygen
- Discontinue HD if persistent or dangerous
- Avoid UF rates >10-13 mL/kg/hour (associated with increased cardiovascular mortality)
- Reassess dry weight frequently
- Cool dialysate (0.5-1°C below body temperature; keeps >35°C) - improves vascular resistance via sympathetic activation and reduces myocardial stunning
- Sequential UF (UF before dialysis)
- Sodium modeling
- Avoid antihypertensives and food before/during dialysis
- Midodrine (α₁ agonist) - used by some, though evidence for routine use is insufficient
- Extend session time or add sessions per week
2. Muscle Cramps
3. Dialysis Disequilibrium Syndrome
- Higher risk in patients initiating HD for the first time, especially with severe azotemia
- Avoided by using shorter initial dialysis sessions and lower blood flow rates ("gentle" first dialysis)
4. Dialyzer Reactions (Hypersensitivity)
| Feature | Type A | Type B |
|---|---|---|
| Timing | Within 5-20 min (early) | Several minutes into session |
| Mechanism | IgE-mediated (hypersensitivity to ethylene oxide sterilant or membrane) | Complement activation + cytokine release |
| Symptoms | Pruritus, urticaria, bronchospasm, anaphylaxis, potentially fatal | Non-specific chest and back pain |
| "First-use syndrome" | Classic presentation | Not applicable |
| Course | Severe; may be fatal | Milder; typically resolves with continued dialysis |
5. Chest and Back Pain
- Angina/myocardial ischemia (HD-induced, even silent - troponin release and regional LV dysfunction documented on echocardiography during HD sessions)
- Pericarditis
- Air embolism (rare)
6. Air Embolism
7. Hemorrhage
- Access-site bleeding
- Retroperitoneal hemorrhage
- Subdural hematoma
- GI bleeding (already elevated in ESKD due to angiodysplasia, platelet dysfunction)
8. Arrhythmias
- Ventricular arrhythmias
- Atrial fibrillation - prevalence >20% in HD patients
- Dialysate calcium <2.25 mEq/L is associated with more frequent hypotension and arrhythmia
II. Vascular Access Complications
Thrombosis
- Loss of thrill (palpable) and bruit (auscultable) indicates thrombosis
- Do NOT irrigate or forcefully manipulate - risk of rupture or venous embolism
- Management: thrombolytic agents or surgical revision (consult vascular surgery urgently)
Infection / Bacteremia
- Vascular access sites account for ~75% of all bacteremia cases in HD patients
- Most commonly caused by Staphylococcus aureus and other skin flora (Staphylococci)
- Grafts are more prone to infection than native fistulas
- Signs may be subtle (fever without localizing findings is common)
- All HD patients with unexplained fever should have blood cultures drawn and be treated empirically for access infection
- Treatment: IV vancomycin 1-1.5 g (drug of choice; minimally hemodialyzable; effective every 4-7 days) ± a gram-negative agent (3rd-gen cephalosporin or aminoglycoside) if gram-negative coverage needed
Aneurysm / Pseudoaneurysm
- Can develop in AV fistulas with repeated needle punctures
- Risk of rupture, thrombosis, and skin erosion
- Evaluate with Doppler ultrasound; refer to vascular surgery for recurrent bleeding or enlarging lesions
Steal Syndrome
- Diversion of arterial blood through a high-flow fistula away from the distal limb
- Presents as ischemic pain, pallor, numbness, or weakness distal to the fistula
High-Output Cardiac Failure
- Patients with AV fistulas/grafts can develop high-output failure due to shunting
- On rare occasions may necessitate ligation of the fistula/graft
- Branham sign: bradycardia in response to manual compression of the fistula (indicates high cardiac output through the shunt)
III. Cardiac Complications (Long-Term)
Myocardial Stunning
Hypertension
- Volume overload between sessions
- Renin-angiotensin-aldosterone axis overactivation
- Sympathetic overactivity
- Secondary hyperparathyroidism
IV. Pericardial Disease
- Uremic pericarditis: Occurs within 8 weeks of initiating dialysis; presumed due to unidentified uremic toxins. Managed by intensifying dialysis (longer or more frequent sessions).
- Dialysis-related pericarditis: In well-dialyzed patients; likely multifactorial (viral, autoimmune, poor access function). Does NOT respond to more HD; requires anti-inflammatory therapy or surgery.
- Complications: Cardiac tamponade, constrictive pericarditis
- Note: Avoid systemic anticoagulation to reduce pericardial hemorrhage risk
V. Neurological Complications
| Complication | Features |
|---|---|
| Dialysis disequilibrium | Acute; nausea, seizures, coma at end of dialysis |
| Uremic encephalopathy | Impaired consciousness, asterixis, myoclonus |
| Dialysis dementia (historic) | Progressive dementia from aluminum toxicity in dialysate; rare now |
| Subdural hematoma | Anticoagulation + platelet dysfunction in ESKD |
| Restless legs syndrome | Very common in ESKD patients on HD |
VI. Other Long-Term / Chronic Complications
| Complication | Notes |
|---|---|
| Anemia | Erythropoietin deficiency + iron deficiency; treated with ESAs + IV iron |
| Renal osteodystrophy | Secondary hyperparathyroidism, osteitis fibrosa, adynamic bone disease |
| Amyloidosis (β₂-microglobulin) | Accumulation of β₂-microglobulin; carpal tunnel syndrome, cystic bone lesions, arthropathy |
| Infection | Impaired immune function; increased susceptibility to TB, fungal infections, and viral hepatitis (B and C) |
| Nutritional/metabolic | Protein-energy wasting, hypoalbuminemia, hyperlipidemia |
| Fatigue / sleep disorders | Post-dialysis fatigue, insomnia, restless legs |
| Depression / anxiety | Highly prevalent; associated with poor outcomes |
| Vascular calcification | Accelerated by calcium loading, hyperphosphatemia, high PTH |
| Inadequate dialysis | Underdialysis leads to uremic symptoms, pericarditis, neuropathy |
Summary Table: Intradialytic Complications at a Glance
| Complication | Frequency | Key Feature |
|---|---|---|
| Hypotension | 15-50% of sessions | Most common; excessive UF |
| Muscle cramps | Common | Rapid volume/below dry weight removal |
| Dialyzer reaction (Type A) | Rare | Anaphylaxis; IgE/ethylene oxide |
| Dialyzer reaction (Type B) | Less rare | Chest/back pain; complement activation |
| Dialysis disequilibrium | Uncommon | Seizures/coma; new patients at risk |
| Arrhythmia | Significant | Electrolyte shifts; AF >20% prevalence |
| Air embolism | Rare | Prevented by machine detectors |
| Hemorrhage | Variable | Anticoagulation + platelet dysfunction |
- Harrison's Principles of Internal Medicine, 22E (2025, McGraw Hill), Chapter on HD Complications
- Brenner and Rector's The Kidney (2-Volume Set), Chapter 63
- Tintinalli's Emergency Medicine: A Comprehensive Study, Chapter 90
- Rosen's Emergency Medicine: Concepts and Clinical Practice, Chapter 69