Oxygen dissociation curve with graph and factors that shifts curve to left and right*
Reading File
Finding Sources
Searching Images
oxygen dissociation curve hemoglobin shift left right
Reading File
Reading File
Reading File
Loading Image
Loading Image
Finding Sources
Finding Sources
Finding Sources
Reading File
Finding Sources
Finding Sources
Loading Image
I now have everything needed for a comprehensive answer. Here it is:
Oxygen Dissociation Curve (ODC)
The Curve
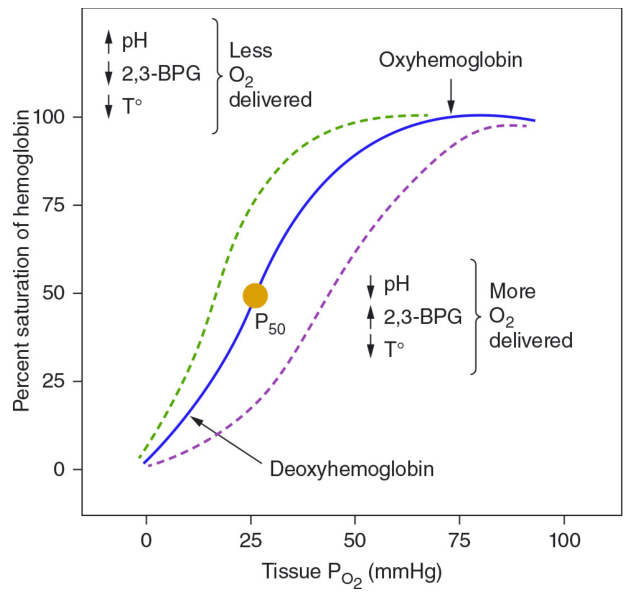
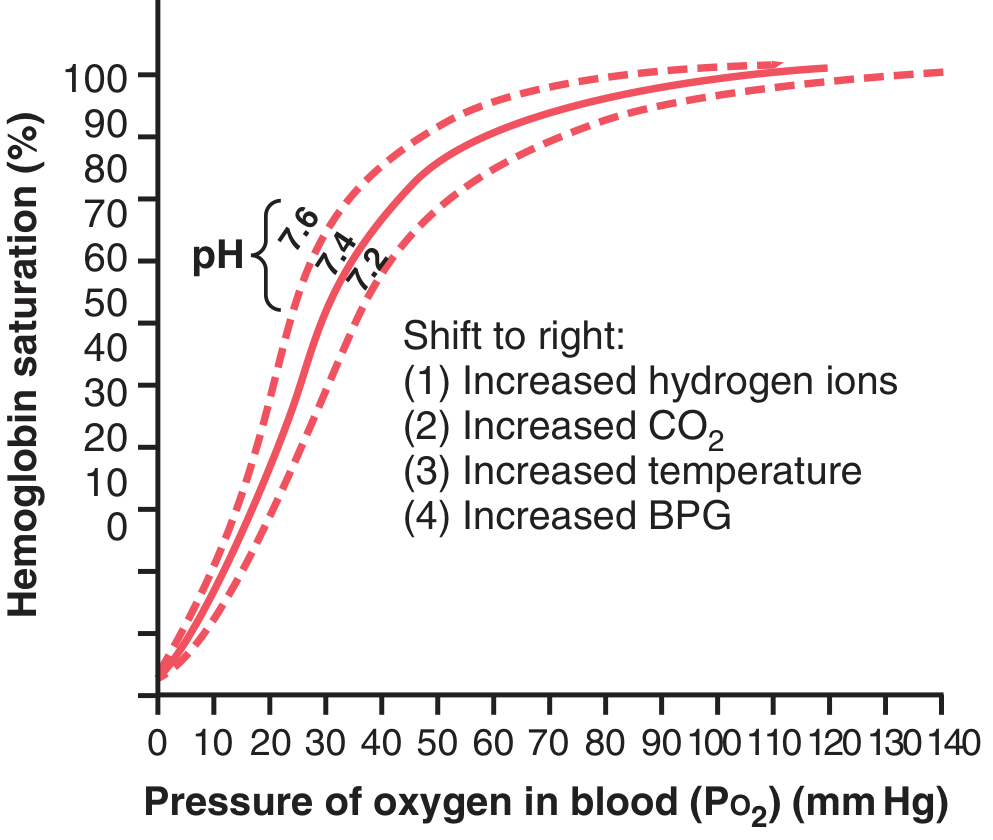
The ODC describes the relationship between the partial pressure of oxygen (PO₂) and the percent saturation of hemoglobin (SaO₂). It has a characteristic sigmoid (S-shaped) form — not hyperbolic — because hemoglobin exhibits cooperative binding: once one heme group binds O₂, subsequent binding to the remaining three heme groups becomes progressively easier (T → R quaternary conformational shift).
Key Reference Points
| Point | Value | Significance |
|---|---|---|
| P₅₀ | ~26–27 mmHg | PO₂ at which Hb is 50% saturated (standard conditions) |
| Arterial PO₂ | ~95–100 mmHg | Hb ~97–99% saturated |
| Venous PO₂ | ~40 mmHg | Hb ~75% saturated → only ¼ of O₂ delivered at rest |
The flat upper portion (PO₂ 60–100 mmHg) means lung disease causing modest drops in alveolar PO₂ still allows near-normal O₂ loading. The steep middle portion (PO₂ 20–60 mmHg) enables large amounts of O₂ to be released to tissues with relatively small drops in PO₂ — maximizing tissue delivery.
Shifts of the Curve
A right shift = ↑ P₅₀ = decreased O₂ affinity → more O₂ unloaded to tissues
A left shift = ↓ P₅₀ = increased O₂ affinity → less O₂ released to tissues
A left shift = ↓ P₅₀ = increased O₂ affinity → less O₂ released to tissues
RIGHT Shift (↓ Affinity, more O₂ delivered to tissues)
| Factor | Mechanism |
|---|---|
| ↓ pH (acidosis) | H⁺ stabilizes the T (deoxy) form of Hb — the Bohr effect |
| ↑ CO₂ | Direct carbamino binding + H⁺ generation via carbonic anhydrase → Bohr effect |
| ↑ Temperature | Weakens Hb–O₂ bonds; seen during exercise, fever, sepsis |
| ↑ 2,3-DPG (2,3-BPG) | Binds deoxy-Hb β-chains → stabilizes T form; ↑ in chronic hypoxia, anemia, high altitude |
Clinical scenario — exercise: Active muscles release CO₂ and acids, raise temperature → right shift → O₂ offloaded at PO₂ as high as 40 mmHg even when 70% already extracted. Lungs then see a reverse shift, loading more O₂.
LEFT Shift (↑ Affinity, less O₂ delivered to tissues)
| Factor | Mechanism |
|---|---|
| ↑ pH (alkalosis) | Stabilizes R (oxy) form; reverse Bohr effect |
| ↓ CO₂ (hypocapnia) | Less H⁺ generated; Hb holds O₂ |
| ↓ Temperature | Strengthens Hb–O₂ bonds (e.g., hypothermia) |
| ↓ 2,3-DPG | Stored bank blood (DPG degrades in 24 h), neonates |
| Carbon monoxide (CO) | CO has 240× greater affinity for Hb; forms carboxyhemoglobin AND causes conformational change → left shift of remaining Hb = double toxicity |
| Fetal hemoglobin (HbF, α₂γ₂) | γ-chains interact weakly with 2,3-DPG → inherently higher O₂ affinity than HbA; facilitates O₂ transfer from maternal to fetal circulation across placenta |
| Methemoglobin | Fe²⁺ → Fe³⁺; non-O₂-carrying subunits increase affinity of remaining subunits → left shift |
| High altitude (acutely) | Respiratory alkalosis from hyperventilation → left shift initially (later offset by ↑ 2,3-DPG) |
Summary Mnemonic
Right shift = CADET (CO₂↑, Altitude↓ O₂ affinity, DPG↑, Exercise, Temperature↑)
Left shift = opposite of each + CO, HbF, MetHb
Left shift = opposite of each + CO, HbF, MetHb
Sources:
- Fishman's Pulmonary Diseases and Disorders — Oxygen Dissociation Curve
- Guyton & Hall Textbook of Medical Physiology — Bohr Effect & BPG
- Lippincott Biochemistry, 8th ed. — Bohr Effect mechanism
- Mulholland & Greenfield's Surgery, 7e — Table 10.6 Factors Altering ODC
- Harrison's Principles of Internal Medicine, 21st ed. — ODC figure
This is a shared conversation. Sign in to Orris to start your own chat.