
Say me about scoliosis and the curves of scoliosis, what’s the reason behind the curves of cholis explain me about side of the scoliosis, what the cause of the sides of scoliosis, then say me about why the scholar is only measured in anterior posterior in x-ray view About degenerates scoliosis why is known as degenerative? What is the reason behind it?
scoliosis curves types causes degenerative scoliosis AP xray measurement Cobb angle
scoliosis spinal curves AP x-ray Cobb angle measurement
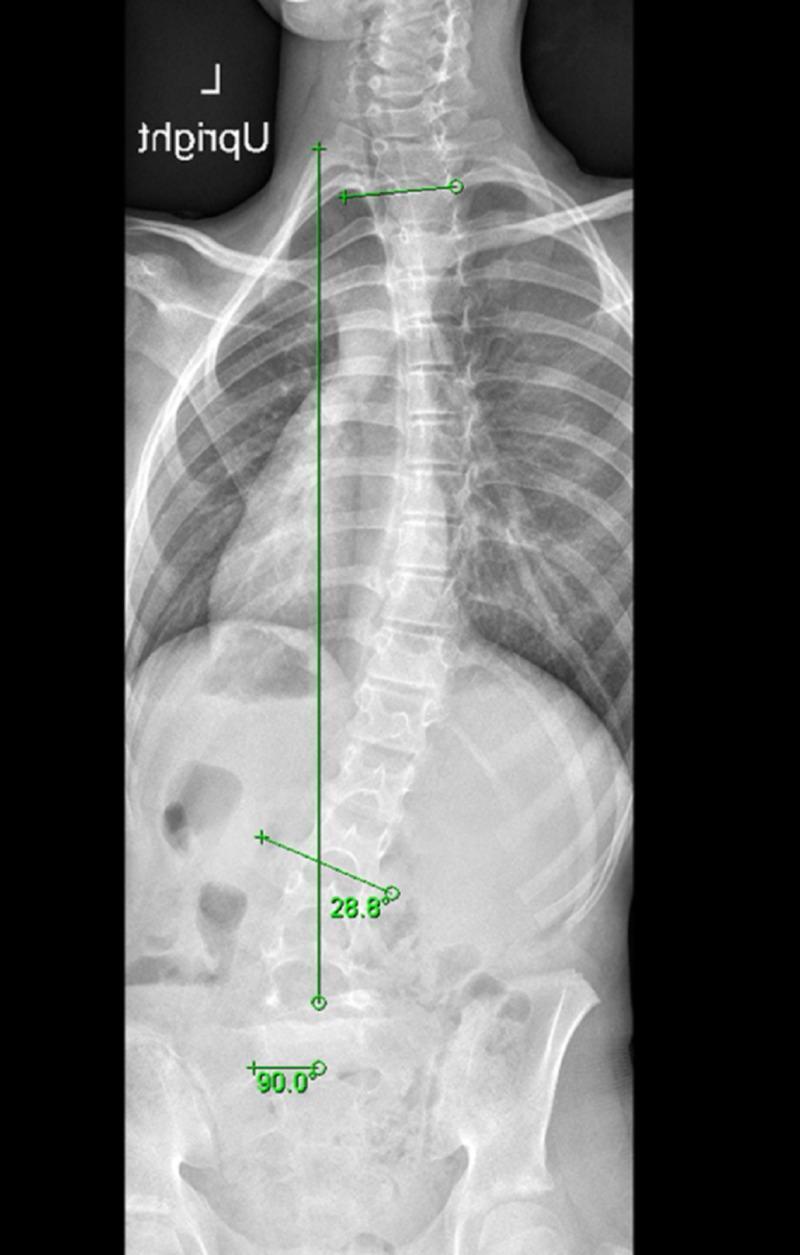
This diagnostic image is a weight-bearing anteroposterior (AP) full-spine radiograph, commonly used for scoliosis evaluation. The X-ray demonstrates a long-segment scoliotic curvature of the spine with a dextroconvex (right-sided) orientation. Anatomical landmarks indicate the curve originates in the upper thoracic spine (T2) and extends through the thoracolumbar junction to the upper lumbar region (L2). Digital annotations show a Cobb angle measurement of 28.8 degrees for this primary curve. Additional quantitative markers include a 90.0-degree angle measurement at the pelvic/lower lumbar interface, evaluating coronal balance or pelvic tilt. The image is critical for diagnosing spinal deformities, assessing vertebral alignment, and monitoring progression in pediatric or adult orthopedic patients. It highlights the absence of significant pedicle rotation at the apex, which is a key clinical indicator in distinguishing between structural and compensatory or non-structural scoliotic curves secondary to conditions like spondylolisthesis.
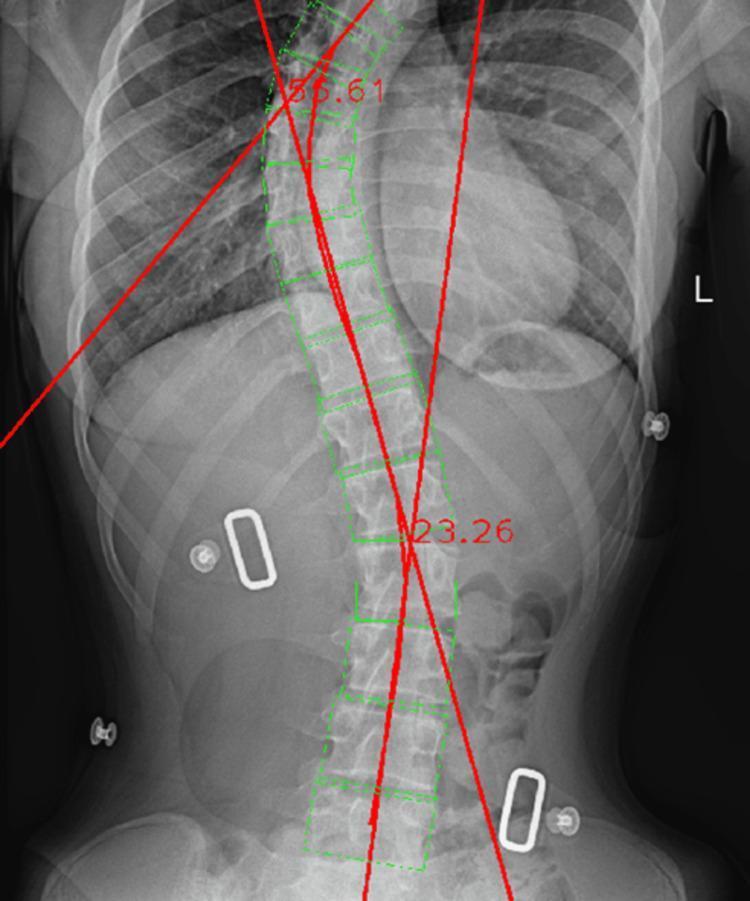
This diagnostic image is an anteroposterior (AP) X-ray of the thoracolumbar spine showing significant scoliotic deformity. The visual content demonstrates an automated Cobb angle measurement performed by clinical software. Green rectangular boxes are overlaid on individual vertebral bodies from the upper thoracic to the lower lumbar region, mapping their anatomical margins. A red polyline follows the central spinal midline, highlighting lateral curvature. Two sets of intersecting red tangent lines are visible: one in the upper thoracic region measuring an angle of 36.61 degrees, and another in the lumbar region measuring 23.26 degrees. These measurements identify a double-curve pattern consistent with combined thoracic and lumbar scoliosis. The vertebral bodies show visible rotation and tilting, particularly at the apex of the curves. The software tools illustrated are used for objective spinal deformity assessment and classification in orthopedic and radiological settings.
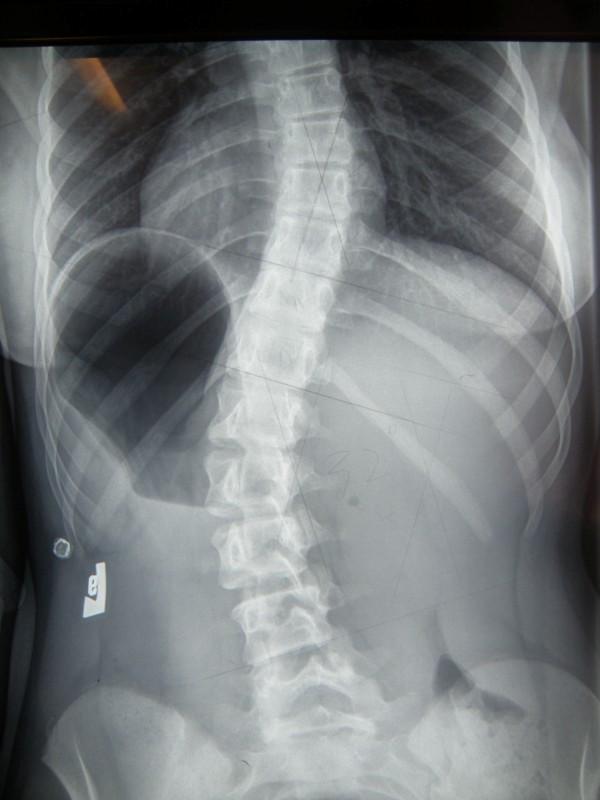
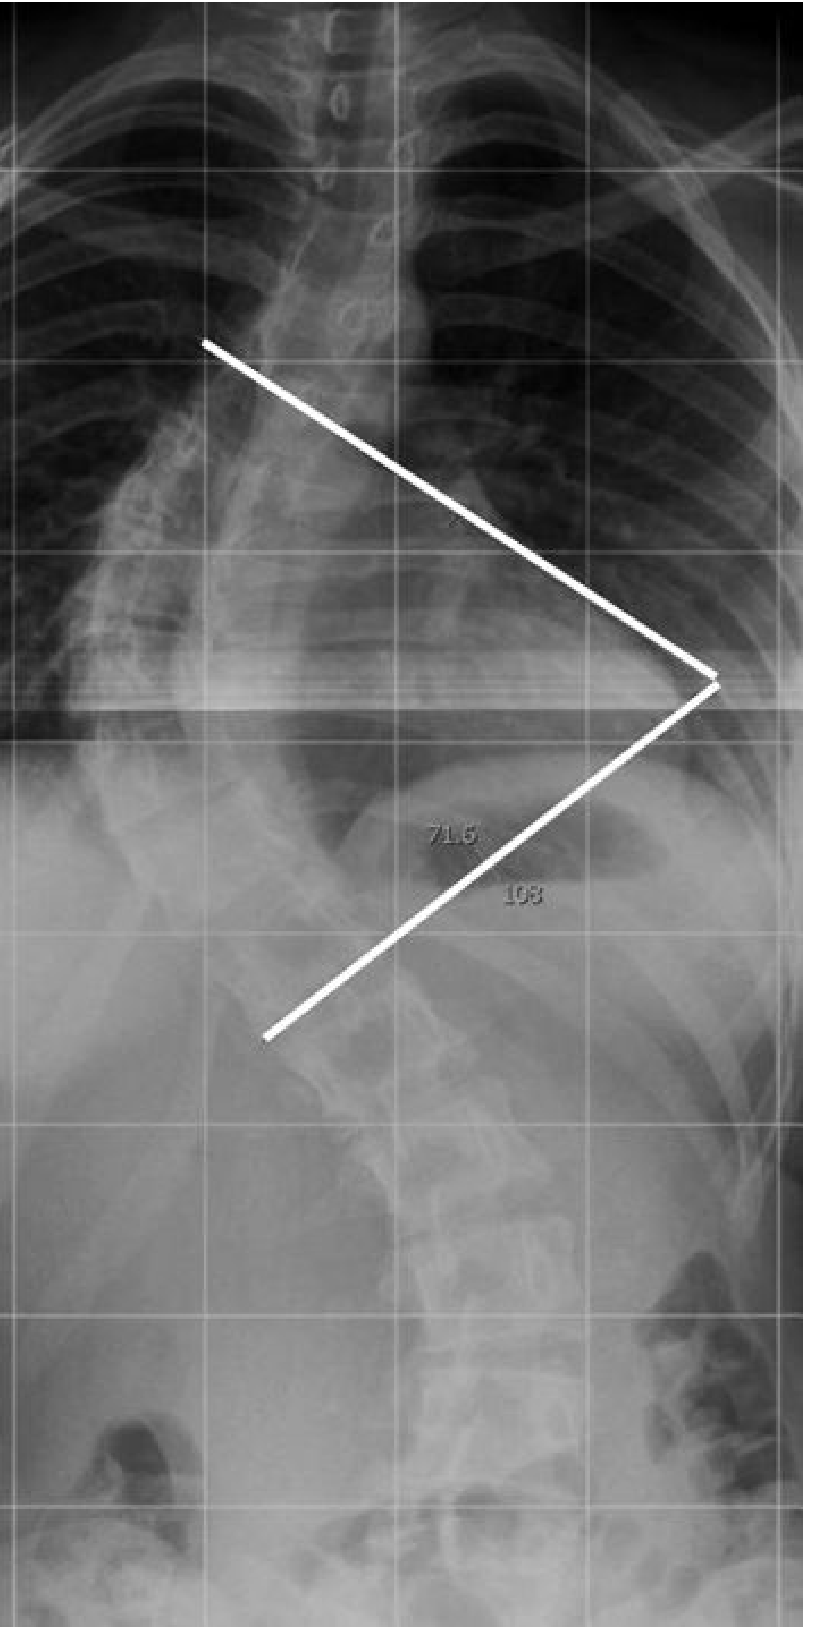
Anteroposterior (AP) x-ray radiography of the spine, primarily focusing on the thoracic and lumbar regions. The diagnostic image reveals a significant S-shaped spinal curvature consistent with double-curve adolescent idiopathic scoliosis. The primary curve is located in the mid-to-lower thoracic region with a rightward lateral convexity (dextroscoliosis). A secondary compensatory curve is observed in the lumbar region with a leftward lateral convexity (levoscoliosis). There is visible rotation of the vertebral bodies toward the convexity of the curves. Secondary skeletal effects include narrowing of the intercostal spaces on the concave sides of the curves and an asymmetric appearance of the rib cage. The lower aspect of the radiograph captures the iliac crests of the pelvis. Faint lines drawn on the film suggest clinical measurement of the Cobb angle for orthopedic assessment. This visual serves as a primary tool for evaluating spinal alignment, determining the degree of deformity, and planning non-operative or surgical treatment protocols in orthopedics and physical therapy.
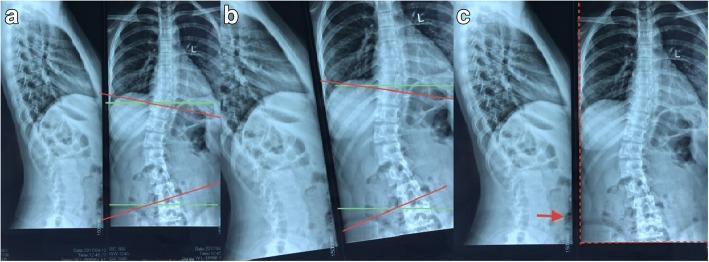
This diagnostic image consists of three panels (a, b, and c) showing anteroposterior (AP) spinal X-ray radiographs used to demonstrate Cobb angle measurement techniques for scoliosis. The images depict the thoracolumbar spine with a visible lateral curvature. Panel 'a' shows a normally oriented film with superimposed horizontal green reference lines and red lines marking the vertebral endplates to calculate the tilt angle. Panel 'b' illustrates a tilted film simulation, demonstrating that the endplate tilt angle relative to the film's horizontal plane remains consistent even when the image is misaligned on a viewing surface. Panel 'c' highlights reference markers used to minimize measurement error, including a red dotted line outlining the rectangular boundary of the imaging data and a red arrow pointing to a vertical ruler line. These markers establish a true horizontal plane for accurate angular assessment. The visual material is designed for orthopedic and radiological education, specifically focusing on the geometry of spinal deformity measurement and the mitigation of extrinsic errors in clinical practice.
Scoliosis: A Complete Guide
1. What Is Scoliosis?
- Coronal (lateral) deviation - the spine bends left or right
- Axial rotation - the vertebral bodies rotate toward the convexity of the curve
- Sagittal change - the normal kyphosis/lordosis may be altered
2. Types / Curves of Scoliosis
By Cause:
| Type | Description |
|---|---|
| Idiopathic | No known cause; most common (80%); strong hereditary component with candidate regions on chromosomes 6, 9, 10, and 16 |
| Congenital | Due to vertebral malformations - hemivertebrae, block vertebrae, butterfly vertebrae |
| Neuromuscular | Caused by muscle imbalance from cerebral palsy, myelomeningocele, spinal muscular atrophy |
| Syndromic | Associated with Marfan syndrome, Ehlers-Danlos, neurofibromatosis, Klippel-Feil |
| Degenerative | Develops in adults after skeletal maturity due to asymmetric disc/facet degeneration |
By Age of Onset (Idiopathic):
| Type | Age at Onset |
|---|---|
| Infantile | Before 3 years |
| Juvenile | 3-10 years |
| Adolescent | 10 years to skeletal maturity (most common) |
| Adult | After skeletal maturity |
By Curve Pattern:
- Single / C-curve - one curve, either thoracic or lumbar
- Double / S-curve - two curves: a primary structural curve + a compensatory curve in the opposite direction (e.g., right thoracic + left lumbar)
- Triple curve - three curves
3. Why Does Scoliosis Curve? The Mechanism Behind the Deformity
- Asymmetric neuro-muscular signaling causing unequal paraspinal muscle tension
- Differential growth rates between the anterior and posterior spinal column
- Proprioception or vestibular dysfunction
- Genetic predisposition (the hereditary chromosomal links mentioned above)
4. The "Side" of Scoliosis - Right vs. Left, Convexity vs. Concavity
Convex Side (the outer arc of the curve):
- The spine bends away from this side
- Vertebral bodies rotate toward this side
- On the thoracic side, the ribs are pushed posteriorly, creating the classic "rib hump" seen on forward bending (Adam's forward bend test)
- Nerve roots on this side are under tension (traction)
- Disc spaces are wider here
Concave Side (the inner arc):
- The spine bends toward this side
- The rib cage is compressed here - narrowing the intercostal spaces
- In degenerative curves, foraminal stenosis predominantly occurs on the concave side, compressing nerve roots
- Disc spaces are narrower
Why does the curve pick a particular side?
5. Why Is Scoliosis Measured on the AP (Anteroposterior) X-Ray View?
The Cobb Angle - the Gold Standard Measurement:
- Identify the most tilted vertebra at the top of the curve (upper end vertebra)
- Identify the most tilted vertebra at the bottom (lower end vertebra)
- Draw a line along the superior end plate of the upper vertebra
- Draw a line along the inferior end plate of the lower vertebra
- The angle formed at their intersection = the Cobb angle
6. Severity Classification by Cobb Angle:
| Cobb Angle | Severity | Management |
|---|---|---|
| < 10° | Normal (not scoliosis) | Observation |
| 10-20° | Mild | Observation, monitoring |
| 25-40° | Moderate | Bracing |
| > 40° (adolescent) / > 50° (adult) | Severe | Surgical consideration |
7. Degenerative Scoliosis - Why Is It Called "Degenerative"?
Definition:
Why the name "Degenerative"?
Aebi Classification of Adult Scoliosis (from Grainger & Allison):
| Type | Description |
|---|---|
| Type I | Primary degenerative scoliosis - develops after skeletal maturity, minimal structural deformity, advanced degenerative changes, mainly lumbar spine. This is "true" degenerative scoliosis. |
| Type II | Progressive idiopathic deformity - began before maturity but becomes symptomatic in adulthood |
| Type III | Secondary degenerative scoliosis - due to pelvic obliquity, hip pathology, or osteoporosis with asymmetric fractures |
Why predominantly in the lumbar spine?
- The lumbar discs bear the most axial load
- The lumbar spine has the greatest mechanical stress over a lifetime
- Lumbar facet joints are largest and most prone to osteoarthritis
Clinical consequences:
Summary in One Paragraph
Abt kyphosis and lordosis
kyphosis lordosis normal spinal curves sagittal diagram
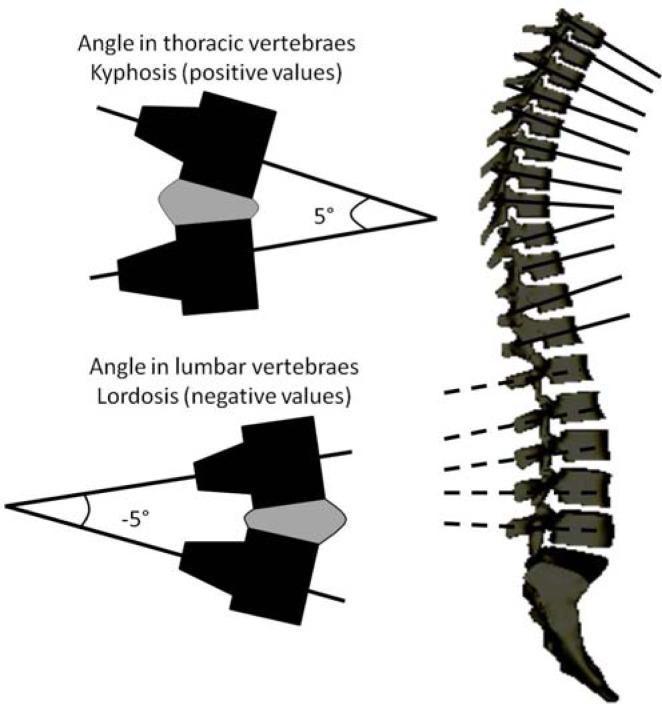
This medical schematic illustrates the sagittal spinal curvatures and the mathematical methodology for calculating vertebral angles using a device like the Spinal Mouse. The image features a lateral view of a human spinal column showing the physiological curves. To the left, two detailed diagrams demonstrate the angular calculation for different spinal regions. The top diagram shows the thoracic vertebrae, where a convex posterior curve is defined as kyphosis; this is represented by positive angular values (exemplified by a +5° angle formed by lines extending from the vertebral bodies). The bottom diagram shows the lumbar vertebrae, where a concave posterior curve is defined as lordosis; this is represented by negative angular values (exemplified by a -5° angle). This visual aid is intended for orthopedic and physiotherapeutic education to explain how digital spinal analysis tools quantify postural alignment and sagittal balance. Key anatomical landmarks included are the thoracic and lumbar vertebral bodies and the sacrum.
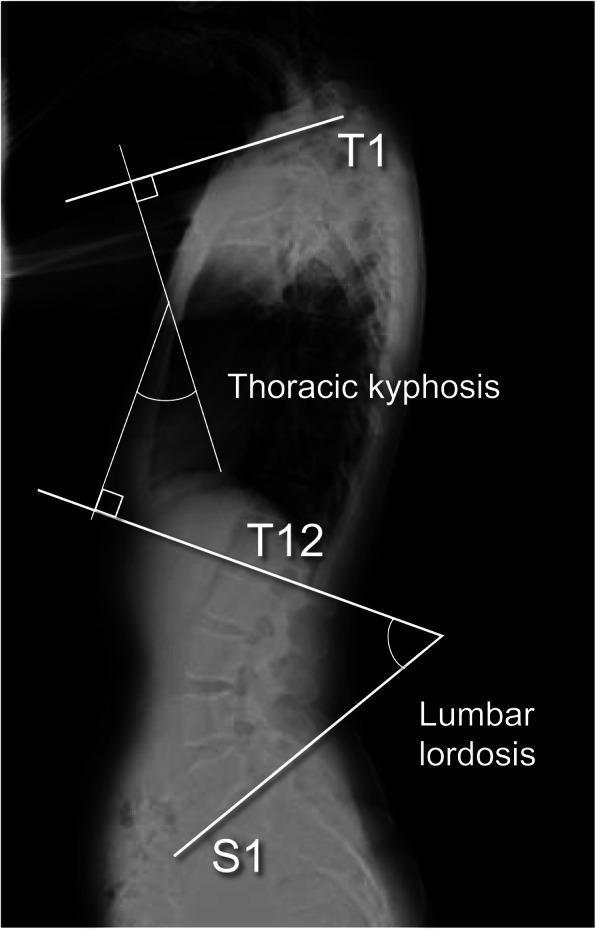
This diagnostic sagittal X-ray (radiograph) of the thoracolumbar spine illustrates the radiographic measurement techniques for sagittal spinal alignment parameters. The image demonstrates two primary spinal curves: thoracic kyphosis and lumbar lordosis. Thoracic kyphosis (TK) is visually defined using the Cobb method, where lines are drawn parallel to the superior endplate of the T1 vertebra and the inferior endplate of the T12 vertebra; the angle formed by the intersection of perpendicular lines from these boundaries quantifies the posterior convexity of the thoracic region. Inferiorly, lumbar lordosis (LL) is measured as the angle between a line drawn along the inferior endplate of T12 and a line along the superior endplate of S1, representing the anterior convexity of the lumbar spine. This clinical imaging is essential for orthopedic and neurosurgical evaluation of sagittal balance, spinal deformities, and preoperative planning. The labeling identifies the key anatomical landmarks (T1, T12, S1) and the resulting angular measurements, providing a clear educational overview of spinopelvic sagittal alignment assessment.
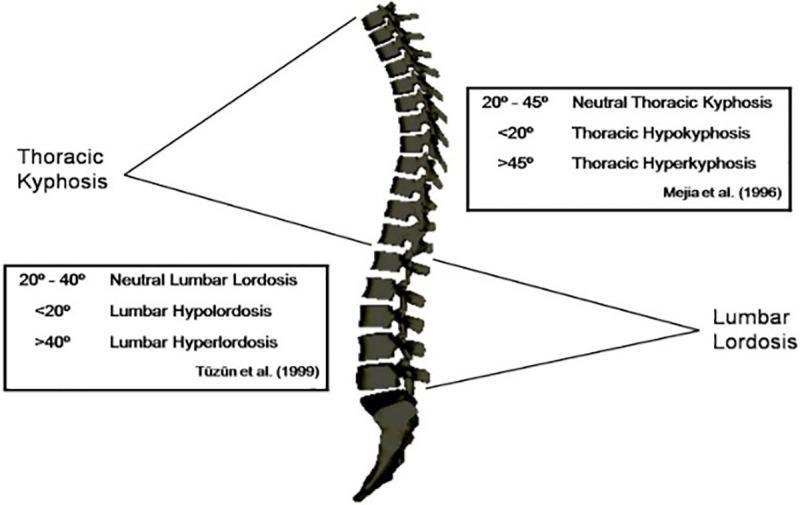
This anatomical diagram illustrates the sagittal classification of spinal curvature in a standing position, focusing on the thoracic and lumbar regions. A lateral view of the human vertebral column highlights two primary curvatures: Thoracic Kyphosis and Lumbar Lordosis. The diagram provides quantitative diagnostic criteria for each region based on established medical literature. For Thoracic Kyphosis (Mejia et al., 1996), values of 20°-45° are defined as neutral, <20° as hypokyphosis, and >45° as hyperkyphosis. For Lumbar Lordosis (Tüzün et al., 1999), the range of 20°-40° is classified as neutral, <20° as hypolordosis, and >40° as hyperlordosis. This infographic serves as a clinical reference for orthopedic and physiotherapeutic assessment of sagittal spinal alignment and postural deviations.
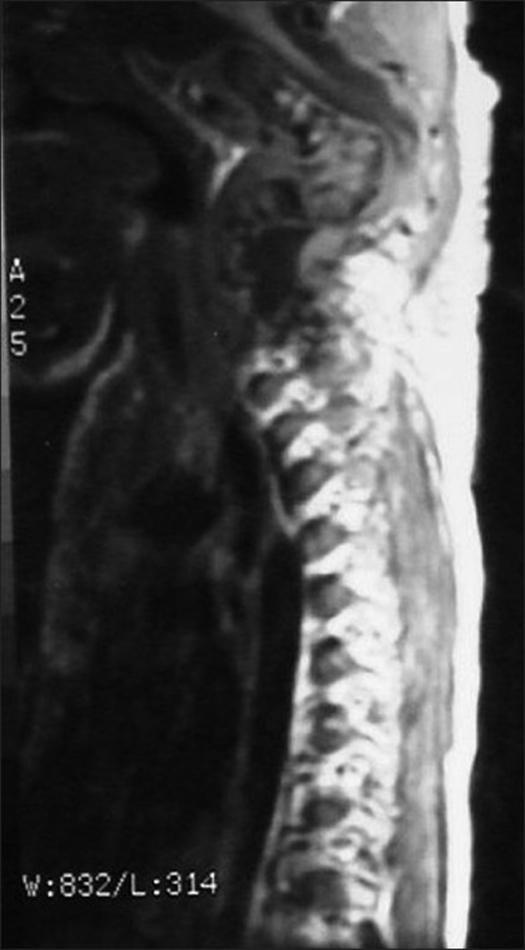
This sagittal T2-weighted MRI image of the cervical spine reveals a severe kyphotic deformity centered at the C2-C4 levels. The normal cervical lordosis is completely replaced by an acute, angular kyphosis of approximately 120 degrees. The spinal alignment is markedly disrupted, consistent with spondyloptosis, where the vertebral bodies have translated significantly, creating a sharp bony apex. The spinal cord is visually stretched and tightly compressed over this bony prominence at the apex of the deformity. There is an evident loss of the normal cerebrospinal fluid (CSF) signal surrounding the cord at the site of maximum narrowing, indicating critical spinal stenosis. The surrounding soft tissues and vertebral body morphologies appear altered by this chronic malalignment. This diagnostic image is representative of advanced neurological compromise due to spinal instability and serves as a classic illustration of severe kyphotic spinal cord compression.
kyphosis lordosis types causes normal spinal curves cervical thoracic lumbar sagittal
Kyphosis and Lordosis
The Normal Spinal Curves - The Foundation
- Cervical lordosis (C1-C7) - concave posteriorly (curves inward/forward)
- Thoracic kyphosis (T1-T12) - concave anteriorly (curves outward/backward)
- Lumbar lordosis (L1-L5) - concave posteriorly (curves inward/forward)
- Sacral kyphosis (sacrum) - fixed, curves outward
KYPHOSIS
What Is It?
Normal vs. Abnormal Ranges:
| Region | Normal Kyphosis | Abnormal |
|---|---|---|
| Thoracic spine | 20-50° (Bailey & Love) / 20-45° | < 20° = hypokyphosis; > 45-50° = hyperkyphosis |
The Shape of Kyphosis:
- Round kyphosis - a smooth, long C-shaped posterior bow (Scheuermann's, postural, osteoporotic)
- Angular kyphosis (gibbus deformity) - a sharp, angular kink at one or two vertebral levels, classically from tuberculosis destroying a vertebral body. Gray's Anatomy notes: "The most dramatic [kyphosis] is usually secondary to tuberculosis infection of a thoracic vertebral body, where the kyphosis becomes angulated at the site of the lesion. This produces the gibbus deformity."
Types / Causes of Kyphosis
1. Postural Kyphosis
- Most common type, especially in adolescents
- A flexible kyphosis - corrects with voluntary extension
- Caused by poor posture habits, weak core muscles
- No structural vertebral changes on X-ray
- Treatment: physiotherapy, postural exercises
2. Scheuermann's Kyphosis (Structural Adolescent Kyphosis)
"Scheuermann's disease presents as a progressive structural adolescent kyphosis characterised radiologically by >5° vertebral wedging at three adjacent levels with end-plate changes. The aetiology is unknown. Treatment ranges from physiotherapy and bracing to surgery."
- Structural = does NOT correct with extension (unlike postural kyphosis)
- The vertebral bodies become wedge-shaped (anterior height reduced more than posterior)
- Classic radiological criteria: >5° anterior wedging at 3 or more consecutive vertebrae
- Typically thoracic (T7-T9 apex), but can be thoracolumbar
- Rigid kyphosis, sometimes painful
- Treated with bracing if curve 45-75° in growing adolescent; surgery if >75° or with neurological involvement
3. Congenital Kyphosis
| Type | Defect |
|---|---|
| Type I | Failure of formation (hemivertebra, wedge vertebra) |
| Type II | Failure of segmentation (anterior unsegmented bar) |
| Type III | Mixed |
4. Degenerative Kyphosis
- Caused by progressive disc degeneration, loss of disc height, and vertebral collapse
- Common in the elderly
- Osteoporotic compression fractures cause anterior vertebral wedging, accumulating to produce a global kyphosis
- Often called "dowager's hump" in elderly women
5. Inflammatory Kyphosis
- Ankylosing spondylitis - progressive inflammation fuses the spine in a kyphotic "bamboo spine" posture
- The spine fuses in flexion, producing a severe, rigid kyphosis with the patient unable to look horizontally
6. Post-Traumatic Kyphosis
- Vertebral fractures (burst fractures, compression fractures) that are not reduced properly heal with anterior height loss, creating focal kyphosis at the injury level
7. Iatrogenic / Post-Surgical Kyphosis
- Excessive laminectomy without fusion can destabilize the posterior tension band, allowing the spine to fall into kyphosis
8. Neuromuscular Kyphosis
- Seen in conditions like Duchenne muscular dystrophy, cerebral palsy - weak paraspinal muscles cannot maintain the upright posture
LORDOSIS
What Is It?
Normal Ranges:
| Region | Normal Lordosis |
|---|---|
| Cervical | 20-40° |
| Lumbar | 40-60° (some sources 20-40°) |
Types / Causes of Lordosis
1. Hyperlordosis (Excessive Lordosis - "Swayback")
- Weak core and hip flexor tightness - the most common cause in otherwise healthy people; tight iliopsoas pulls the lumbar spine anteriorly
- Obesity and pregnancy - the added anterior weight shifts the centre of gravity forward; the lumbar spine compensates by increasing lordosis to maintain balance
- Spondylolisthesis - when one vertebra slips forward on the one below, it often increases lumbar lordosis
- Hip flexion contracture - a fixed hip flexion deformity (e.g., in hip OA) forces the pelvis to tilt anteriorly, which automatically increases lumbar lordosis
- Compensatory to thoracic kyphosis - if the thoracic spine is excessively kyphotic (hunched forward), the lumbar spine increases its lordosis to bring the body's centre of gravity back over the pelvis
- Buttocks protrude posteriorly
- Abdomen protrudes anteriorly
- Exaggerated lower back curve visible on inspection
2. Hypolordosis / Loss of Lordosis (Flat Back)
- Muscle spasm - the most acute cause; paraspinal muscle spasm from disc herniation or injury reflexively splints the spine in a straight position
- Degenerative disc disease - as discs lose height symmetrically, the normal lordosis flattens
- Post-surgical flat back - after long spinal fusions that inadvertently fuse the spine in a straight position, patients develop a forward-stooped posture (flat back syndrome) and significant disability
- Ankylosing spondylitis - can flatten or even reverse the lumbar lordosis
3. Cervical Lordosis Loss / Reversal
- Muscle spasm (acute disc herniation, whiplash)
- Degenerative cervical disc disease
- "Text neck" / chronic forward head posture (the weight of the head shifts forward of the cervical spine, reversing the curve over time)
- Post-surgical (after cervical laminectomy)
- Congenital fusion (Klippel-Feil)
How Kyphosis and Lordosis Interact - The Sagittal Balance Concept
- Increased thoracic kyphosis → increased lumbar lordosis (and often increased pelvic tilt) to compensate
- Loss of lumbar lordosis → compensatory thoracic kyphosis reduction, or hip/knee flexion
- Cervical kyphosis → compensatory increase in upper thoracic kyphosis or head extension
Quick Reference Summary Table
| Feature | Kyphosis | Lordosis |
|---|---|---|
| Direction | Posterior convexity (bows backward) | Anterior convexity (bows forward/inward) |
| Normal location | Thoracic spine, sacrum | Cervical spine, lumbar spine |
| Abnormal form | Hyperkyphosis ("hunchback") | Hyperlordosis ("swayback") or hypolordosis ("flatback") |
| Measured on | Lateral X-ray (sagittal plane) | Lateral X-ray (sagittal plane) |
| Key pathological types | Scheuermann's, congenital, osteoporotic, ankylosing spondylitis, TB gibbus | Hyperlordosis from obesity/hip flexor tightness; flat back from disc disease/surgery |
| Classic deformity name | Gibbus (angular TB kyphosis) | Swayback (lumbar hyperlordosis) |