from Guyton and Hall textbook of medical physiology, 4th South Asia edition write a 10 mark short note of the following questions. Device cardiac output and factors affecting it

Reading File
Finding Sources
Finding Sources
Finding Sources
Finding Sources
Reading File
Finding Sources
Reading File
Reading File
Reading File
Reading File
Reading File
Reading File
Loading Image
Searching Images

cardiac output curves Frank-Starling ventricular function diagram
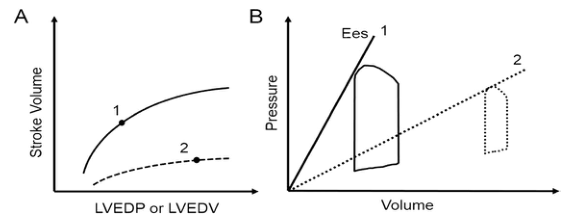
Summary : This figure compares cardiac function under two conditions using two types of plots: (A) the Frank-Starling relationship between stroke volume and left ventricular filling, and (B) pressure-volume loops with end-systolic elastance (Ees) lines.

line and schematic plot:
# Panel A: Frank-Starling Curve :
  • Y-axis: Stroke Volume (no units shown).
  • X-axis: LVEDP or LVEDV (Left Ventricular End-Diastolic Pressure or Volume; no units shown).
  • Two curves are shown:
    – Curve 1: Higher, solid line, labeled "1".
    – Curve 2: Lower, dashed line, labeled "2".
  • Each curve has a point marked (solid dot) on it.

# Panel B: Pressure-Volume Loop and End-Systolic Elastance :
  • Y-axis: Pressure (no units shown).
  • X-axis: Volume (no units shown).
  • Two pressure-volume loops:
    – Loop 1: Solid line, larger, leftward, labeled "1".
    – Loop 2: Dashed line, smaller, rightward, labeled "2".
  • Two Ees (end-systolic elastance) lines:
    – Ees 1: Steeper, solid line, labeled "1".
    – Ees 2: Less steep, dashed line, labeled "2".

# Design Encodings :
  • Solid lines for condition 1, dashed lines for condition 2.
  • Dots mark specific points on the curves in panel A.
  • Pressure-volume loops are outlined, with loop 2 shown as a dashed outline.

# Analysis :
  • Panel A shows that condition 1 (solid line) has a higher stroke volume for any given LVEDP/LVEDV compared to condition 2 (dashed line), indicating better cardiac function.
  • Panel B shows that condition 1 has a larger, leftward pressure-volume loop and a steeper Ees line, indicating greater contractility. Condition 2 has a smaller, rightward loop and a less steep Ees line, indicating reduced contractility.
  • The figure visually contrasts normal/enhanced versus impaired cardiac function using both stroke volume response and pressure-volume relationships.
Summary : This figure compares cardiac function under two conditions using two types of plots: (A) the Frank-Starling relationship between stroke volume and left ventricular filling, and (B) pressure-volume loops with end-systolic elastance (Ees) lines. line and schematic plot: # Panel A: Frank-Starling Curve : • Y-axis: Stroke Volume (no units shown). • X-axis: LVEDP or LVEDV (Left Ventricular End-Diastolic Pressure or Volume; no units shown). • Two curves are shown: – Curve 1: Higher, solid line, labeled "1". – Curve 2: Lower, dashed line, labeled "2". • Each curve has a point marked (solid dot) on it. # Panel B: Pressure-Volume Loop and End-Systolic Elastance : • Y-axis: Pressure (no units shown). • X-axis: Volume (no units shown). • Two pressure-volume loops: – Loop 1: Solid line, larger, leftward, labeled "1". – Loop 2: Dashed line, smaller, rightward, labeled "2". • Two Ees (end-systolic elastance) lines: – Ees 1: Steeper, solid line, labeled "1". – Ees 2: Less steep, dashed line, labeled "2". # Design Encodings : • Solid lines for condition 1, dashed lines for condition 2. • Dots mark specific points on the curves in panel A. • Pressure-volume loops are outlined, with loop 2 shown as a dashed outline. # Analysis : • Panel A shows that condition 1 (solid line) has a higher stroke volume for any given LVEDP/LVEDV compared to condition 2 (dashed line), indicating better cardiac function. • Panel B shows that condition 1 has a larger, leftward pressure-volume loop and a steeper Ees line, indicating greater contractility. Condition 2 has a smaller, rightward loop and a less steep Ees line, indicating reduced contractility. • The figure visually contrasts normal/enhanced versus impaired cardiac function using both stroke volume response and pressure-volume relationships.

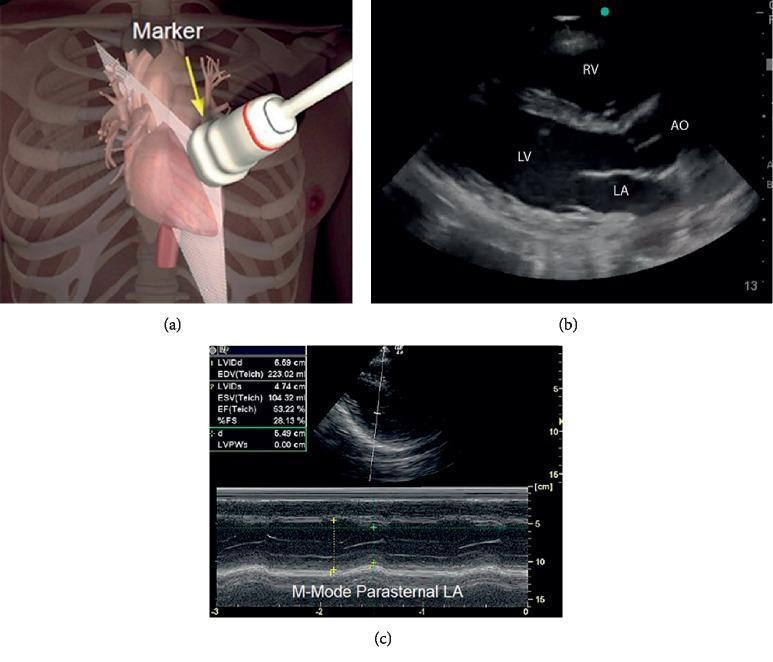
This composite educational graphic illustrates the procedure and output of a cardiac ultrasound examination. Panel (a) is an anatomical diagram showing a hand-held ultrasound transducer placed at the left parasternal position (4th-5th intercostal space) of a 3D chest model, with a yellow arrow indicating the probe marker. Panel (b) shows a corresponding 2D echocardiogram in a parasternal long-axis (PLAX) view, with visible cardiac structures labeled: Left Ventricle (LV), Right Ventricle (RV), Left Atrium (LA), and Aorta (AO). Panel (c) demonstrates an M-mode ultrasound capture at the level of the left atrium and left ventricle. This 1D imaging modality records cardiac wall motion and chamber dimensions over time. The image includes quantitative data for assessing systolic function, such as Ejection Fraction (EF by Teichholz method), Left Ventricular Internal Diameter at end-diastole (LVIDd) and end-systole (LVIDs), and Fractional Shortening (%FS). This visual set teaches the correlation between probe placement, spatial anatomical imaging, and temporal quantitative cardiac assessment.
This composite educational graphic illustrates the procedure and output of a cardiac ultrasound examination. Panel (a) is an anatomical diagram showing a hand-held ultrasound transducer placed at the left parasternal position (4th-5th intercostal space) of a 3D chest model, with a yellow arrow indicating the probe marker. Panel (b) shows a corresponding 2D echocardiogram in a parasternal long-axis (PLAX) view, with visible cardiac structures labeled: Left Ventricle (LV), Right Ventricle (RV), Left Atrium (LA), and Aorta (AO). Panel (c) demonstrates an M-mode ultrasound capture at the level of the left atrium and left ventricle. This 1D imaging modality records cardiac wall motion and chamber dimensions over time. The image includes quantitative data for assessing systolic function, such as Ejection Fraction (EF by Teichholz method), Left Ventricular Internal Diameter at end-diastole (LVIDd) and end-systole (LVIDs), and Fractional Shortening (%FS). This visual set teaches the correlation between probe placement, spatial anatomical imaging, and temporal quantitative cardiac assessment.

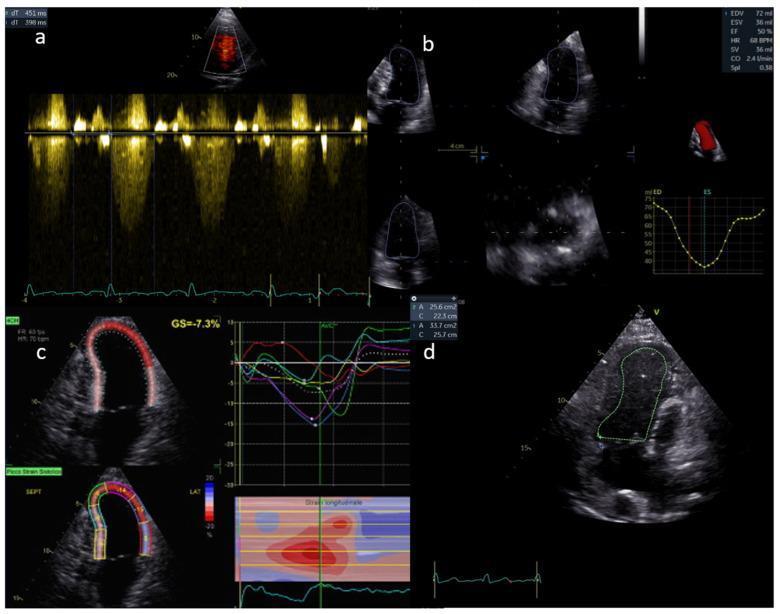
A multi-panel diagnostic image illustrating advanced echocardiographic techniques for ventricular function assessment. Panel (a) shows pulsed-wave Doppler flow across a valve, featuring a spectral waveform of velocity over time with an integrated ECG trace. Panel (b) demonstrates 3D echocardiography for volumetric analysis, including multiple plane views of the ventricle and a volume-time curve for calculating Ejection Fraction (EF). Panel (c) highlights myocardial deformation imaging through speckle-tracking echocardiography, showing Global Longitudinal Strain (GS = -7.3%) with corresponding segmental strain curves and a parametric 'bullseye' or heat map of regional wall motion. Panel (d) displays a 2D fractional area change (FAC) measurement, with the ventricular endocardial border traced at end-diastole and end-systole. These modalities are critical in pediatric cardiology and congenital heart disease for monitoring cardiac output, systolic function, and subclinical myocardial dysfunction.

A multi-panel diagnostic image illustrating advanced echocardiographic techniques for ventricular function assessment. Panel (a) shows pulsed-wave Doppler flow across a valve, featuring a spectral waveform of velocity over time with an integrated ECG trace. Panel (b) demonstrates 3D echocardiography for volumetric analysis, including multiple plane views of the ventricle and a volume-time curve for calculating Ejection Fraction (EF). Panel (c) highlights myocardial deformation imaging through speckle-tracking echocardiography, showing Global Longitudinal Strain (GS = -7.3%) with corresponding segmental strain curves and a parametric 'bullseye' or heat map of regional wall motion. Panel (d) displays a 2D fractional area change (FAC) measurement, with the ventricular endocardial border traced at end-diastole and end-systole. These modalities are critical in pediatric cardiology and congenital heart disease for monitoring cardiac output, systolic function, and subclinical myocardial dysfunction.

I have all the material needed. Now let me compile the comprehensive 10-mark short note based entirely on Guyton and Hall's Textbook of Medical Physiology.

Short Note: Cardiac Output and Factors Affecting It

(Based on Guyton and Hall Textbook of Medical Physiology, 4th South Asia Edition)

Definition

Cardiac output is the quantity of blood pumped into the aorta each minute by the heart. It is also the quantity of blood that flows through the circulation per minute. Because cardiac output is the sum of blood flows to all the tissues of the body, it is one of the most important factors in cardiovascular physiology.
Mathematically:
Cardiac Output (CO) = Stroke Volume (SV) × Heart Rate (HR)
Venous return is the quantity of blood flowing from the veins into the right atrium each minute. Under steady-state conditions, venous return and cardiac output must be equal to each other.

Normal Values

  • In young healthy men (~70 kg): ~5.6 L/min at rest
  • In women: approximately 15% lower (~4.9 L/min)
  • Average resting adult value (round figures): ~5 L/min
  • Cardiac Index = cardiac output per square meter of body surface area = ~3 L/min/m² (for a 70 kg adult with BSA ~1.7 m²)
  • The cardiac index peaks at age 10 (~4 L/min/m²) and declines to ~2.4 L/min/m² by age 80, reflecting declining metabolic activity and muscle mass with aging.

Cardiac Output Curves
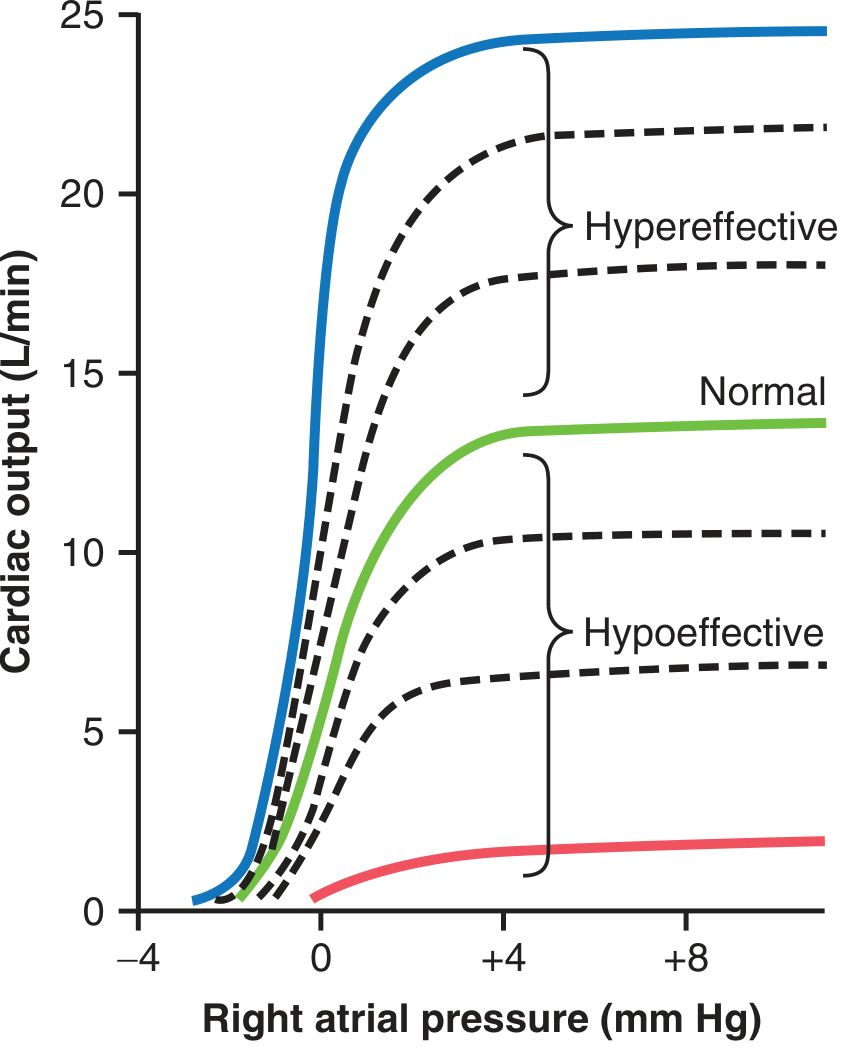
There are definite limits to the amount of blood the heart can pump, expressed as cardiac output curves (plotting cardiac output vs. right atrial pressure).
Cardiac output curves for normal, hypereffective, and hypoeffective hearts
Figure: Cardiac output curves for the normal heart (plateau ~13 L/min), hypereffective hearts (plateau up to ~25 L/min with maximal sympathetic stimulation), and hypoeffective hearts (severely depressed).
  • Normal heart plateau: ~13 L/min - about 2.5 times the normal resting output of 5 L/min
  • Hypereffective heart (maximal sympathetic stimulation): plateau up to ~25 L/min
  • Hypoeffective heart (e.g., severe cardiac disease): significantly depressed plateau

Factors Affecting Cardiac Output

A. Peripheral Factors (Primary Controllers - Venous Return)

Under most normal conditions, cardiac output is controlled primarily by peripheral factors that determine venous return. The heart has a built-in mechanism (Frank-Starling law) that allows it to automatically pump the blood that flows into it from the veins.
1. Local Tissue Metabolism and Blood Flow Cardiac output is the sum of all local tissue blood flows. Each tissue controls its own local blood flow in proportion to its metabolic needs. When overall metabolism increases (as in exercise), local vasodilation occurs throughout the body, increasing venous return and hence cardiac output. This is the most fundamental long-term regulator.
2. Blood Volume (Mean Systemic Filling Pressure) A sudden increase in blood volume of ~20% can increase cardiac output to 2.5 to 3 times normal by increasing the mean systemic filling pressure (Psf), which shifts the venous return curve to the right and raises right atrial pressure. Conversely, hemorrhage and dehydration reduce blood volume, decrease venous return, and lower cardiac output.
3. Total Peripheral Resistance (Vascular Resistance) Cardiac output and total peripheral resistance (TPR) share a reciprocal relationship. Conditions that chronically reduce TPR increase venous return and cardiac output:
  • Beriberi (thiamine deficiency): TPR may fall to half-normal, CO rises to twice normal
  • Arteriovenous fistula: blood bypasses the capillary bed, reducing TPR and increasing CO
  • Hyperthyroidism: elevated metabolism causes widespread vasodilation; CO may rise 40-80% above normal
  • Anemia: reduced blood viscosity and hypoxic vasodilation reduce TPR and raise CO
4. Resistance to Venous Return Factors that resist blood flow from peripheral veins back to the heart decrease venous return and lower cardiac output. Increased venous resistance (e.g., venous obstruction) shifts the venous return curve downward.

B. Cardiac Factors

5. Frank-Starling Mechanism of the Heart (Preload) The Frank-Starling mechanism is the intrinsic ability of the heart to adapt to increasing volumes of inflowing blood. When more blood flows into the heart, the cardiac muscle is stretched to a greater length. This brings the actin and myosin filaments to a more nearly optimal degree of overlap, producing a greater force of contraction. The ventricle therefore automatically pumps the extra blood into the aorta.
  • Within physiological limits: the heart pumps all the blood that returns to it by way of the veins.
  • Stretching of the right atrial wall also directly increases heart rate by 10-20% (and via the Bainbridge reflex, an additional 40-60%), augmenting output.
6. Sympathetic Nervous Stimulation and Parasympathetic Inhibition (Autonomic Control) Sympathetic stimulation combined with parasympathetic inhibition produces two effects that increase pumping effectiveness:
  1. Markedly increases heart rate - in young people, from ~72 beats/min up to 180-200 beats/min
  2. Increases myocardial contractility (strength of contraction) to approximately twice the normal level
Together, these can raise the cardiac output plateau to nearly twice normal (~25 L/min). Conversely, parasympathetic (vagal) stimulation slows the heart and reduces contractility, decreasing cardiac output.
7. Heart Rate Since CO = SV × HR, an increase in heart rate raises cardiac output, provided stroke volume does not fall proportionately (which can occur at very high rates when ventricular filling time is reduced).
8. Myocardial Contractility (Inotropic State) Factors that increase myocardial contractility (catecholamines, digitalis, sympathomimetics, hypercalcemia) shift the cardiac output curve upward (hypereffective). Factors that decrease contractility (myocardial infarction, myocarditis, acidosis, hypoxia, negative inotropes) shift the curve downward (hypoeffective).
9. Cardiac Hypertrophy A long-term increased workload, if not severe enough to damage the heart, causes the heart muscle to increase in mass and contractile strength in the same way as skeletal muscle hypertrophies with exercise. This can substantially increase the plateau of the cardiac output curve.
10. External Pressure on the Heart (Intrapleural Pressure / Cardiac Tamponade) External pressure changes shift the entire cardiac output curve to the right (requiring higher right atrial pressures to achieve the same output):
  • Cardiac tamponade (fluid in pericardial sac) markedly shifts the curve, severely limiting output
  • Positive-pressure ventilation shifts the curve to the right, reducing cardiac output
  • Negative-pressure breathing shifts the curve to the left, transiently increasing output

Conditions With Abnormally High or Low Cardiac Output

ConditionDirectionMechanism
ExerciseHighMetabolic vasodilation, sympathetic activation
HyperthyroidismHighPeripheral vasodilation, increased metabolism
AnemiaHighReduced viscosity, hypoxic vasodilation
A-V fistulaHighReduced total peripheral resistance
BeriberiHighImpaired tissue nutrient use, compensatory vasodilation
Myocardial infarctionLowReduced pumping effectiveness
Severe valvular diseaseLowObstruction or regurgitation
Cardiac tamponadeLowIncreased external cardiac pressure
Hemorrhagic shockLowReduced venous return

Equilibrium Analysis: Cardiac Output = Venous Return

The actual cardiac output at any moment is determined by the intersection (equilibrium point) of the cardiac output curve and the venous return curve (right atrial pressure axis). At the normal equilibrium point (point A), cardiac output = venous return = 5 L/min and right atrial pressure = 0 mm Hg. Any intervention that shifts either curve will alter both the cardiac output and the right atrial pressure until a new equilibrium is established.

Summary

Cardiac output is regulated by the integrated action of:
  • Peripheral factors (venous return, total peripheral resistance, blood volume, tissue metabolism) - the primary determinants under normal conditions
  • Cardiac factors (Frank-Starling mechanism, heart rate, myocardial contractility, autonomic innervation, external pressure)
The heart normally acts as a passive responder to venous return, automatically pumping whatever blood arrives via the Frank-Starling mechanism. Autonomous heart rate and contractility changes come into play especially during exercise, stress, and pathological states.

Reference: Guyton AC, Hall JE. Textbook of Medical Physiology, 4th South Asia Edition. Chapter 20: Cardiac Output, Venous Return, and Their Regulation.
This is a shared conversation. Sign in to Orris to start your own chat.