
ECG reading
Asking for Preferences
What aspect of ECG reading are you looking for?
ECG interpretation starts with understanding the waveforms, intervals, and how to calculate the cardiac axis. Let me pull detailed content from the medical library.
Searching sources...
Reading File
Finding Sources
Finding Sources
Finding Sources
Finding Sources
Good - I have several key sources. Let me read the most relevant ones in parallel - Goldman-Cecil (ECG waves), Costanzo Physiology (ECG basics), and Braunwald's (systematic reading).
Reading File
Reading File
Reading File
Excellent content. Now let me get the sections on normal values, axis calculation, and the ECG diagram image.
Reading File
Reading File
Loading Image
Now let me get the ECG grid standards diagram and read the Goldman-Cecil section on axis and normal intervals.
Loading Image
Finding Sources
Finding Sources
Finding Sources
Reading File
Reading File
Loading Image
I now have all the core content needed. Let me compile a thorough, well-illustrated answer.
Basic ECG Interpretation: Waves, Intervals, and Axis
The ECG Paper (Grid Standards)
The ECG is recorded on standard grid paper at a speed of 25 mm/sec:
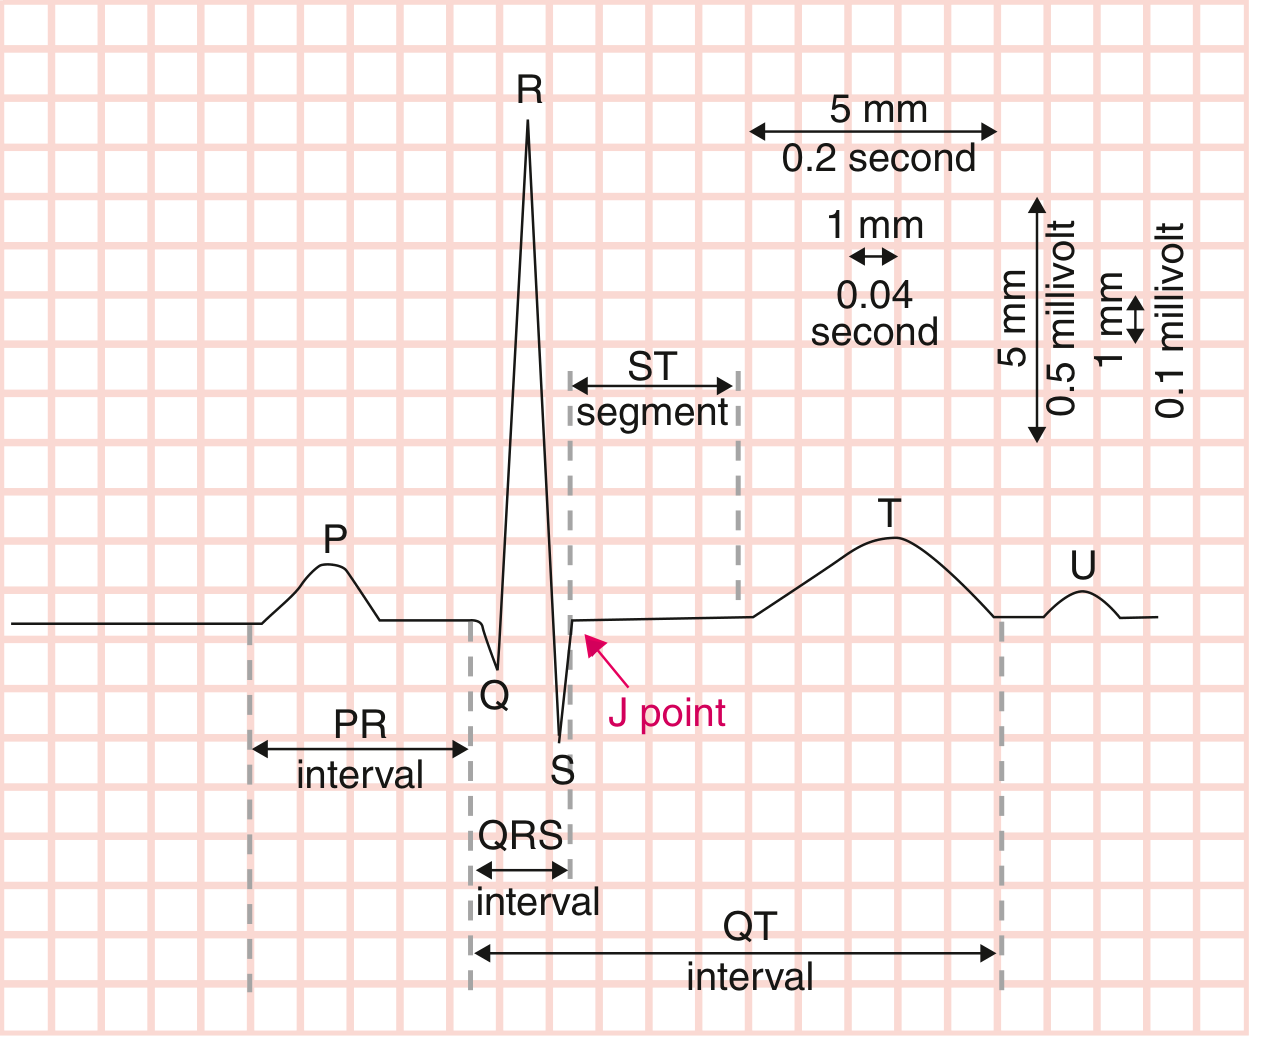
| Grid | Time | Voltage |
|---|---|---|
| Small box (1 mm) | 0.04 sec (40 ms) | 0.1 mV |
| Large box (5 mm) | 0.20 sec (200 ms) | 0.5 mV |
The Waveforms

P Wave
- Represents atrial depolarization
- Originates from the SA node in the high lateral right atrium
- Normal: upright in leads I and II, negative in aVR
- Duration correlates with atrial conduction time; broadening indicates slowed conduction
- Atrial repolarization is buried under the QRS and not visible on a normal ECG
PR Interval
- Measured from the start of the P wave to the start of the QRS
- Includes the P wave + isoelectric PR segment (AV node conduction delay)
- Normal: 120-200 ms (3-5 small boxes)
- A short PR (<120 ms) suggests pre-excitation (e.g. WPW); a long PR (>200 ms) = 1st degree AV block
- Sympathetic stimulation shortens it; parasympathetic stimulation lengthens it
QRS Complex
- Represents ventricular depolarization
- Q wave = first negative deflection before R
- R wave = first positive deflection
- S wave = negative deflection after R
- Despite the ventricles being much larger than the atria, QRS duration is similar to the P wave duration because the His-Purkinje system conducts much faster than atrial tissue
- Normal duration: 80-120 ms (2-3 small boxes); >120 ms = bundle branch block
- The J point marks the end of QRS and beginning of the ST segment
ST Segment
- Isoelectric (flat) segment between end of QRS (J point) and start of T wave
- Corresponds to the plateau phase of the ventricular action potential
- Elevation (>1 mm) = ischemia/infarction or pericarditis; Depression = ischemia or strain
T Wave
- Represents ventricular repolarization
- Normally upright in most leads (except aVR, sometimes V1)
- Peaked T waves = hyperkalemia; flattened/inverted = ischemia, hypokalemia, strain
QT Interval
- Measured from start of QRS to end of T wave
- Represents total ventricular depolarization + repolarization time
- Varies inversely with heart rate - must correct using QTc
- QTc formula (Bazett): QTc = QT ÷ √RR (in seconds)
- Upper normal limits: <460 ms in women, <450 ms in men
- Prolonged QT = risk of torsades de pointes
U Wave
- Small deflection after the T wave (not always seen)
- Most prominent in V2-V3; prominent U waves suggest hypokalemia or bradycardia
Heart Rate Calculation
From the ECG, heart rate can be quickly calculated:
| Method | How |
|---|---|
| 300 rule (regular rhythm) | Count large boxes between two R waves → divide 300 by that number |
| 1500 rule (regular rhythm) | Count small boxes between two R waves → divide 1500 |
| 6-second method (irregular) | Count QRS complexes in a 6-second strip × 10 |
Example: R-R interval = 4 large boxes → HR = 300/4 = 75 bpm
The 12 Leads
The 12-lead ECG views the heart from different angles:
Limb leads (frontal plane):
- Bipolar: I, II, III
- Augmented unipolar: aVR, aVL, aVF
Precordial leads (horizontal plane):
- V1 through V6, placed across the chest
Each lead is like a different camera angle on the same cardiac events. Lead II and aVF are best for P wave analysis; V1 is useful for rhythm assessment.
Cardiac Axis
The QRS axis reflects the overall direction of ventricular depolarization in the frontal plane.
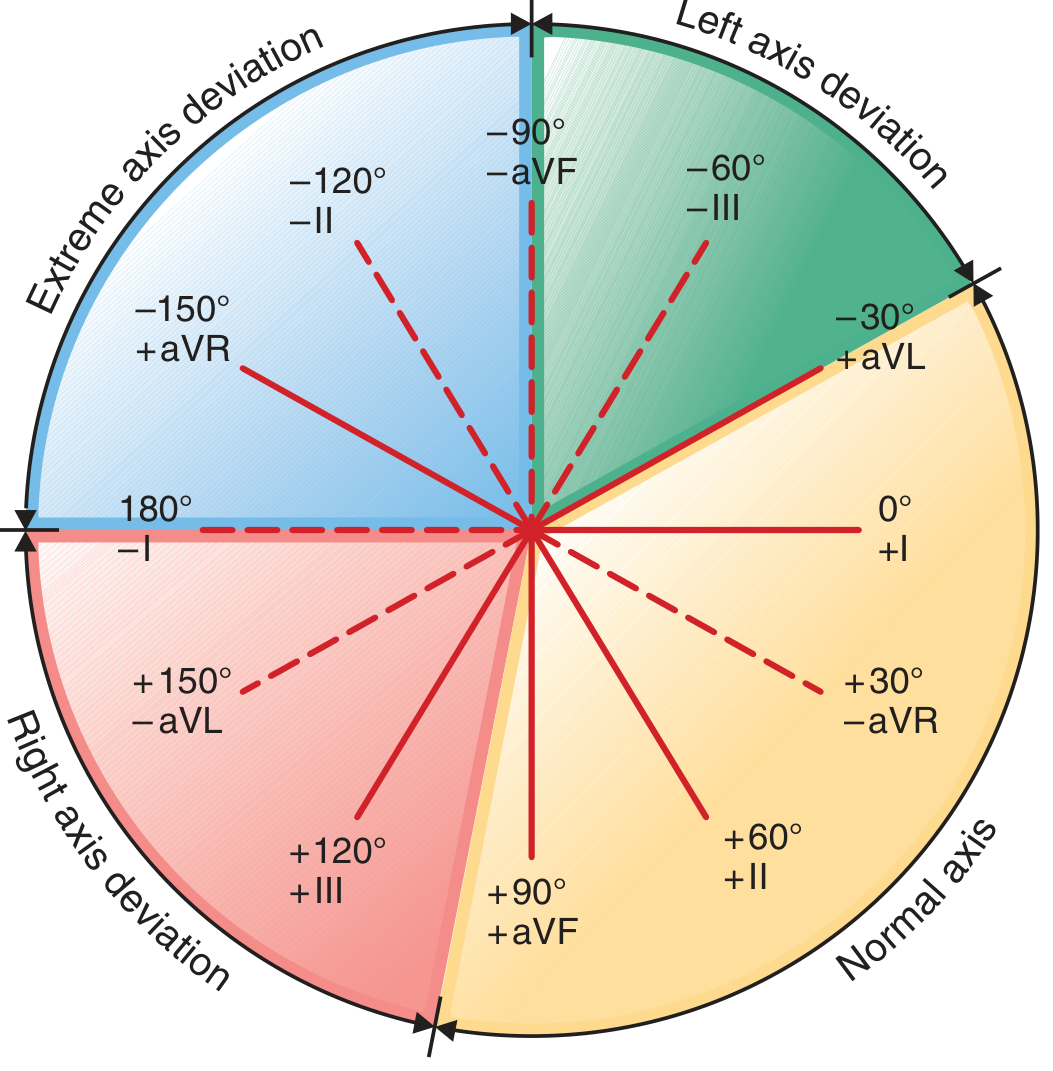
Normal Axis: 0° to +90°
- Lead I positive (QRS points left) + Lead aVF positive (QRS points down) = normal axis
Quick axis method using Leads I and aVF:
| Lead I | aVF | Axis |
|---|---|---|
| Positive | Positive | Normal (0° to +90°) |
| Positive | Negative | Left axis deviation (-30° to -90°) |
| Negative | Positive | Right axis deviation (+90° to +180°) |
| Negative | Negative | Extreme axis deviation (-90° to ±180°) |
Clinical causes of axis deviation:
Left Axis Deviation (more negative than -30°):
- Left anterior fascicular block
- Left ventricular hypertrophy
- Inferior MI
- WPW syndrome (right-sided accessory pathway)
Right Axis Deviation (more positive than +90°):
- Right ventricular hypertrophy
- Left posterior fascicular block
- Pulmonary embolism / cor pulmonale
- Dextrocardia
- Normal in children and thin young adults
Normal ECG Values at a Glance
| Parameter | Normal Range |
|---|---|
| Heart rate | 60-100 bpm |
| P wave duration | <120 ms (<3 small boxes) |
| PR interval | 120-200 ms (3-5 small boxes) |
| QRS duration | <120 ms (<3 small boxes) |
| QT interval (QTc) | <450 ms (men), <460 ms (women) |
| P axis (frontal) | 0° to +75° (upright in I and II) |
| QRS axis | -30° to +90° |
Systematic Approach to Reading an ECG
A reliable order to avoid missing findings:
- Rate - count QRS complexes or use large-box method
- Rhythm - regular or irregular? Is there a P before every QRS?
- Axis - check leads I and aVF
- P waves - morphology, axis, one per QRS?
- PR interval - short, normal, or prolonged?
- QRS duration - narrow or wide (bundle branch block)?
- ST segment - elevation or depression?
- T waves - upright, inverted, peaked?
- QT interval - calculate QTc
- U waves - present or absent?
Sources: Goldman-Cecil Medicine, 26e | Costanzo Physiology, 7e | Harrison's Principles of Internal Medicine, 22e | Braunwald's Heart Disease, 12e
This is a shared conversation. Sign in to Orris to start your own chat.