
What can happen if someones wbc and platelets are low
low WBC and low platelets causes complications pancytopenia
pancytopenia bone marrow failure blood cells diagram
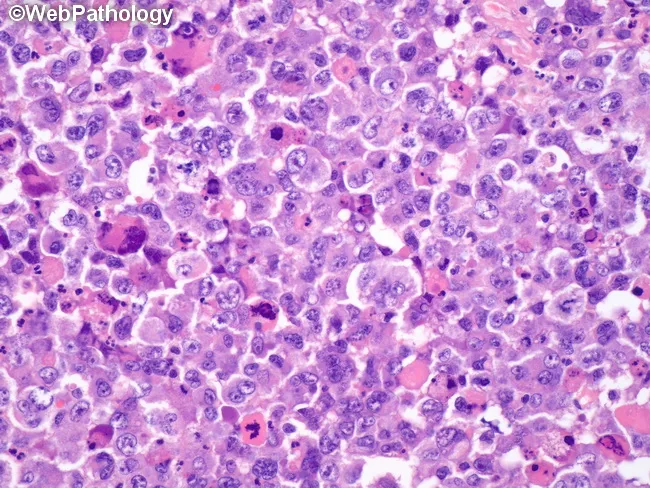
This is a high-magnification brightfield histology image of a hematopoietic tissue section stained with Hematoxylin and Eosin (H&E). The sample appears to be bone marrow with cellularity markedly increased and effacement of normal marrow architecture by an expansive population of immature hematopoietic cells. The predominant cells are blasts or blast-like cells with high nuclear-to-cytoplasmic ratio, rounded to oval nuclei, finely to coarsely stippled chromatin, and prominent nucleoli in several cells. Cytoplasm is scant to variable; mitotic figures are occasionally seen. Background elements such as mature erythroid, myeloid, and megakaryocytic precursors are reduced or obscured. Occasional macrophages and debris can be identified; there is no clear architectural adipose framework visible. Auer rods are not definitively seen in this field. The morphological pattern is compatible with an acute hematologic neoplasm, most consistent with acute leukemia or high-grade lymphoblastic/lymphoid proliferation; definitive classification requires immunophenotyping (flow cytometry), cytogenetics, and molecular testing. Clinically, such findings correlate with bone marrow failure symptoms (pancytopenia) and systemic signs like fever; differential includes AML, ALL, mixed-phenotype leukemia, and high-grade lymphoma with marrow involvement. This image is valuable for educational reference, diagnostic differential, and serves as a teaching exemplar for hematopathology board review.
A medical illustration depicting the recruitment and differentiation of bone marrow-derived cells for the treatment of Alzheimer's disease. The diagram is divided into three sections: Bone Marrow, Blood, and Brain. It shows the progression of hematopoietic cells (round with large blue nuclei) from the bone marrow into the systemic circulation as bone marrow-derived cells, and finally into the brain parenchyma. In the brain, these cells differentiate into bone marrow-derived microglia (BMDM), visualized as green, ramified cells with multiple irregular cytoplasmic protrusions. The BMDM are shown interacting with a red, star-shaped amyloid-beta (Ạβ) plaque, with an arrow indicating 'clearance.' Two text boxes summarize pharmacological interventions: the first lists HCT, SDF-1, and G-CSF/AMD3100 for stimulating recruitment; the second lists M-CSF and Glatiramer acetate for promoting Ạβ clearance. This diagram illustrates the cellular pathway and potential therapeutic targets for enhancing immune-mediated amyloid degradation in the central nervous system.
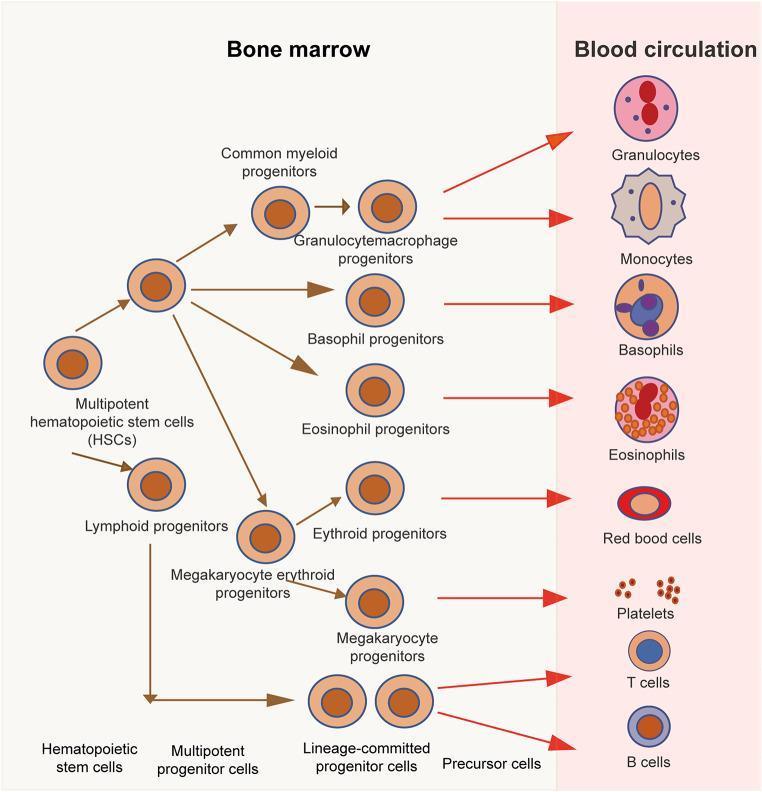
An educational flow diagram illustrating the process of human hematopoiesis, demonstrating the differentiation of hematopoietic stem cells (HSCs) into mature blood cells. The diagram is divided into two primary compartments: Bone Marrow (left, light beige background) and Blood Circulation (right, light pink background). The process begins with multipotent HSCs, which transition through several stages including multipotent progenitor cells, lineage-committed progenitor cells (such as common myeloid, lymphoid, and megakaryocyte-erythroid progenitors), and precursor cells. The terminal stage shows fully differentiated cells entering the blood circulation, including granulocytes (multilobed nuclei), monocytes (kidney-bean nuclei), basophils (blue granules), eosinophils (red granules), red blood cells (enucleated), platelets (fragments from megakaryocytes), and T/B lymphocytes. While progenitor cells are depicted with uniform morphology (large central nuclei and light brown cytoplasm), the mature cells exhibit distinct staining characteristics and nuclear shapes critical for hematological identification. This diagram serves as a clinical algorithm for understanding myeloid and lymphoid lineage development.
Low WBC + Low Platelets: What It Means and What Can Happen
The Two Main Dangers
1. Increased Risk of Infection (from low WBC / leukopenia)
- Bacteria, fungi, and viruses can multiply unchecked
- Infections that a healthy immune system would fight off easily can become life-threatening
- Fever with leukopenia is a medical emergency (called febrile neutropenia)
- Common sites of infection: lungs (pneumonia), blood (sepsis), gut, urinary tract
2. Bleeding Risk (from low platelets / thrombocytopenia)
- Easy bruising and prolonged bleeding from minor cuts
- Spontaneous nosebleeds, gum bleeds, blood in urine or stool
- At very low counts (below ~20,000/µL), spontaneous internal bleeding and intracranial hemorrhage become real risks
Why Do Both Drop at the Same Time?
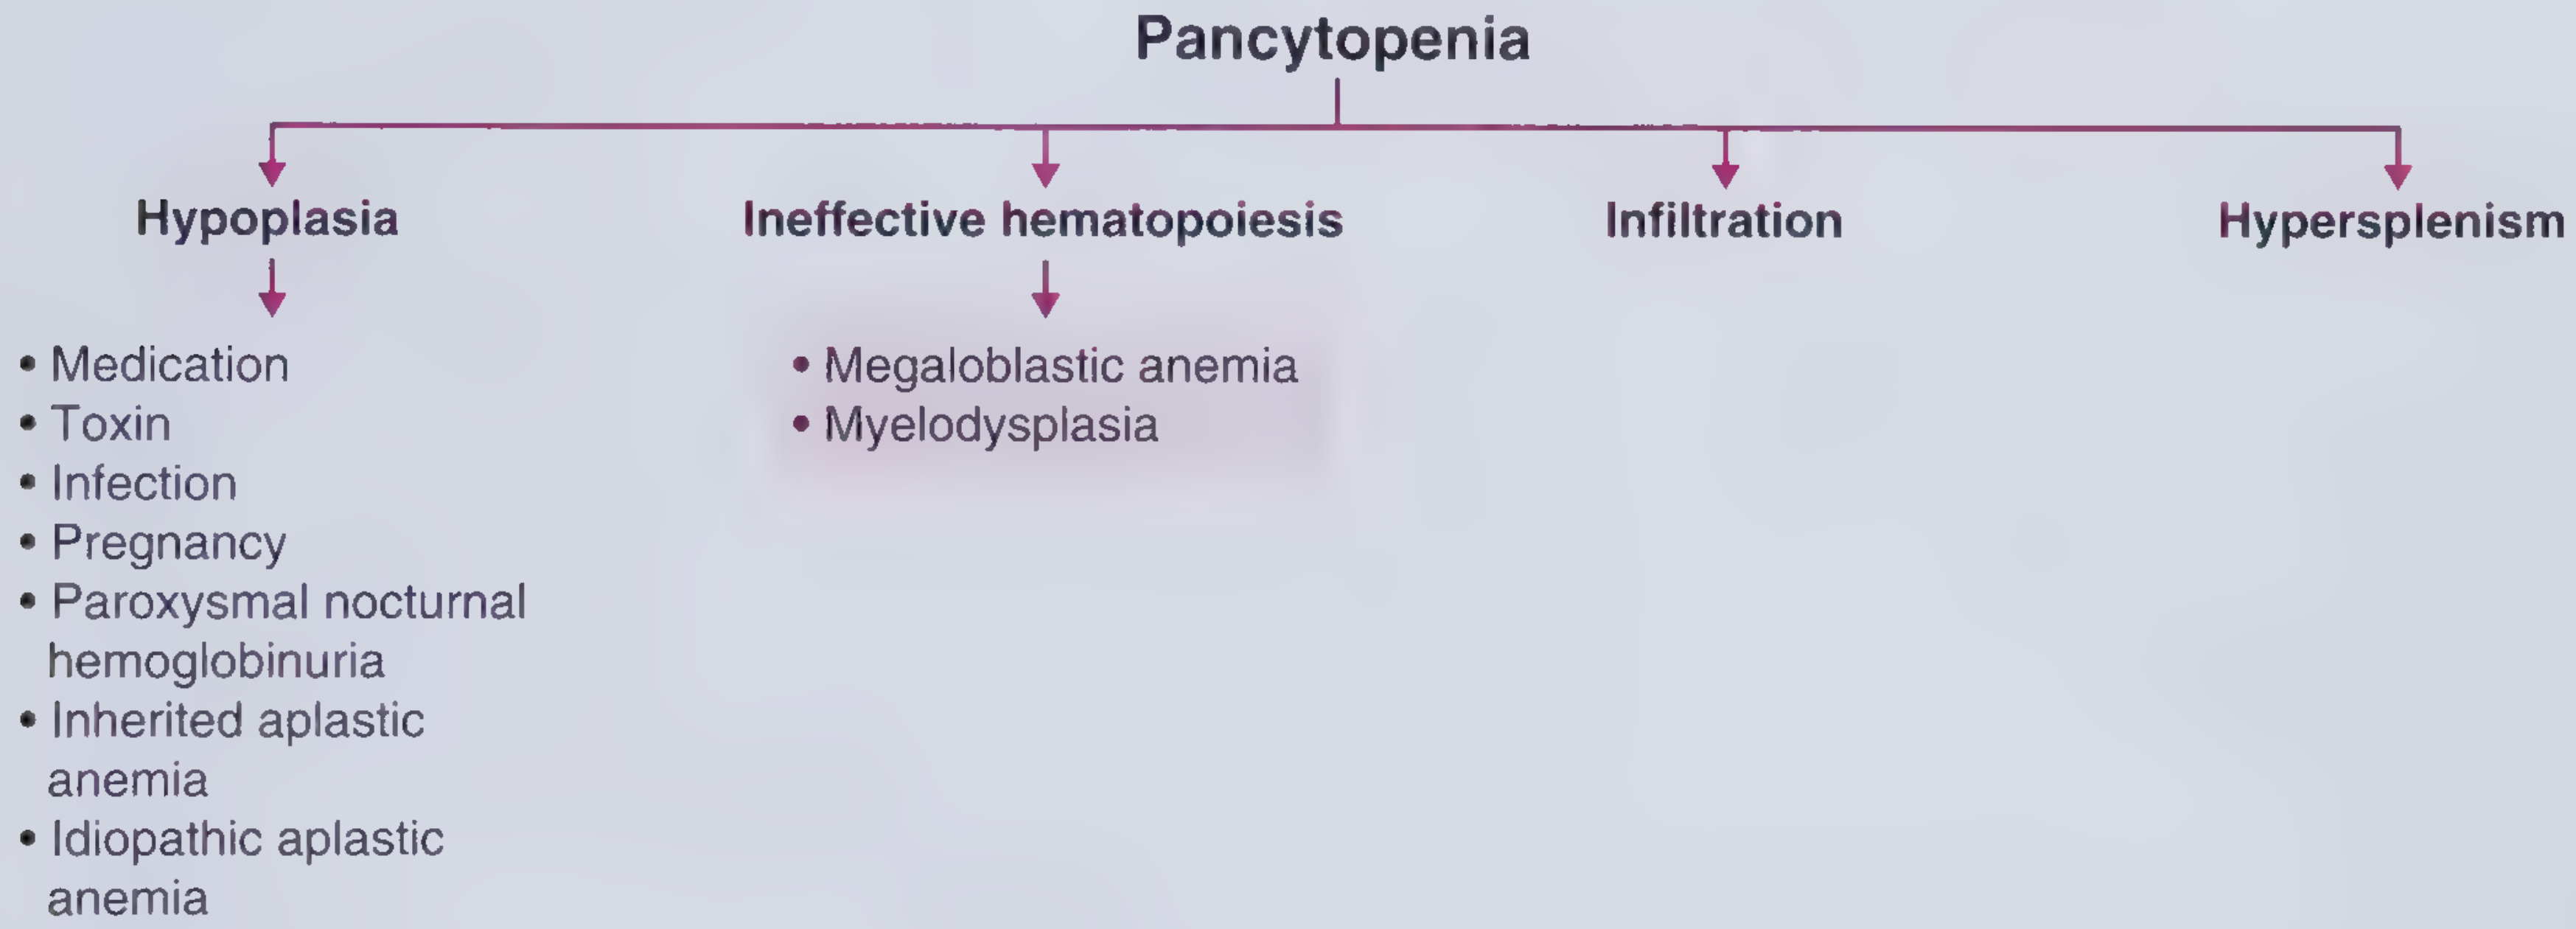
- Medications: chemotherapy, antibiotics (chloramphenicol), anticonvulsants (carbamazepine), NSAIDs, antithyroid drugs, immunosuppressants (azathioprine, mycophenolate)
- Toxins: alcohol, benzene, arsenic, radiation exposure, insecticides
- Infections: HIV, Epstein-Barr virus (EBV), cytomegalovirus (CMV), parvovirus B19, hepatitis (seronegative), dengue, miliary TB
- Aplastic anemia (idiopathic or inherited) - bone marrow simply fails
- Pregnancy (rare)
- Paroxysmal nocturnal hemoglobinuria (PNH)
- Megaloblastic anemia: vitamin B12 or folate deficiency causes enlarged, abnormal cells that die before being released - the most common cause of pancytopenia in the developing world
- Myelodysplastic syndrome (MDS): abnormal cellular maturation; can progress to leukemia
- Leukemia (AML, ALL, CLL, CML)
- Lymphoma
- Myeloma
- Metastatic solid tumors (breast, prostate, lung)
- Myelofibrosis
Other Specific Causes to Know About
| Cause | Notes |
|---|---|
| Lupus (SLE) | Autoimmune destruction; cytopenias are a diagnostic criterion |
| Viral infections (dengue, EBV, CMV, HIV) | Direct marrow suppression or triggering HLH |
| Sepsis / overwhelming bacterial infection | Multifactorial - marrow suppression + DIC |
| Hemophagocytic Lymphohistiocytosis (HLH) | Life-threatening; immune cells eat blood cells; caused by infections, cancer, autoimmune disease |
| DIC (Disseminated Intravascular Coagulation) | Platelets consumed by widespread clotting; WBCs drop in sepsis context |
| Vitamin B12 / Folate deficiency | Megaloblastic; macrocytic anemia + low WBC + low platelets |
| Alcohol abuse | Directly toxic to marrow + causes folate deficiency + splenomegaly |
| Chemotherapy / radiation | Expected side effect; marrow suppression |
Symptoms to Watch For
- Repeated or unusual infections
- Fever (especially with no obvious source)
- Mouth sores, sore throat
- Unexplained bruising (ecchymosis)
- Petechiae (tiny red/purple dots on skin)
- Prolonged bleeding from cuts
- Nosebleeds, bleeding gums
- Blood in urine (pink/red) or stool (black/tarry)
- In severe cases: vision changes or headache (bleeding near eye or brain)
What Doctors Do About It
- Complete blood count (CBC) with differential - quantify how low each cell line is
- Peripheral blood smear - look at cell shape for clues (blasts = leukemia; hypersegmented neutrophils = B12/folate deficiency; tear-drop cells = myelofibrosis)
- Bone marrow aspiration and biopsy - definitive test for most causes
- Additional labs: B12/folate levels, liver enzymes, viral panels (HIV, EBV, CMV, hepatitis), autoimmune markers (ANA, anti-dsDNA)
Explain as you are explaining a kid
Your Blood Has Tiny Workers Inside It! 🩸
Meet the Workers
🛡️ The White Blood Cell Guards
🩹 The Platelets - The Patch-Up Crew
So What Happens When There Aren't Enough of Them?
Not Enough Soldiers (Low WBC) 🛡️➡️😟
- The bad guys (germs) walk right in and nobody stops them
- You get sick way more easily - even a small cold can turn into something really serious
- Your body can't fight back properly
- Doctors worry a LOT when someone with low soldiers gets a fever, because it means the germs might be winning
Not Enough Patch-Up Crew (Low Platelets) 🩹➡️😟
- A tiny bump makes a huge bruise
- A small cut bleeds for a really long time
- Little red or purple dots appear on the skin (like tiny ink dots) - these are called petechiae
- In really serious cases, bleeding can happen inside the body where you can't even see it - and that's very dangerous
Why Would Both Groups Go Missing?
| What Breaks the Factory | Simple Explanation |
|---|---|
| Certain medicines | Some medicines meant to help accidentally tell the factory to slow down |
| Viruses (like HIV, EBV, dengue) | Sneaky viruses can damage the factory from the inside |
| Cancer (like leukemia) | Bad cells move into the factory and take up all the space, pushing good workers out |
| Not enough vitamins (B12, folate) | The factory needs vitamins like fuel - no fuel, no workers! |
| Too much alcohol (in adults) | Poisons the factory over time |
| The spleen being too big | The spleen is like a recycling center - if it gets too big, it starts throwing away GOOD workers too early |
What Does the Doctor Do? 🩺
- Take a little blood and look at it under a microscope to count the workers
- Look at the shape of the workers - weird shapes give clues about what's wrong
- Sometimes take a tiny sample from inside the bone to look directly at the factory (this sounds scary but doctors do it carefully!)
- Fix whatever broke the factory - give vitamins if it's a deficiency, stop a bad medicine, or treat an infection
The Big Picture 🌟
No soldiers + no patch-up crew = your body can't fight enemies AND can't fix injuries at the same time.
Edema
edema causes types pathophysiology clinical features treatment
pitting edema legs ankles swelling
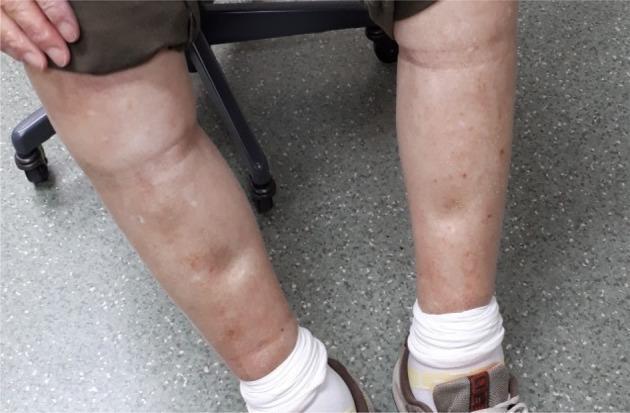
Clinical photograph of a patient's lower extremities demonstrating severe peripheral pitting edema. The legs show significant symmetrical swelling from the pretibial region down to the ankles, resulting in a loss of normal anatomical contours. A clear indentation (pitting) is visible on the medial aspect of the left leg where manual pressure was applied, characteristic of pitting edema. The overlying skin appears taut, shiny, and exhibits diffuse hyperpigmentation with scattered brownish macules and focal areas of hypopigmentation. The photograph illustrates a common adverse effect associated with BRAF/MEK inhibitor therapy (e.g., dabrafenib and trametinib) in the treatment of malignancies such as lung adenocarcinoma. The image is framed against a clinical background including a medical stool and the patient wearing white socks and athletic shoes, providing context for an outpatient or inpatient clinical assessment of Grade 3 edema.
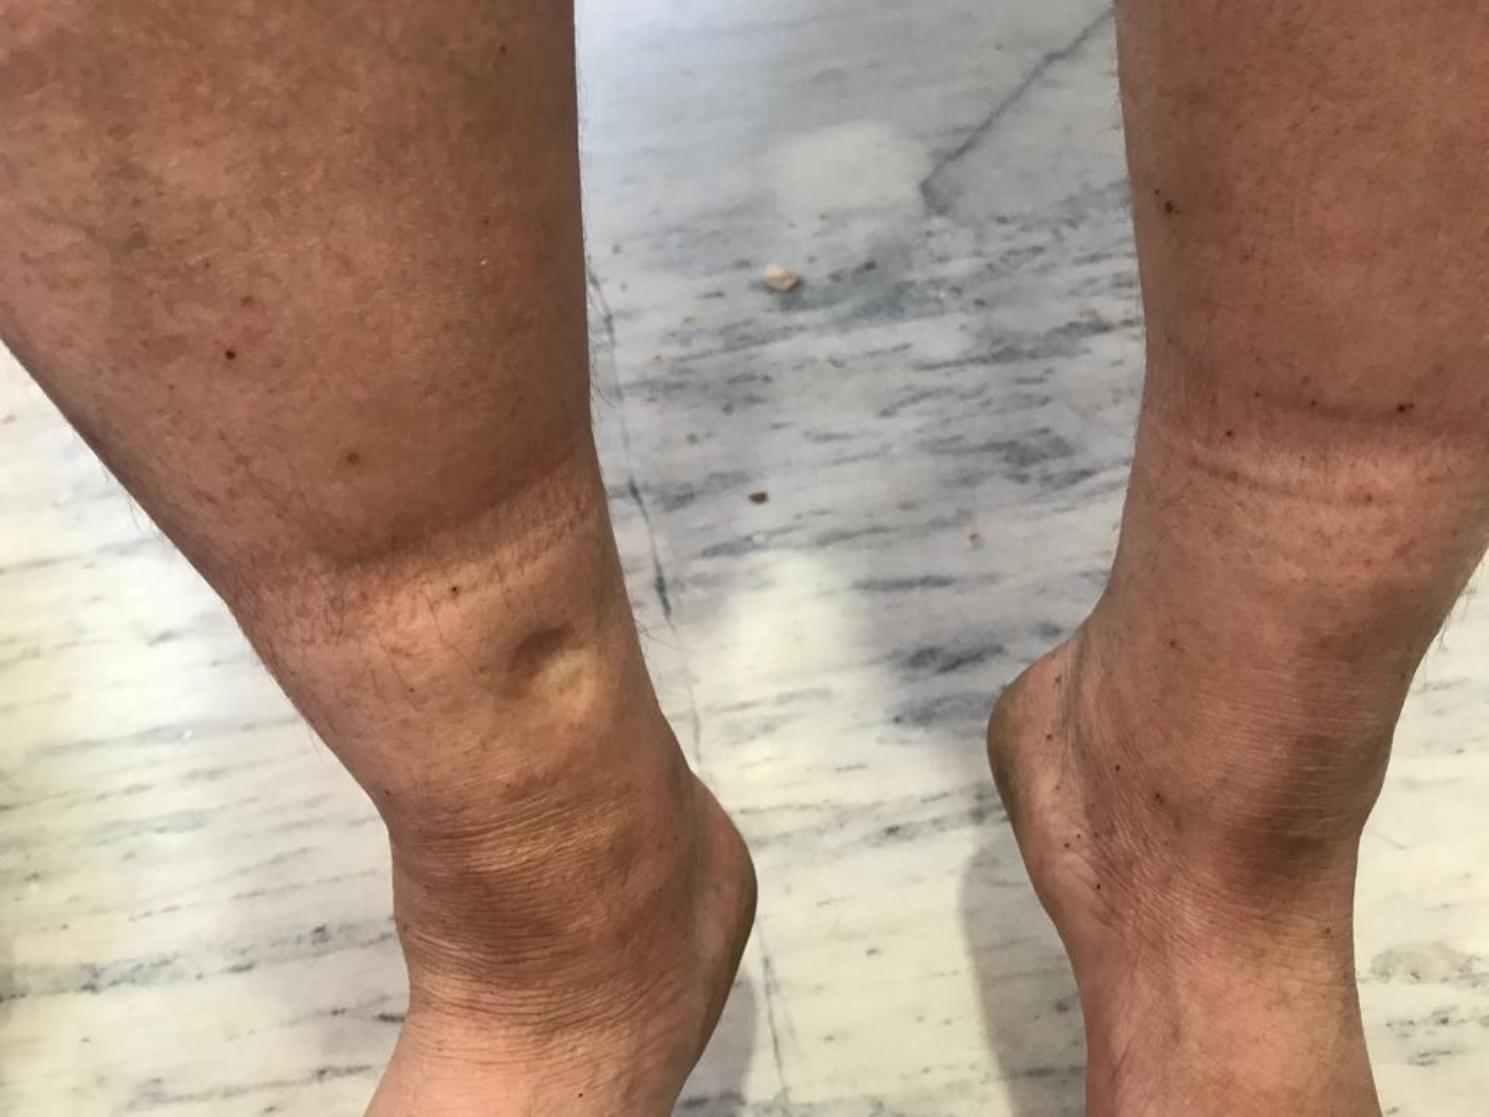
This clinical photograph displays bilateral pedal edema in the lower extremities. The image focuses on the distal legs and ankles, demonstrating significant swelling and tautness of the skin. A key diagnostic feature is visible on the anterior aspect of the lower leg, where a localized indentation or 'pit' remains after pressure was applied, characteristic of pitting edema. The skin shows slight discoloration with scattered hyperpigmented macules and a horizontal band of lighter pigmentation above the malleoli, possibly indicating chronic pressure from footwear or hosiery. The overall presentation is a classic clinical representation used in internal medicine and cardiology to illustrate fluid retention and systemic volume overload. The educational focus is on the assessment of peripheral edema and the visual identification of the 'pitting' sign in a clinical examination context.
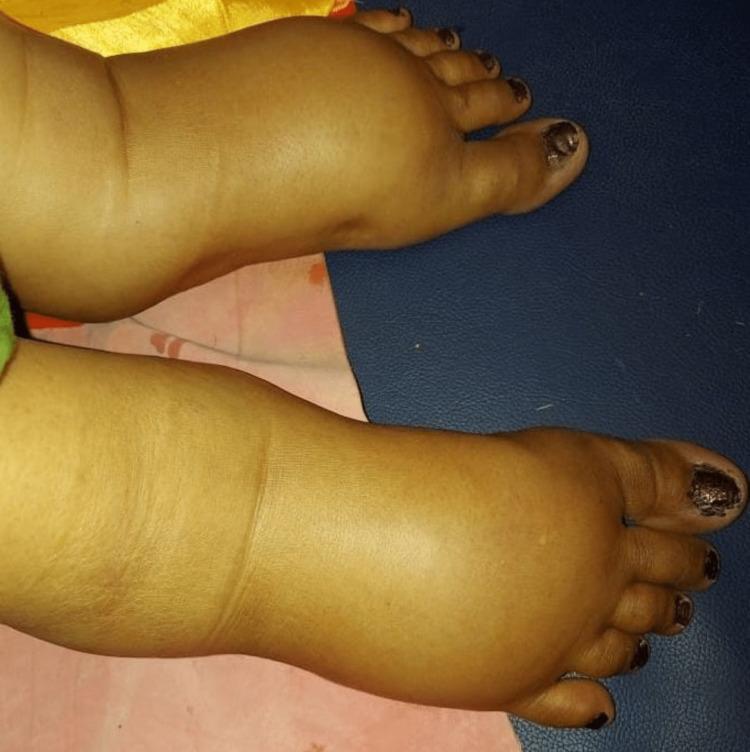
Clinical photograph showing severe, bilateral pedal edema in a pregnant patient. The image displays the dorsum of both feet and the ankles, which exhibit significant swelling characterized as grade 3 pitting edema. There is a notable loss of normal anatomical landmarks, with the bony prominences of the medial and lateral malleoli completely obscured by fluid accumulation. The skin appears stretched, shiny, and demonstrates a slight yellowish discoloration. The swelling extends from the toes to the lower legs, with visible distension of the soft tissues. This finding is clinically relevant in the context of systemic diseases during pregnancy, such as preeclampsia or infectious etiologies like leptospirosis, as it indicates significant fluid retention and potential multi-organ involvement.
🌊 Edema - Explained Like You're a Kid!
What is Edema?
🚰 How Does Your Body Normally Keep Fluid in the Right Place?
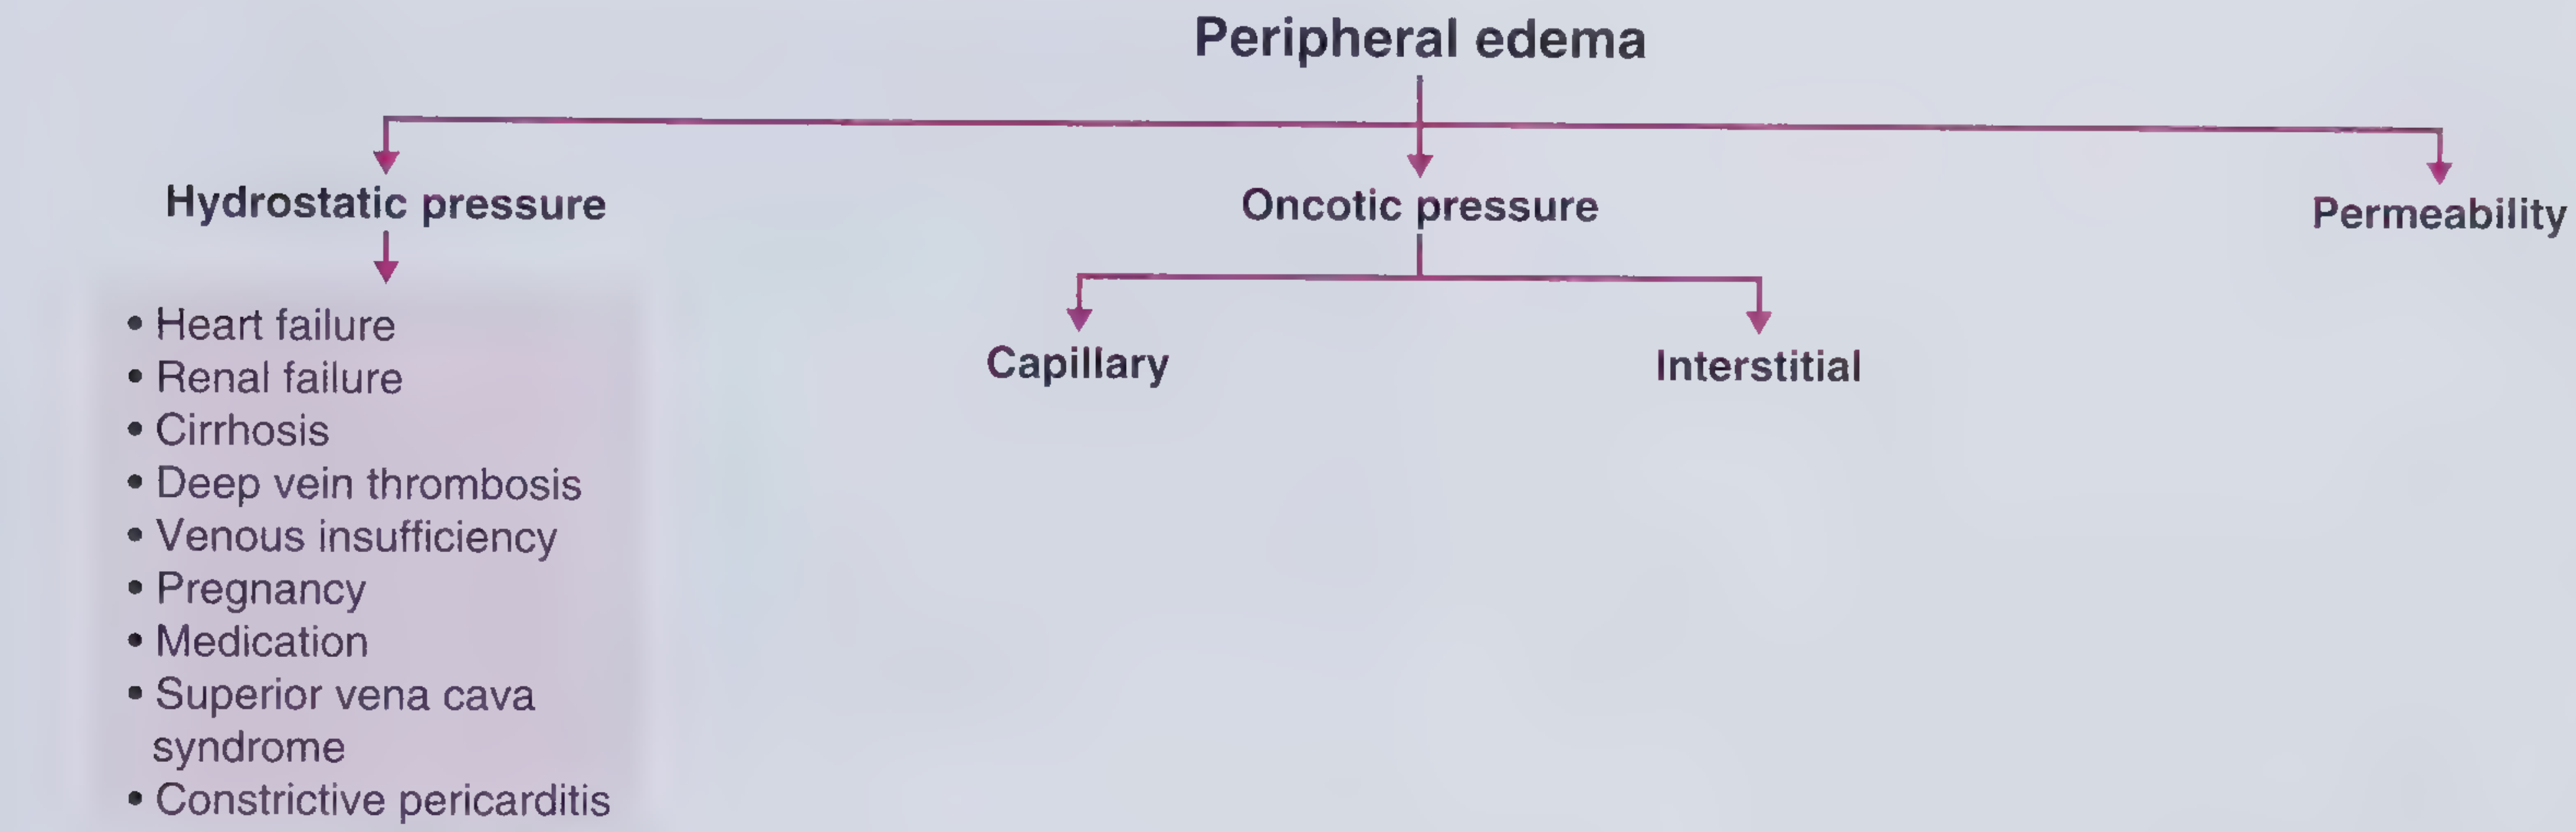
- Hydrostatic pressure - like water pressure pushing fluid OUT of the hose into the tissues
- Oncotic pressure - proteins in the blood acting like a sponge, pulling fluid BACK IN
👀 What Does Edema Look Like?
📍 Where Can Edema Happen?
| Where | Medical Name | What Happens |
|---|---|---|
| Legs, ankles, feet | Peripheral edema | Feet look puffy, socks leave marks, hard to put on shoes |
| Lungs | Pulmonary edema | Fluid fills the air sacs - makes it very hard to breathe, like drowning slowly |
| Brain | Cerebral edema | Very dangerous - can cause headache, confusion, seizures |
| Belly | Ascites | Belly blows up like a balloon with fluid |
| Chest cavity | Pleural effusion | Fluid around the lungs, causes breathlessness |
| All over the body | Anasarca | Massive, whole-body swelling - very serious |
🔍 Why Does Edema Happen? (The Causes)
1. Too Much Pressure Pushing Fluid Out 🫀
- Heart failure - the heart can't pump properly, so blood backs up and pressure builds in the veins. The legs swell, usually both sides equally, soft and pitting
- Deep vein thrombosis (DVT) - a clot blocks a vein in the leg, pressure builds behind it. Usually one leg only, with pain and redness - this is a medical emergency
- Chronic venous insufficiency - the valves inside leg veins get floppy and don't close properly, so blood pools in the lower legs
- Pregnancy - the growing baby squeezes the big veins in the belly, raising pressure in leg veins. Half of all pregnant women get ankle swelling!
2. Not Enough Protein in the Blood 🥚
- Nephrotic syndrome (kidney disease) - the kidneys leak protein into the urine instead of keeping it in the blood
- Liver cirrhosis - the liver makes most blood proteins; a damaged liver can't make enough
- Malnutrition / starvation - not eating enough protein means there's none to put in the blood. This is why severely malnourished children get swollen bellies
3. Blocked Lymph Drainage Pipes 🚰
- Cancer (especially lymphoma) blocking lymph nodes
- Surgery or radiation that damages lymph vessels
- Filariasis - a parasitic worm infection (common in tropical countries) that blocks lymph vessels, causing massive limb swelling called elephantiasis
4. Leaky Blood Vessel Walls 🕳️
- Allergic reactions (like anaphylaxis or angioedema - sudden facial/throat swelling)
- Burns or injury
- Severe infections / sepsis
- Inflammation from any cause
💊 Common Medications That Cause Edema
- Calcium channel blockers (amlodipine) - used for high blood pressure
- NSAIDs (ibuprofen, naproxen) - make kidneys hold on to salt and water
- Steroids (prednisone)
- Certain diabetes drugs (thiazolidinediones)
⚠️ When is Edema Dangerous?
- Sudden one-leg swelling with pain - could be a blood clot (DVT)
- Sudden breathlessness + leg swelling - could be a clot that moved to the lungs (pulmonary embolism)
- Pulmonary edema (fluid in the lungs) - feels like you can't breathe, you may cough up pink frothy sputum
- Cerebral edema (brain swelling) - sudden headache, confusion, vision changes, seizures
- Facial/throat swelling after exposure to food or a sting - severe allergic reaction
🩺 How Do Doctors Investigate It?
- Press the swelling - does it pit? How much?
- Check both legs - one side or both? (One side = more likely a clot or local problem; both sides = more likely heart, kidney, or liver)
- Listen to the heart and lungs
- Blood tests - protein levels, kidney function, liver function, heart markers
- Urine test - checking for protein (to look for nephrotic syndrome)
- Ultrasound - check for blood clots in veins, look at the heart
- Chest X-ray - check for fluid in the lungs
💡 Treatment Depends on the Cause
| Cause | Treatment |
|---|---|
| Heart failure | Diuretics ("water pills" like furosemide), restrict salt and fluid |
| Kidney failure | Dialysis to remove fluid, dietary restriction |
| Nephrotic syndrome | Treat underlying kidney disease, diuretics |
| DVT | Blood thinners (anticoagulants) |
| Chronic venous insufficiency | Compression stockings, elevate legs |
| Lymphedema | Compression therapy, specialized massage |
| Malnutrition | Fix the protein/nutritional deficiency |
| Medication side effect | Stop or swap the offending drug |
| Allergic angioedema | Antihistamines, steroids, epinephrine if severe |
The Simple Summary 🎯
Edema = fluid escaping from blood vessels and getting stuck in body tissues, causing swelling. It is always a symptom pointing to something else - the real job is figuring out WHY the fluid is leaking, because that tells you what to treat.
A patient feeling breathlessness from last night has normal spo2 what will be the problem
dyspnea breathlessness normal oxygen saturation SpO2 causes differential diagnosis
dyspnea differential diagnosis algorithm flowchart
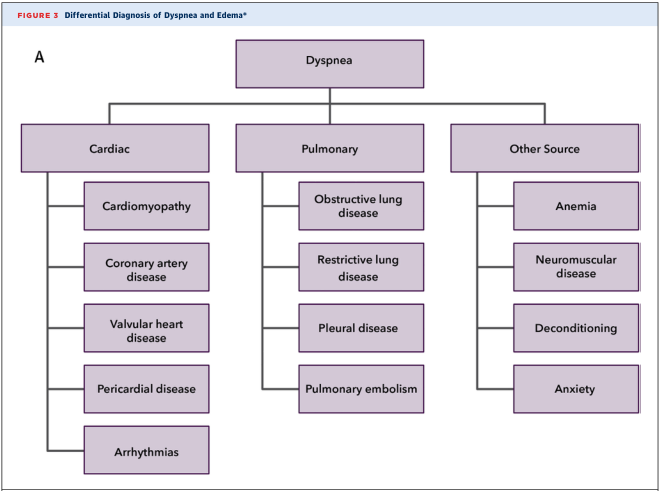
Summary : This figure presents a differential diagnosis flowchart for dyspnea, categorizing possible causes into cardiac, pulmonary, and other sources, and further subdividing each category into specific conditions. flowchart: # Nodes : • Dyspnea (rectangle, top-level) • Cardiac (rectangle, second-level, left branch) – Cardiomyopathy (rectangle) – Coronary artery disease (rectangle) – Valvular heart disease (rectangle) – Pericardial disease (rectangle) – Arrhythmias (rectangle) • Pulmonary (rectangle, second-level, middle branch) – Obstructive lung disease (rectangle) – Restrictive lung disease (rectangle) – Pleural disease (rectangle) – Pulmonary embolism (rectangle) • Other Source (rectangle, second-level, right branch) – Anemia (rectangle) – Neuromuscular disease (rectangle) – Deconditioning (rectangle) – Anxiety (rectangle) # Connectors : • Dyspnea splits into three branches: Cardiac, Pulmonary, Other Source. • Cardiac connects downward to five conditions: Cardiomyopathy, Coronary artery disease, Valvular heart disease, Pericardial disease, Arrhythmias. • Pulmonary connects downward to four conditions: Obstructive lung disease, Restrictive lung disease, Pleural disease, Pulmonary embolism. • Other Source connects downward to four conditions: Anemia, Neuromuscular disease, Deconditioning, Anxiety. # Layout : • Hierarchical, top-down arrangement. • Three main branches (Cardiac, Pulmonary, Other Source) horizontally aligned under Dyspnea. • Each branch fans out vertically to its respective subcategories. # Analysis : • The flowchart organizes the differential diagnosis of dyspnea into three major etiological categories, each with multiple specific conditions. • Cardiac causes are the most numerous, with five subtypes. • Pulmonary causes are divided into disease types and embolism. • Other sources include systemic, neuromuscular, physical conditioning, and psychological factors. • The structure aids clinicians in systematically considering a broad range of possible diagnoses for dyspnea.
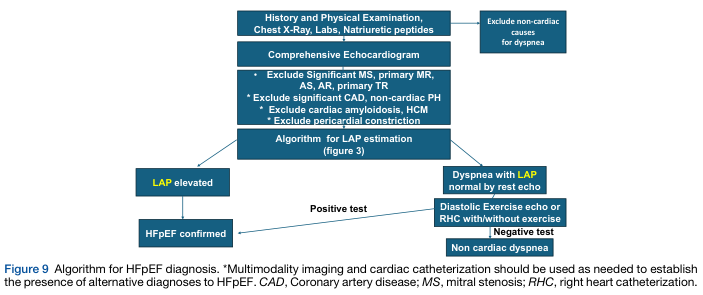
Summary : This flowchart presents an algorithm for diagnosing Heart Failure with preserved Ejection Fraction (HFpEF), detailing the stepwise evaluation of patients with dyspnea, including exclusion of non-cardiac causes, echocardiographic assessment, and further testing for left atrial pressure (LAP) elevation. flowchart: # Nodes : • History and Physical Examination, Chest X-Ray, Labs, Natriuretic peptides (rectangle) • Exclude non-cardiac causes for dyspnea (rectangle, side branch) • Comprehensive Echocardiogram (rectangle) • Exclude Significant MS, primary MR, AS, AR, primary TR (rectangle, bullet points) • Exclude significant CAD, non-cardiac PH (rectangle, bullet point) • Exclude cardiac amyloidosis, HCM (rectangle, bullet point) • Exclude pericardial constriction (rectangle, bullet point) • Algorithm for LAP estimation (figure 3) (rectangle) • LAP elevated (rectangle, yellow highlight) • HFpEF confirmed (rectangle) • Dyspnea with LAP normal by rest echo (rectangle, yellow highlight) • Diastolic Exercise echo or RHC with/without exercise (rectangle) • Positive test (arrow label) • Negative test (arrow label) • Non cardiac dyspnea (rectangle) # Connectors : • Top-down arrows connect each step in the main diagnostic pathway. • Side branch from "History and Physical Examination" to "Exclude non-cardiac causes for dyspnea". • After "Algorithm for LAP estimation", two branches: one to "LAP elevated" and one to "Dyspnea with LAP normal by rest echo". • "LAP elevated" leads directly to "HFpEF confirmed". • "Dyspnea with LAP normal by rest echo" leads to "Diastolic Exercise echo or RHC with/without exercise". • "Diastolic Exercise echo or RHC with/without exercise" splits into "Positive test" (leading to "HFpEF confirmed") and "Negative test" (leading to "Non cardiac dyspnea"). # Layout : • Vertical flow from initial assessment to final diagnosis. • Side branch for exclusion of non-cardiac causes. • Decision points create two main diagnostic branches after LAP estimation. • Use of color (yellow) to highlight LAP-related nodes. # Analysis : • The algorithm prioritizes exclusion of non-cardiac causes and alternative cardiac diagnoses before confirming HFpEF. • LAP elevation is a key diagnostic criterion; if not elevated, further exercise or invasive testing is recommended. • The flowchart ensures systematic, stepwise evaluation, minimizing misdiagnosis by requiring multiple exclusion steps and confirmatory tests.
Breathlessness with Normal SpO2 - What Could Be Wrong?
Why Normal SpO2 Doesn't Rule Out the Problem
- Whether the heart is pumping that blood adequately
- Whether there's enough hemoglobin to carry oxygen (anemia)
- Whether CO2 is building up
- Whether the breathing effort itself is excessive
- Whether the patient's brain is perceiving distress for other reasons
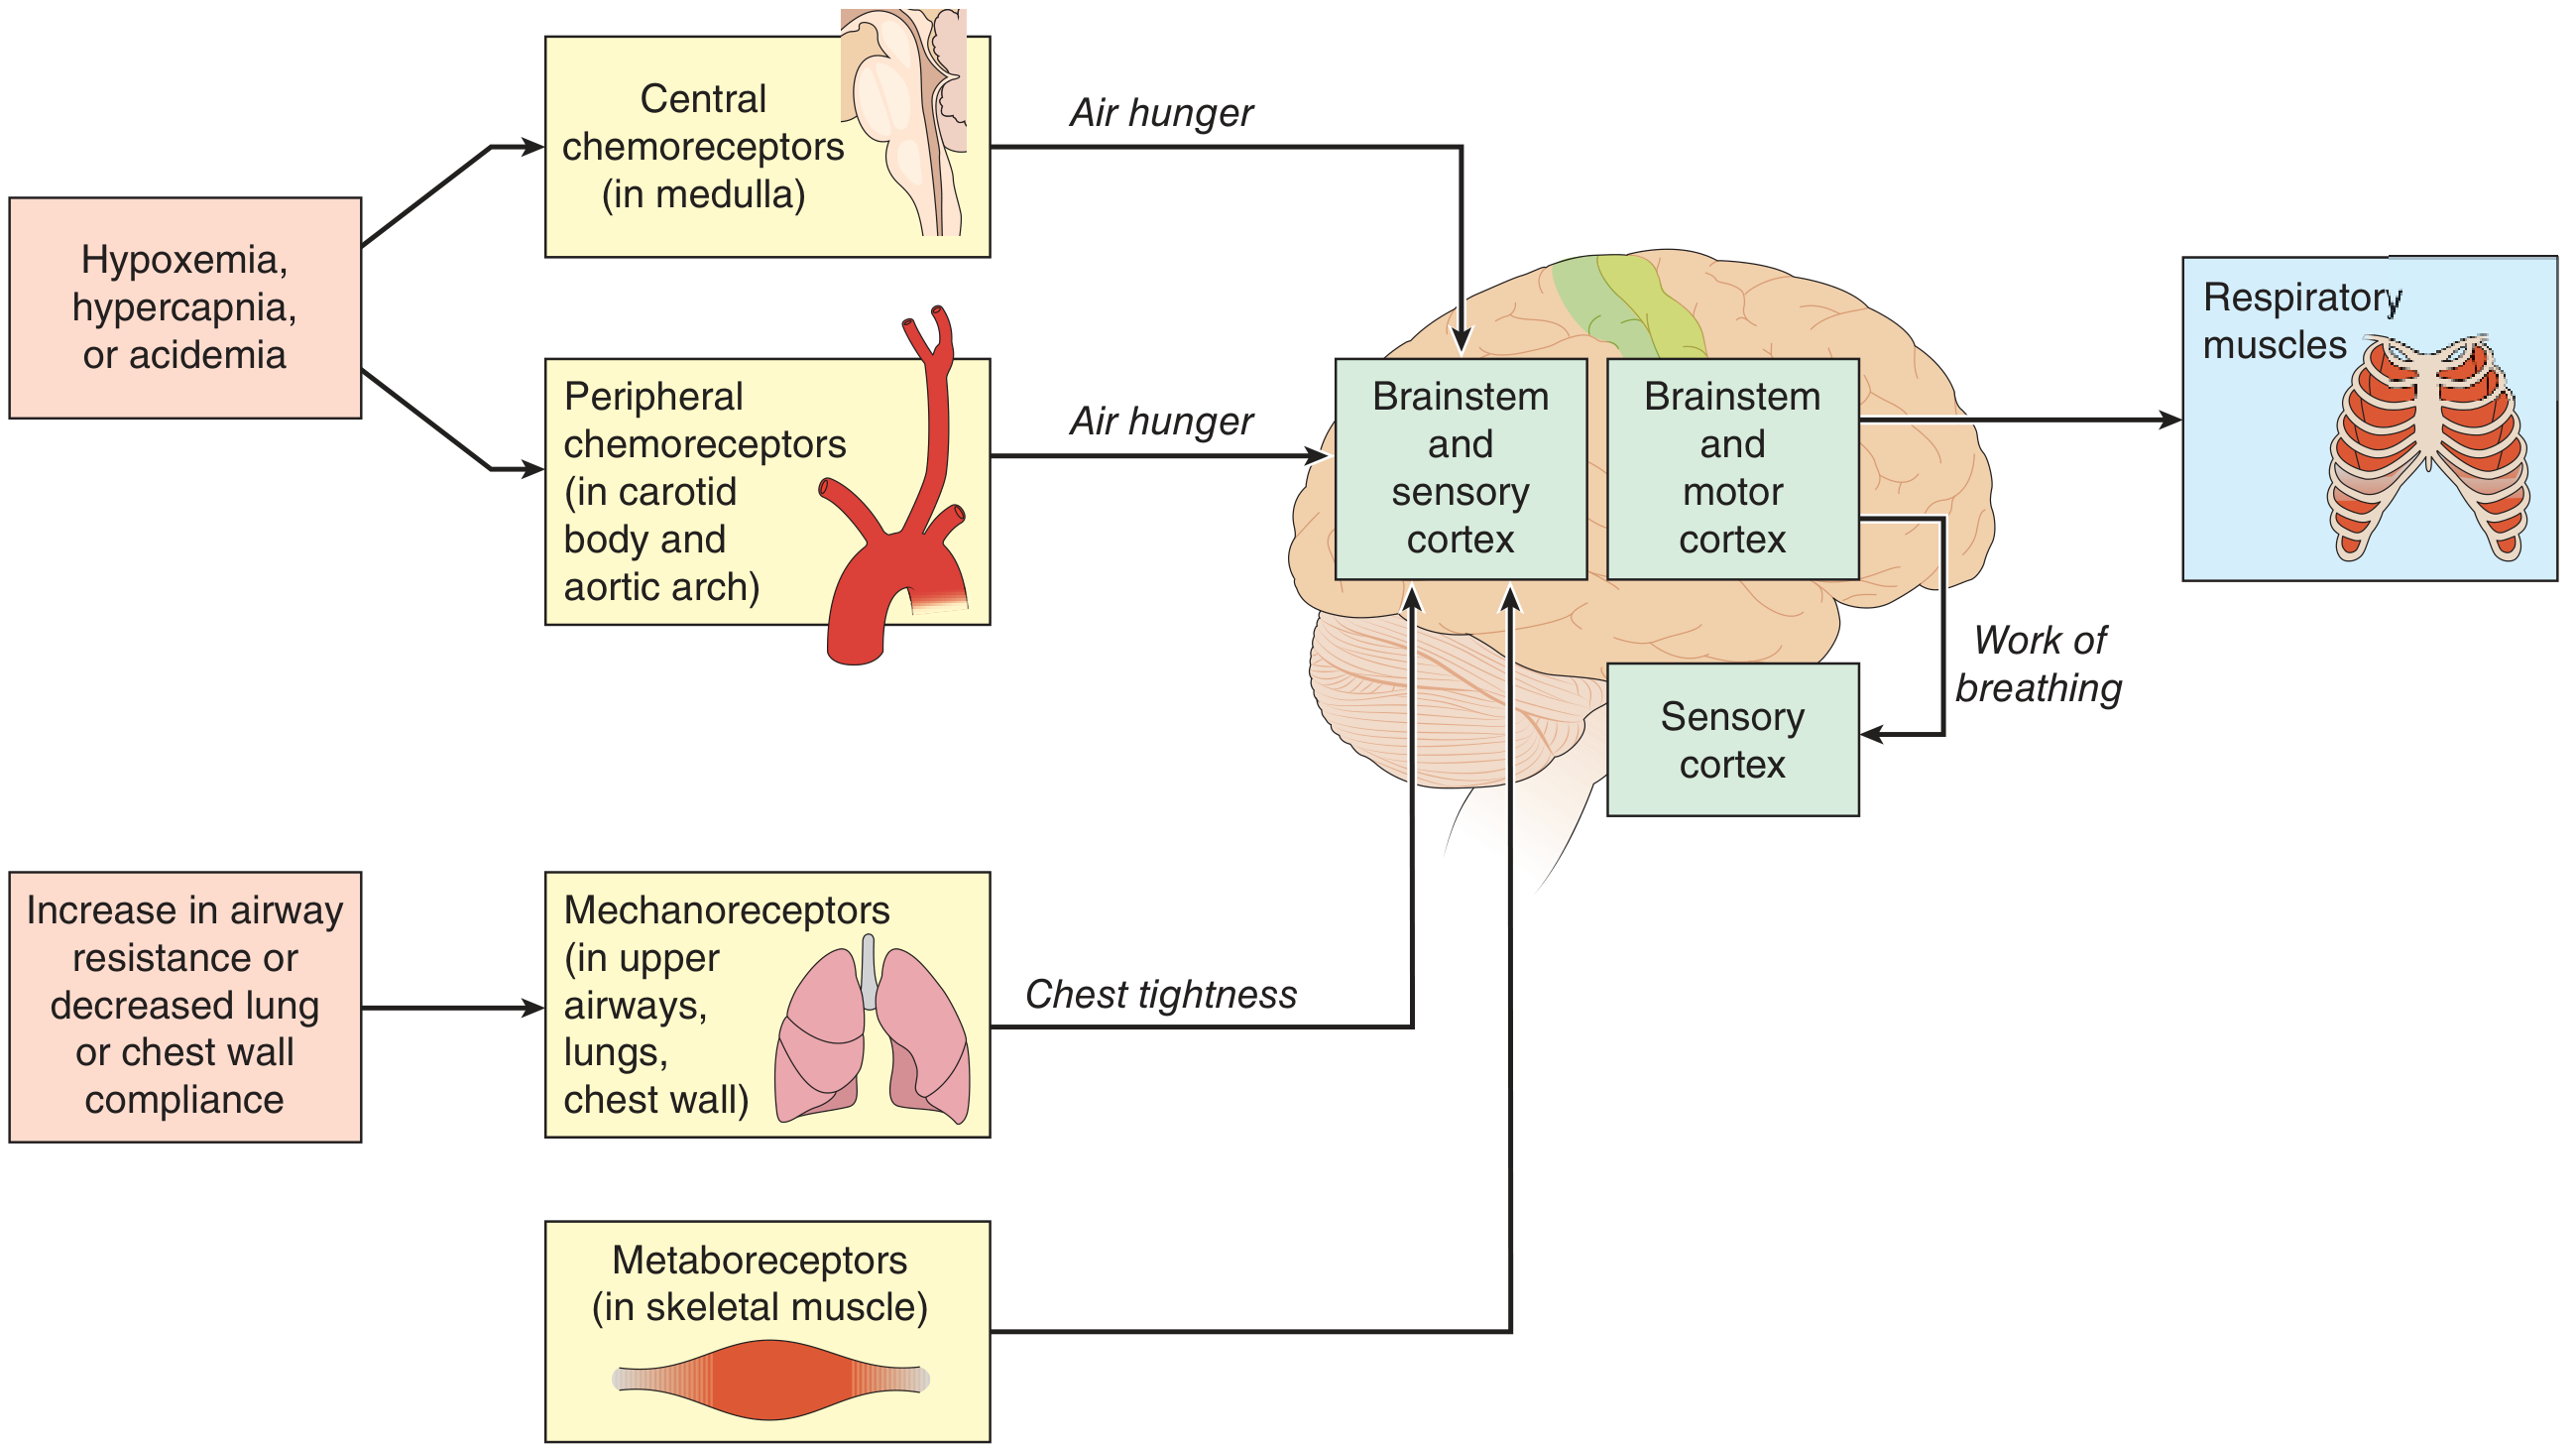
The Big Three Categories
Causes of Breathlessness WITH Normal SpO2
❤️ 1. Cardiac Causes (Very Common)
| Condition | Why SpO2 is Normal | Key Clues |
|---|---|---|
| Heart failure (early/compensated) | Lungs oxygenate blood OK, heart can't pump it forward | Orthopnea (worse lying flat), bilateral ankle edema, raised JVP |
| HFpEF (preserved ejection fraction) | Same as above | Common in elderly, hypertensive, obese patients |
| Arrhythmia (AF, SVT, VT) | O2 exchange fine, output is low | Palpitations, irregular pulse, sudden onset |
| Acute Coronary Syndrome / Angina | Ischemia reduces pump function before O2 drops | Chest tightness, diaphoresis, onset at rest or with exertion |
| Valvular disease (aortic stenosis, mitral stenosis) | Obstruction raises pressures without early hypoxia | Murmur on exam |
| Pericardial tamponade | Compression prevents filling, normal O2 exchange initially | Beck's triad: hypotension, JVD, muffled heart sounds - EMERGENCY |
Important: Pulmonary edema (fluid in the lungs from heart failure) can present with breathlessness for hours before SpO2 drops - the body compensates by increasing breathing rate.
🫁 2. Pulmonary Causes (Can Have Normal SpO2 Early On)
| Condition | Why SpO2 Can Be Normal | Key Clues |
|---|---|---|
| Pulmonary Embolism (PE) | Small/medium clots may not desaturate yet | Sudden onset, pleuritic chest pain, leg swelling, tachycardia - HIGH RISK if missed |
| Asthma (mild-moderate) | Compensation keeps O2 up until severe | Wheezing, nocturnal symptoms, history of asthma |
| Early COPD exacerbation | Compensatory hyperventilation maintains SpO2 | Cough, sputum change, smoker |
| Pulmonary hypertension | Raised pressures without initial hypoxia | Exertional breathlessness, right heart signs |
| Pleural effusion (small) | Not enough to cause desaturation | Dull percussion, reduced breath sounds at base |
| Interstitial lung disease | Early disease causes exertional dyspnea before rest hypoxia | Dry cough, fine crackles, occupational history |
⚠️ PE is the critical diagnosis not to miss here. A patient with sudden breathlessness since last night and normal SpO2 must be risk-stratified for PE (Wells score).
🩸 3. Anemia
- SpO2 measures the percentage of hemoglobin saturated - not how much hemoglobin exists
- In severe anemia, 98% of very little hemoglobin = SpO2 looks normal, but the blood is carrying far less total oxygen
- Breathlessness occurs because the heart has to pump faster to compensate
- Look for: pallor, fatigue, tachycardia, history of blood loss, poor diet
🧠 4. Metabolic / Systemic Causes
| Cause | Mechanism | Clues |
|---|---|---|
| Diabetic Ketoacidosis (DKA) | Metabolic acidosis drives Kussmaul breathing (deep, rapid breaths) | Known diabetic, fruity breath, vomiting, high glucose |
| Metabolic acidosis (any cause) | Chemoreceptors fire in response to low pH | Check ABG, renal failure, overdose |
| Hyperthyroidism | Increased metabolic demand, increased respiratory drive | Weight loss, tremor, tachycardia, sweating |
| Sepsis (early) | Increased demand + respiratory compensation for acidosis | Fever, rigors, source of infection |
| Carbon monoxide poisoning | CO binds hemoglobin; SpO2 reads falsely normal! | Headache, history of exposure (heaters, fires), cherry-red lips - EMERGENCY |
💪 5. Neuromuscular / Chest Wall Causes
- Guillain-Barré syndrome - ascending weakness can paralyze breathing muscles before O2 drops
- Myasthenia gravis - fatigable respiratory muscle weakness
- Kyphoscoliosis - restricted chest wall movement
- Obesity - increased work of breathing, especially when lying flat
😟 6. Anxiety / Panic Disorder
- Hyperventilation syndrome: rapid breathing blows off CO2, causing dizziness, tingling in hands/face, breathlessness - SpO2 is normal or even high
- Anxiety amplifies the perception of breathlessness through the cortex
- Diagnosis of exclusion - all serious causes must be ruled out first
🦠 7. Post-COVID Dyspnea
- An increasing number of patients experience breathlessness as part of long COVID
- Mechanism is multifactorial: autonomic dysfunction, deconditioning, small vessel disease
- Recent UCR research (2026) highlights that CO2 - not O2 - is the dominant driver of breathlessness, meaning normal SpO2 can genuinely coexist with significant breathing distress
🚨 Red Flag Causes - Do NOT Miss These
| Condition | Why Dangerous | What to Do |
|---|---|---|
| Pulmonary Embolism | Can be fatal within hours | D-dimer, CT pulmonary angiogram, anticoagulate |
| Acute MI / ACS | Silent presentation, especially in diabetics/elderly | ECG, troponin immediately |
| Cardiac Tamponade | Obstructs cardiac filling rapidly | Echo, pericardiocentesis |
| Carbon Monoxide Poisoning | SpO2 lies - gives false normal reading | Co-oximetry (not standard pulse ox), remove from exposure, high-flow O2 |
| Anaphylaxis with laryngeal edema | Airway closes rapidly | Epinephrine, airway management |
🩺 How to Work This Up
- Full history: onset, position (worse lying = cardiac), associated chest pain, palpitations, fever, leg swelling
- Vitals: heart rate, BP, respiratory rate (tachypnea with normal SpO2 is very telling)
- Examine: JVP, heart sounds, lung auscultation, leg edema
- ECG - arrhythmia, ischemia, right heart strain (PE)
- Chest X-ray - cardiomegaly, effusion, infiltrates
- Full blood count - anemia
- D-dimer - if PE suspected
- BNP/NT-proBNP - heart failure marker
- ABG (arterial blood gas) - check CO2, pH, confirm true oxygenation, rule out CO poisoning
- Echocardiogram (cardiac function, effusion)
- CT pulmonary angiogram (PE)
- Thyroid function tests
- Blood glucose / lactate
Summary
Normal SpO2 narrows the differential but does not make breathlessness benign. The most important causes to actively exclude in a patient breathless since last night are: Pulmonary Embolism, Acute Coronary Syndrome, early Heart Failure, Anemia, and CO poisoning (which fools the pulse oximeter). Respiratory rate and clinical exam often give more information than SpO2 alone.