Teach me ecg with image
Reading File
Finding Sources
Searching Images
ECG electrocardiogram waves PQRST normal
Reading File
Finding Sources
Searching Images
ECG 12 lead interpretation axis heart rate intervals
Loading Image
Loading Image
Searching Images
ECG ST elevation myocardial infarction STEMI changes
Finding Sources
Loading Image
Loading Image
Searching Images
atrial fibrillation ECG rhythm strip
Searching Images
ECG heart block bundle branch block
Loading Image
Loading Image
Now I have a rich set of images and content. Let me compose the full ECG teaching guide.
📟 ECG (Electrocardiogram) — A Complete Visual Guide
1. What Is an ECG?
An ECG records the electrical activity of the heart at the body surface. It captures differences in electrical potential generated by the heart as impulses travel through the conduction system, producing the characteristic waves we see on the tracing.
2. The Cardiac Conduction System & ECG Waveforms
The electrical journey through the heart creates each component of the ECG:
| Wave/Interval | Origin | Represents |
|---|---|---|
| P wave | SA node → atria | Atrial depolarization |
| PR interval | AV node delay | Atrioventricular conduction time |
| QRS complex | Bundle branches → Purkinje → ventricles | Ventricular depolarization |
| ST segment | Ventricular plateau | Isoelectric ventricular repolarization phase |
| T wave | Ventricular myocardium | Ventricular repolarization |
| QT interval | Start of QRS → end of T | Total ventricular electrical activity |
Normal Values
| Parameter | Normal Range |
|---|---|
| Heart rate | 60–100 bpm |
| PR interval | 120–200 ms (3–5 small squares) |
| QRS duration | <120 ms (<3 small squares) |
| QTc | <440 ms (men), <460 ms (women) |
3. The Cardiac Cycle — ECG in Context
This diagram from Miller's Anesthesia shows exactly how each ECG wave relates to mechanical events (valve openings, ventricular pressure, blood flow):
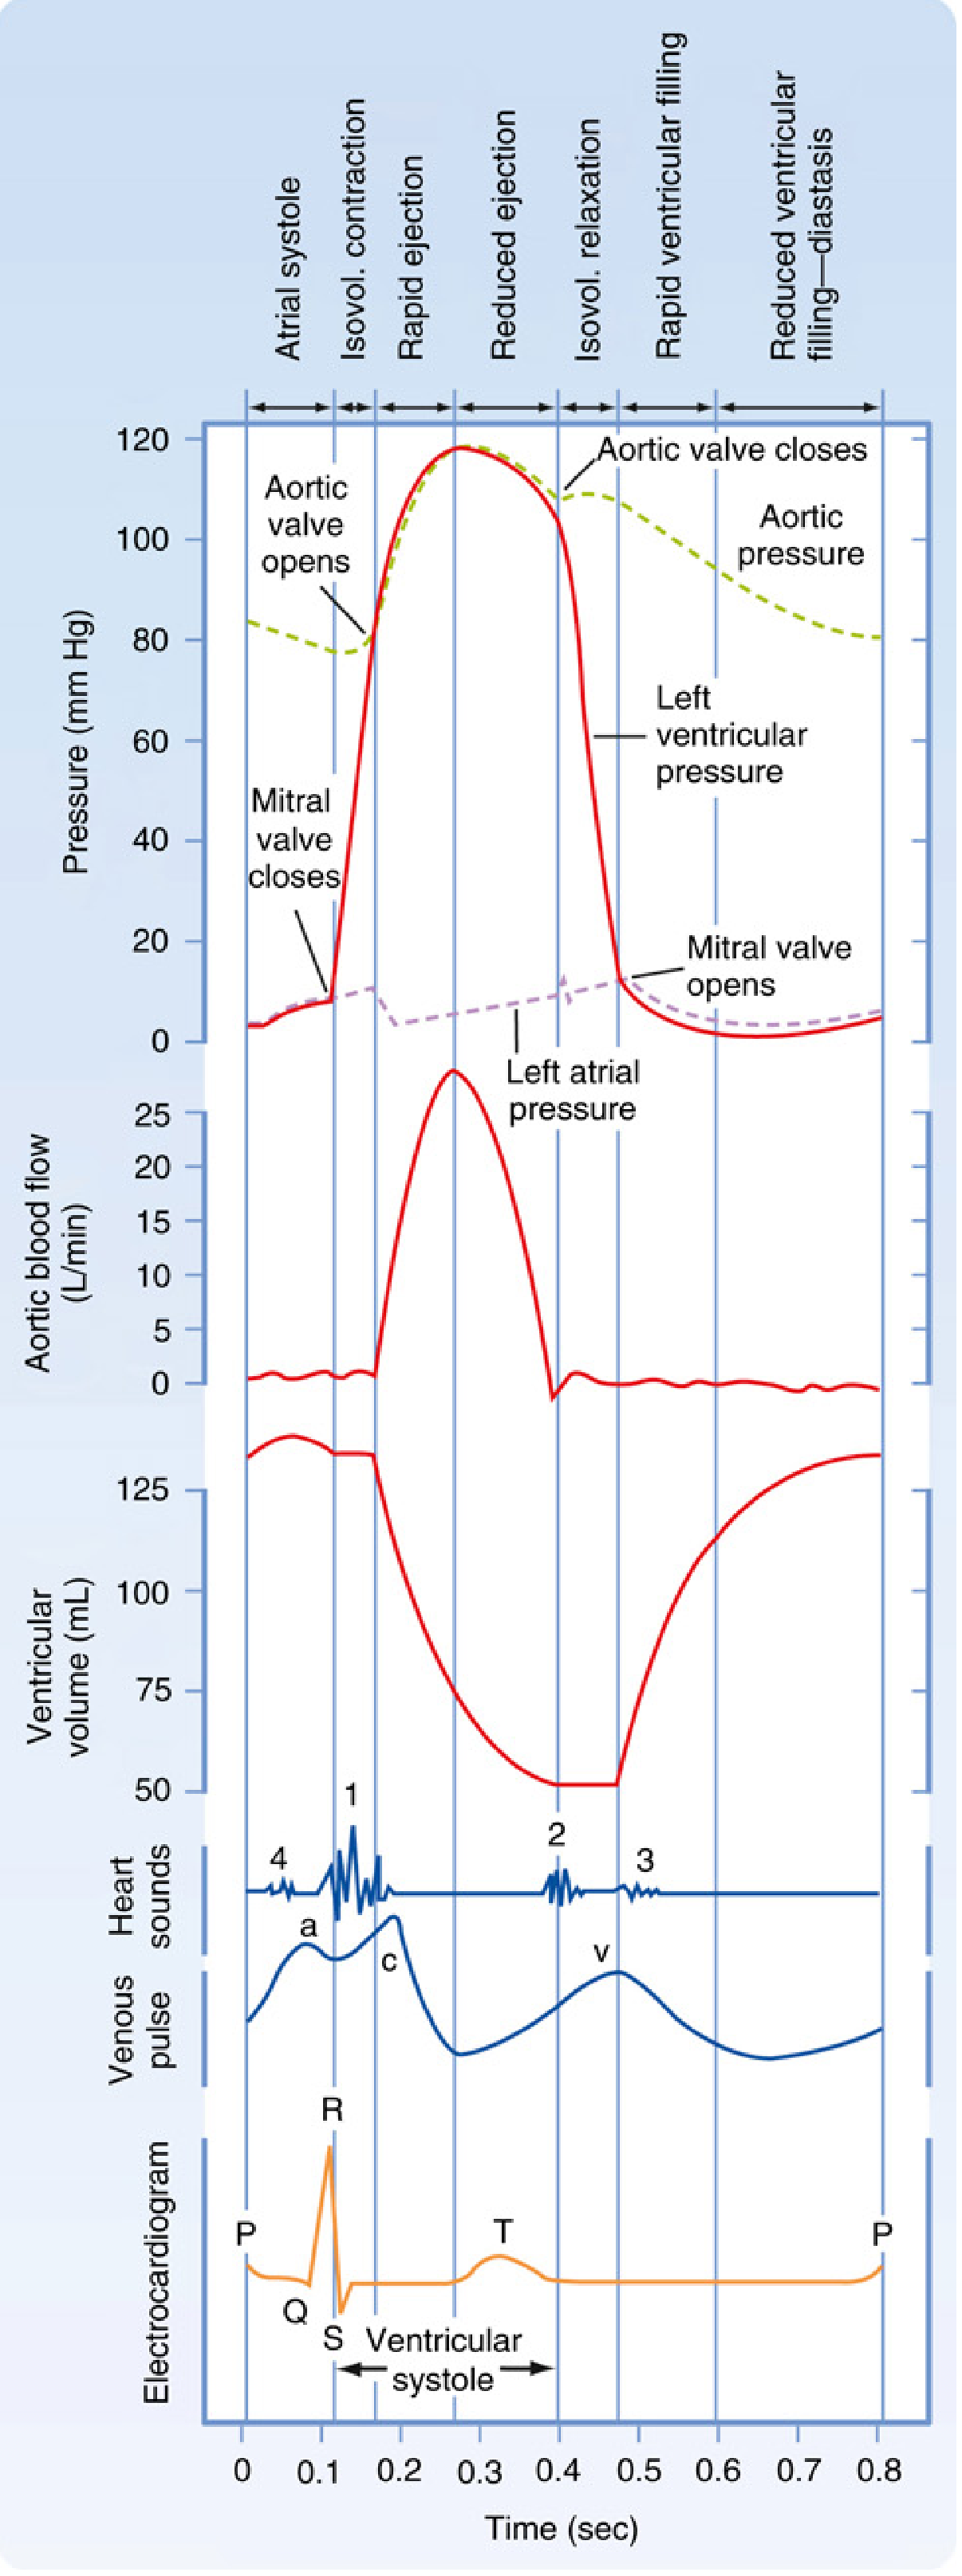
Key correlations:
- P wave → atrial systole begins
- End of R wave → mitral/tricuspid valve close (S1)
- QRS → ventricular depolarization → start of isovolumic contraction
- T wave → ventricular repolarization → pulmonic/aortic valve close (S2)
Miller's Anesthesia, 10e, p. 1364–1367
4. Reading the ECG Paper
The standard ECG grid:
- Small square = 1 mm = 0.04 sec (horizontal) / 0.1 mV (vertical)
- Large square = 5 mm = 0.2 sec
Heart rate calculation (regular rhythm):
Rate = 300 ÷ number of large squares between R-R intervals
Common quick memory: 300 → 150 → 100 → 75 → 60 → 50
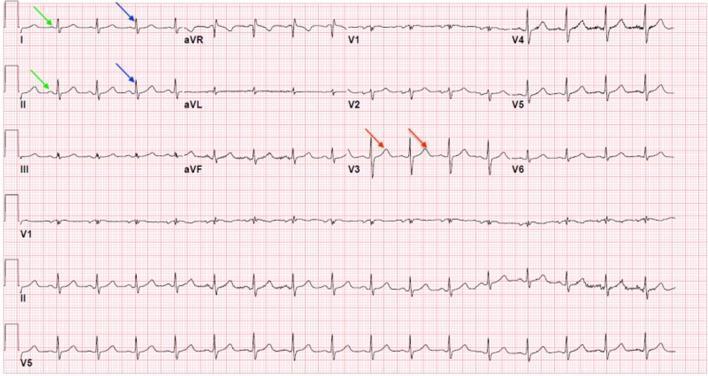
5. The 12-Lead ECG
A standard 12-lead ECG views the heart from 12 angles:
| Group | Leads | View |
|---|---|---|
| Inferior | II, III, aVF | Inferior wall (RCA territory) |
| Lateral | I, aVL, V5, V6 | Lateral wall (LCx territory) |
| Anterior | V1–V4 | Anterior wall (LAD territory) |
| High lateral | I, aVL | High lateral (LAD/LCx) |
| aVR | — | Cavity; normally negative |
This labeled 12-lead shows P waves (green arrows), QRS complexes (blue arrows), and T waves (red arrows):
6. Systematic Approach to Reading Any ECG
Use the mnemonic RRAPQRST:
- Rate — fast/slow/normal?
- Rhythm — regular or irregular?
- Axis — normal (−30° to +90°)?
- P waves — present? Morphology? 1:1 with QRS?
- PR interval — short/normal/long?
- QRS — narrow or wide? Any Q waves?
- R-wave progression — V1 → V6 increasing?
- ST segment & T waves — elevation/depression/inversion?
7. Normal Sinus Rhythm vs. Common Pathologies
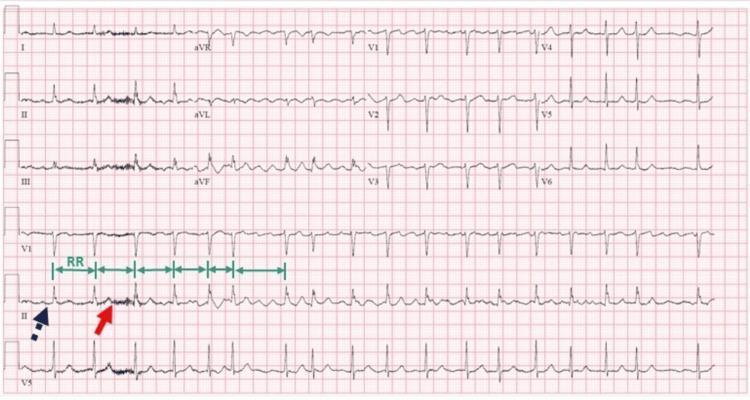
A) Atrial Fibrillation
Key features:
- No P waves (replaced by chaotic fibrillatory "f" waves)
- Irregularly irregular R-R intervals
- Narrow QRS (unless aberrant conduction)
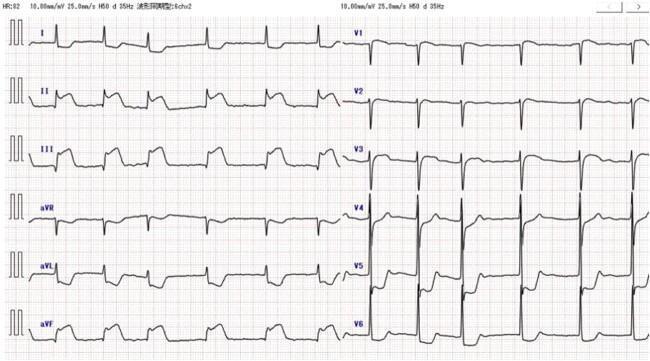
B) Anterior STEMI (ST-Elevation MI)
Key features:
- ST elevation in anterior leads (V1–V6) ± I, aVL → LAD occlusion
- Reciprocal ST depression in inferior leads (II, III, aVF)
- Hyperacute T waves in early phase
- Q waves develop with full-thickness infarction

C) Inferior STEMI
Key features:
- ST elevation in II, III, aVF → RCA or LCx occlusion
- Reciprocal depression in I and aVL
- Check right-sided leads (V3R/V4R) for right ventricular infarction
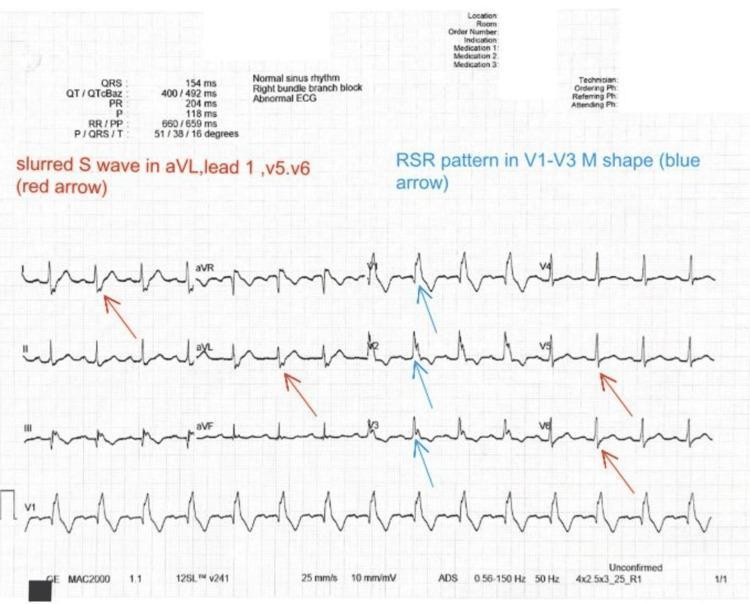
D) Right Bundle Branch Block (RBBB)
Key features:
- QRS ≥ 120 ms (wide)
- RSR' ("M-shape") in V1–V3 (right precordial leads)
- Broad, slurred S wave in I, aVL, V5, V6
- Secondary T-wave inversions in V1–V3
8. ECG Changes by Electrolyte Disturbance
| Electrolyte | ECG Change |
|---|---|
| Hyperkalemia | Peaked T waves → wide QRS → sine wave → VF |
| Hypokalemia | Flat T waves, prominent U waves, ST depression |
| Hypercalcemia | Short QT interval |
| Hypocalcemia | Prolonged QT interval |
9. Lead Grouping Quick Reference
INFERIOR:    II, III, aVF       → RCA
LATERAL:     I, aVL, V5, V6    → LCx
ANTERIOR:    V1–V4             → LAD
SEPTAL:      V1–V2             → Septal branch of LAD
Reciprocal changes always appear in leads opposite the infarcted territory — their presence strongly confirms true ST elevation vs. benign variants.
10. Summary: ECG Interpretation Checklist
| Step | What to Look For |
|---|---|
| Rate | >100 = tachycardia; <60 = bradycardia |
| Rhythm | Regular? P before every QRS? |
| Axis | Normal (I+, aVF+); LAD (I+, aVF−); RAD (I−, aVF+) |
| P wave | Upright in I, II; inverted in aVR |
| PR interval | 120–200 ms; prolonged = AV block |
| QRS | <120 ms; wide = BBB or ventricular origin |
| ST segment | Elevation (injury/STEMI); depression (ischemia/NSTEMI) |
| T wave | Normally upright in I, II, V3–V6; inverted = ischemia |
| QT/QTc | Prolonged = risk of Torsades de Pointes |
This covers the foundations of ECG interpretation. Want to go deeper into any specific topic — arrhythmias, axis calculation, hypertrophy criteria, or a specific pathology?
This is a shared conversation. Sign in to Orris to start your own chat.