
Explain in detail mri
Reading File
Finding Sources
Searching the Web
MRI magnetic resonance imaging physics principles clinical applications detailed
Reading File
Finding Sources
Finding Sources
Reading File
Finding Sources
Finding Sources
Reading File
Reading File
Finding Sources
Reading Web Page
https://pmc.ncbi.nlm.nih.gov/articles/PMC4632105
Finding Sources
Finding Sources
Reading File
Reading File
I now have solid material from authoritative textbooks and a peer-reviewed source. Let me compile the complete detailed explanation.
Magnetic Resonance Imaging (MRI) - Detailed Explanation
1. What Is MRI?
MRI is a medical imaging technique that uses strong magnetic fields, magnetic field gradients, and radiofrequency (RF) electromagnetic radiation to generate detailed images of the anatomy and physiological processes inside the body. Unlike CT and plain X-ray, it does not use ionizing radiation, making it safer for repeated use and for use in pregnancy.
MRI is particularly powerful for soft-tissue contrast - it can differentiate between structures that appear similar on CT, such as grey and white matter in the brain, or the inner and outer layers of muscles and joints.
- National Kidneys Foundation Primer, p. 72: "MRI takes advantage of the spin of protons (usually hydrogen ions) in different microenvironments in order to generate image contrast."
2. Historical Background
- The nuclear magnetic resonance (NMR) phenomenon was first described experimentally by Felix Bloch and Edward Purcell in 1946, for which they received the Nobel Prize for Physics in 1952.
- The first clinical MR images were produced in Nottingham and Aberdeen in 1980.
- Wide-bore superconducting magnets, developed ~30 years later, allowed the technique to expand into routine clinical use.
3. Physics and Basic Principles
3a. Proton (Hydrogen) Spin
The human body is ~70% water, meaning it is rich in hydrogen protons (H+). Each proton has a property called spin - essentially a tiny magnetic moment. Normally these spins are randomly oriented and cancel out.
3b. The Main Magnetic Field (B0)
When a patient enters the MRI bore, the powerful external magnetic field (B0, typically 1.5 Tesla or 3 Tesla in clinical scanners) causes the hydrogen protons to align along the field, either parallel (low energy, majority) or anti-parallel (high energy). This creates a net magnetization vector along the z-axis.
3c. Larmor Frequency and RF Pulse
The protons do not simply align - they precess (wobble like a spinning top) around the B0 axis at a specific frequency called the Larmor frequency, which is proportional to B0:
Larmor frequency (ω₀) = γ × B0 where γ = gyromagnetic ratio for hydrogen = 42.58 MHz/Tesla
When an RF pulse is applied at exactly the Larmor frequency, energy is absorbed by the protons (resonance), tipping the net magnetization into the transverse (xy) plane. This is the core of the nuclear magnetic resonance effect.
3d. Relaxation and Signal Generation
Once the RF pulse is switched off, the protons return to their equilibrium state - a process called relaxation. The relaxing protons generate the MR signal detected by receiver coils. There are two independent relaxation processes:
| Relaxation | Also Called | Axis | Description |
|---|---|---|---|
| T1 | Spin-lattice / longitudinal | Z-axis | Time for longitudinal magnetization to recover to 63% of equilibrium. Reflects energy transfer from protons to surrounding molecules (lattice). |
| T2 | Spin-spin / transverse | XY-axis | Time for transverse magnetization to decay to 37% of its peak. Reflects loss of phase coherence between spins as they exchange energy with each other. |
- T2* is a related, shorter decay time caused by both T2 and magnetic field inhomogeneities.
Different tissues have characteristically different T1 and T2 values, which is the basis of MRI's superior soft-tissue contrast.
3e. Spatial Encoding - Gradient Coils
Three sets of gradient coils (X, Y, Z) create small, controlled variations in the magnetic field strength across the imaging volume. This causes protons at different locations to precess at slightly different frequencies (or phases), allowing their spatial position to be mathematically decoded by a process called the Fourier Transform to reconstruct the final image.
4. MRI Sequences (Pulse Sequences)
A pulse sequence is a specific combination of RF pulses and gradient timings. Key parameters include:
- TR (Repetition Time): time between successive RF pulses
- TE (Echo Time): time between the RF pulse and signal acquisition
By adjusting TR and TE, tissue contrast can be weighted toward different properties:
| Sequence | TR | TE | What It Highlights |
|---|---|---|---|
| T1-weighted | Short | Short | Fat (bright), anatomy, post-contrast enhancement |
| T2-weighted | Long | Long | Fluid (bright), edema, pathology (most lesions are bright on T2) |
| Proton Density (PD) | Long | Short | Number of protons; good for cartilage |
| FLAIR (Fluid Attenuated Inversion Recovery) | Long | Long + inversion pulse | Suppresses CSF signal; excellent for periventricular lesions in MS |
| DWI (Diffusion-Weighted Imaging) | - | - | Detects restriction of water diffusion; acute stroke, abscess |
| GRE (Gradient Echo) | Short | Variable | Faster; sensitive to iron/blood; cardiac, musculoskeletal |
Clinical example from Campbell's Operative Orthopaedics (2026): In spinal infection, T1-weighted images show decreased signal in vertebral bodies and disc spaces (hypointense = dark), while T2-weighted images show increased signal (hyperintense = bright) in infected discs, paravertebral abscesses, and epidural collections.
5. MRI Equipment Components
An MRI scanner has four key components:
- Main Magnet - A superconducting electromagnet (cooled by liquid helium to near absolute zero) generating B0. Clinical magnets are 1.5 T, 3 T, or 7 T (research).
- Gradient Coils - Create spatial encoding by varying the field in X, Y, Z directions; responsible for the loud knocking noise during scanning.
- RF Coils - A transmit coil delivers the RF pulse; receiver coils (surface coils, body coils, head coils) detect the returning MR signal. Coil selection is body-region specific.
- Shim Coils - Correct inhomogeneities in the main field to improve image uniformity.
6. MRI Contrast Agents
Gadolinium-based contrast agents (GBCAs) are the standard MRI contrast medium.
- Gadolinium is a paramagnetic metal that causes T1 shortening, making areas of enhancement appear bright on T1-weighted images.
- Used to detect blood-brain barrier breakdown, tumour vascularity, inflammation, and infection.
- Allergic reactions are very rare (< 0.1% of administrations).
- Key risk - Nephrogenic Systemic Fibrosis (NSF): A serious fibrosing condition that can occur when GBCAs are given to patients with significantly reduced kidney function (eGFR < 30 mL/min/1.73 m²). High-dose gadolinium can also cause acute kidney injury in vulnerable patients. Gadolinium must be used with caution in renal failure.
- Gadolinium deposits in certain brain regions (e.g., dentate nucleus, globus pallidus) have been observed with repeated dosing, though clinical significance is still debated.
- Contrast in pregnancy: Generally avoided as effects on the fetus are not fully established.
- Grainger & Allison's Diagnostic Radiology: "Administration of Gd-based contrast agents provides useful diagnostic information for selected indications, such as identification of regions of blood-brain barrier breakdown, but is not used routinely."
7. Clinical Applications
Neuroimaging
- Brain tumours: Post-contrast T1 shows ring or solid enhancement; T2/FLAIR shows surrounding edema.
- Stroke: DWI is the gold standard for detecting acute ischemic stroke within minutes of onset.
- Multiple Sclerosis: FLAIR sequence shows periventricular white matter plaques; post-contrast T1 identifies active (enhancing) plaques.
- Posterior fossa pathology: MRI is the modality of choice because CT has significant streak artefacts from the skull base - MRI shows the brainstem and cerebellum without this limitation.
Spine
- Investigation of choice for all spinal cord and nerve root pathology.
- Best depicts intervertebral discs, ligaments, and cord signal.
- In spinal infection (discitis/osteomyelitis): 96% sensitivity, 93% specificity. T1 + T2 sequences in sagittal and axial planes are standard; gadolinium improves delineation of epidural abscesses.
Musculoskeletal
- Ligament tears, meniscal injuries, cartilage defects, occult fractures, stress injuries.
- Marrow pathology (avascular necrosis, metastases, myeloma).
Abdomen and Pelvis
- Liver characterization (hepatocellular carcinoma, metastases, hemangioma).
- Gynecology: Investigation of choice for Mullerian duct anomalies, indeterminate adnexal masses, and benign pelvic disease - provides high-resolution soft-tissue detail.
- Kidneys: Excellent tissue contrast; avoids iodinated contrast in patients with iodine allergy. However, spatial resolution is slightly lower than CT, so CT is preferred for fine detail of the collecting system (detecting small urothelial lesions).
Cardiovascular
- Cardiac MRI assesses ventricular function, myocardial fibrosis (late gadolinium enhancement), cardiomyopathies, and congenital heart disease.
Functional and Advanced MRI
- fMRI (functional MRI): Measures BOLD (Blood Oxygen Level Dependent) signal changes during cognitive or motor tasks; used in pre-surgical brain mapping.
- DTI (Diffusion Tensor Imaging): Maps white matter tracts; used with fMRI for surgical planning around critical structures.
- MR Spectroscopy (MRS): Measures biochemical metabolites (e.g., NAA, creatine, choline, lactate) in tissue without biopsy; helps characterize brain tumours and metabolic disorders.
- Magnetization Transfer Imaging (MT): Exploits exchange of magnetization between free water protons and protons bound in macromolecules; useful in MS and neurodegeneration.
- Perfusion MRI: Assesses cerebral blood flow and volume; important in stroke and tumour grading.
8. Advantages of MRI vs. CT
| Feature | MRI | CT |
|---|---|---|
| Ionizing radiation | None | Yes |
| Soft tissue contrast | Superior | Moderate |
| Bone detail | Moderate | Superior |
| Speed | Slow (minutes) | Fast (seconds) |
| Cost | Higher | Lower |
| Availability | Less accessible | Widely available |
| Metallic implants | Contraindicated (many) | Mostly safe |
| Noise | Very loud | Moderate |
| Pregnancy | Generally safe | Avoid (radiation) |
9. Safety and Contraindications
MRI is generally safe, but careful patient screening is mandatory before every examination.
Absolute or strong contraindications:
- Certain cardiac pacemakers and implantable cardioverter-defibrillators (ICDs) - older non-MR-conditional devices; these can be disrupted or cause heating
- Ferromagnetic intracranial aneurysm clips - can move in the magnetic field with fatal consequences
- Cochlear implants (many types)
- Metallic foreign bodies in the orbit - risk of movement causing blindness
Conditional (proceed with caution/specific protocols):
- MR-conditional pacemakers/ICDs - can be scanned with a standardized institutional protocol, with a qualified clinician present and external defibrillation equipment available outside the MRI room
- Other metallic implants (joint replacements, stents, spinal hardware) - most are now MR-conditional at 1.5 T
Other practical considerations:
- Claustrophobia/anxiety: The narrow bore and loud noise cause distress in some patients; sedation or general anaesthesia may be required. Open-bore scanners are available but yield lower-quality images.
- Patient cooperation: Breath-holding is required for abdominal imaging; motion artefact degrades image quality. Long scan duration (15-60+ minutes) is challenging for some patients.
- Pregnancy: MRI can be performed in pregnancy with no known adverse fetal effects, after joint radiologist-obstetrician decision. Gadolinium contrast is generally avoided.
- Grainger & Allison's: "A safe MR examination necessitates that patients are interviewed and screened before the examination to exclude individuals who may be at risk or have contraindication to exposure to the MRI environment."
10. Summary of Key MRI Concepts
| Concept | Summary |
|---|---|
| Signal source | Hydrogen proton spin in water and fat |
| Excitation | RF pulse at Larmor frequency |
| T1 relaxation | Longitudinal recovery; fat bright, fluid dark |
| T2 relaxation | Transverse decay; fluid and pathology bright |
| Spatial encoding | Gradient coils (X, Y, Z) + Fourier Transform |
| Contrast agent | Gadolinium - T1 shortening, enhances pathology |
| Major risk | NSF with gadolinium in renal failure |
| Contraindication | Ferromagnetic implants, non-conditional pacemakers |
| Gold standard uses | Brain, spine, MSK, pelvis, cardiac |
Sources:
- MRI: Principles and Techniques - PMC (NIH) - comprehensive peer-reviewed review
- Grainger & Allison's Diagnostic Radiology (9780323760751), p. 1368, 1799-1808
- National Kidneys Foundation Primer on Kidney Diseases, 8e (9780323791229), p. 72-73
- Campbell's Operative Orthopaedics 15th Ed 2026 (9780443117633), p. 1082-1126
- Bailey and Love's Short Practice of Surgery, 28th Ed (9780367548117)
- Harrison's Principles of Internal Medicine, 22E (9781265977061)
What is t1 and t2 weighting
Finding Sources
Searching the Web
T1 T2 weighted MRI imaging explained TR TE relaxation tissue contrast
Finding Sources
Reading File
Reading File
Reading File
Reading File
Loading Image
Loading Image
Excellent - I have the actual textbook brain MRI images showing both sequences side by side. Here is the full detailed explanation.
T1 and T2 Weighting in MRI
The Core Concept
"Weighting" simply means that the MRI sequence has been tuned (by adjusting timing parameters) so that the image contrast is predominantly determined by either T1 or T2 relaxation properties of the tissues being scanned. Neither image is purely T1 or T2 - there is always some contribution from both - but one dominates depending on how the scan is set up.
The Two Key Relaxation Times
When an RF pulse tips protons out of alignment, two independent recovery processes begin simultaneously:
T1 - Longitudinal (Spin-Lattice) Relaxation
- This is the recovery of magnetization back along the Z-axis (the main field direction)
- Protons release energy into the surrounding molecular lattice (environment)
- T1 is the time for magnetization to recover to 63% of its original value
- Typical T1 values at 1.5T: Fat ~260 ms, White matter ~790 ms, CSF ~2400 ms, Water ~2500 ms
- Fat has a very short T1 (recovers quickly) - it readily exchanges energy with nearby molecules
- Water/CSF has a very long T1 (recovers slowly) - free water is a poor energy exchanger
T2 - Transverse (Spin-Spin) Relaxation
- This is the loss of phase coherence in the XY-plane as protons exchange energy with each other
- After the RF pulse, protons initially precess in phase (like synchronized swimmers). They gradually fall out of sync - this is T2 decay
- T2 is the time for transverse magnetization to decay to 37% of its peak
- Typical T2 values at 1.5T: Fat ~80 ms, White matter ~80 ms, Gray matter ~100 ms, CSF ~2000 ms
- CSF and free water have very long T2 (stay in phase long)
- Solid structures (bone, calcification) have very short T2 (rapidly dephase, give almost no signal)
The Timing Parameters: TR and TE
The two operator-controlled parameters that determine weighting are:
| Parameter | Full Name | What It Controls |
|---|---|---|
| TR | Repetition Time | Time between successive RF pulses (ms). Controls how much T1 recovery occurs before the next pulse |
| TE | Echo Time | Time between the RF pulse and signal readout (ms). Controls how much T2 decay has occurred when you sample the signal |
How TR and TE Create Weighting
T1-Weighted Images: Short TR, Short TE
- Short TR (~300-600 ms): The next pulse fires before long-T1 tissues (like CSF) have had time to recover. Short-T1 tissues (fat) have already recovered and give a large, bright signal. Long-T1 tissues (water) have barely recovered and give a weak, dark signal.
- Short TE (~10-30 ms): Read the signal early, before T2 decay significantly affects contrast - this minimizes T2 contribution and keeps T1 differences dominant.
T2-Weighted Images: Long TR, Long TE
- Long TR (~2000-3000+ ms): Enough time for virtually all tissues to fully recover longitudinal magnetization - this removes T1 differences and "neutralizes" T1 contrast.
- Long TE (~80-120 ms): Wait a long time before reading the signal. Short-T2 tissues (fat, white matter) have already dephased and lost signal. Long-T2 tissues (CSF, free water) still retain their signal and appear bright.
Proton Density (PD): Long TR, Short TE
- Long TR removes T1 contrast; short TE minimizes T2 contrast. The image is primarily determined by the number of protons per unit volume.
Summary table:
| Weighting | TR | TE |
|---|---|---|
| T1 | Short (< 600 ms) | Short (< 30 ms) |
| Proton Density | Long (> 1500 ms) | Short (< 30 ms) |
| T2 | Long (> 2000 ms) | Long (> 80 ms) |
Tissue Appearances: The Practical Guide
Here are the actual brain MRI images from Neuroanatomy through Clinical Cases (3rd Ed.) showing the visual difference:
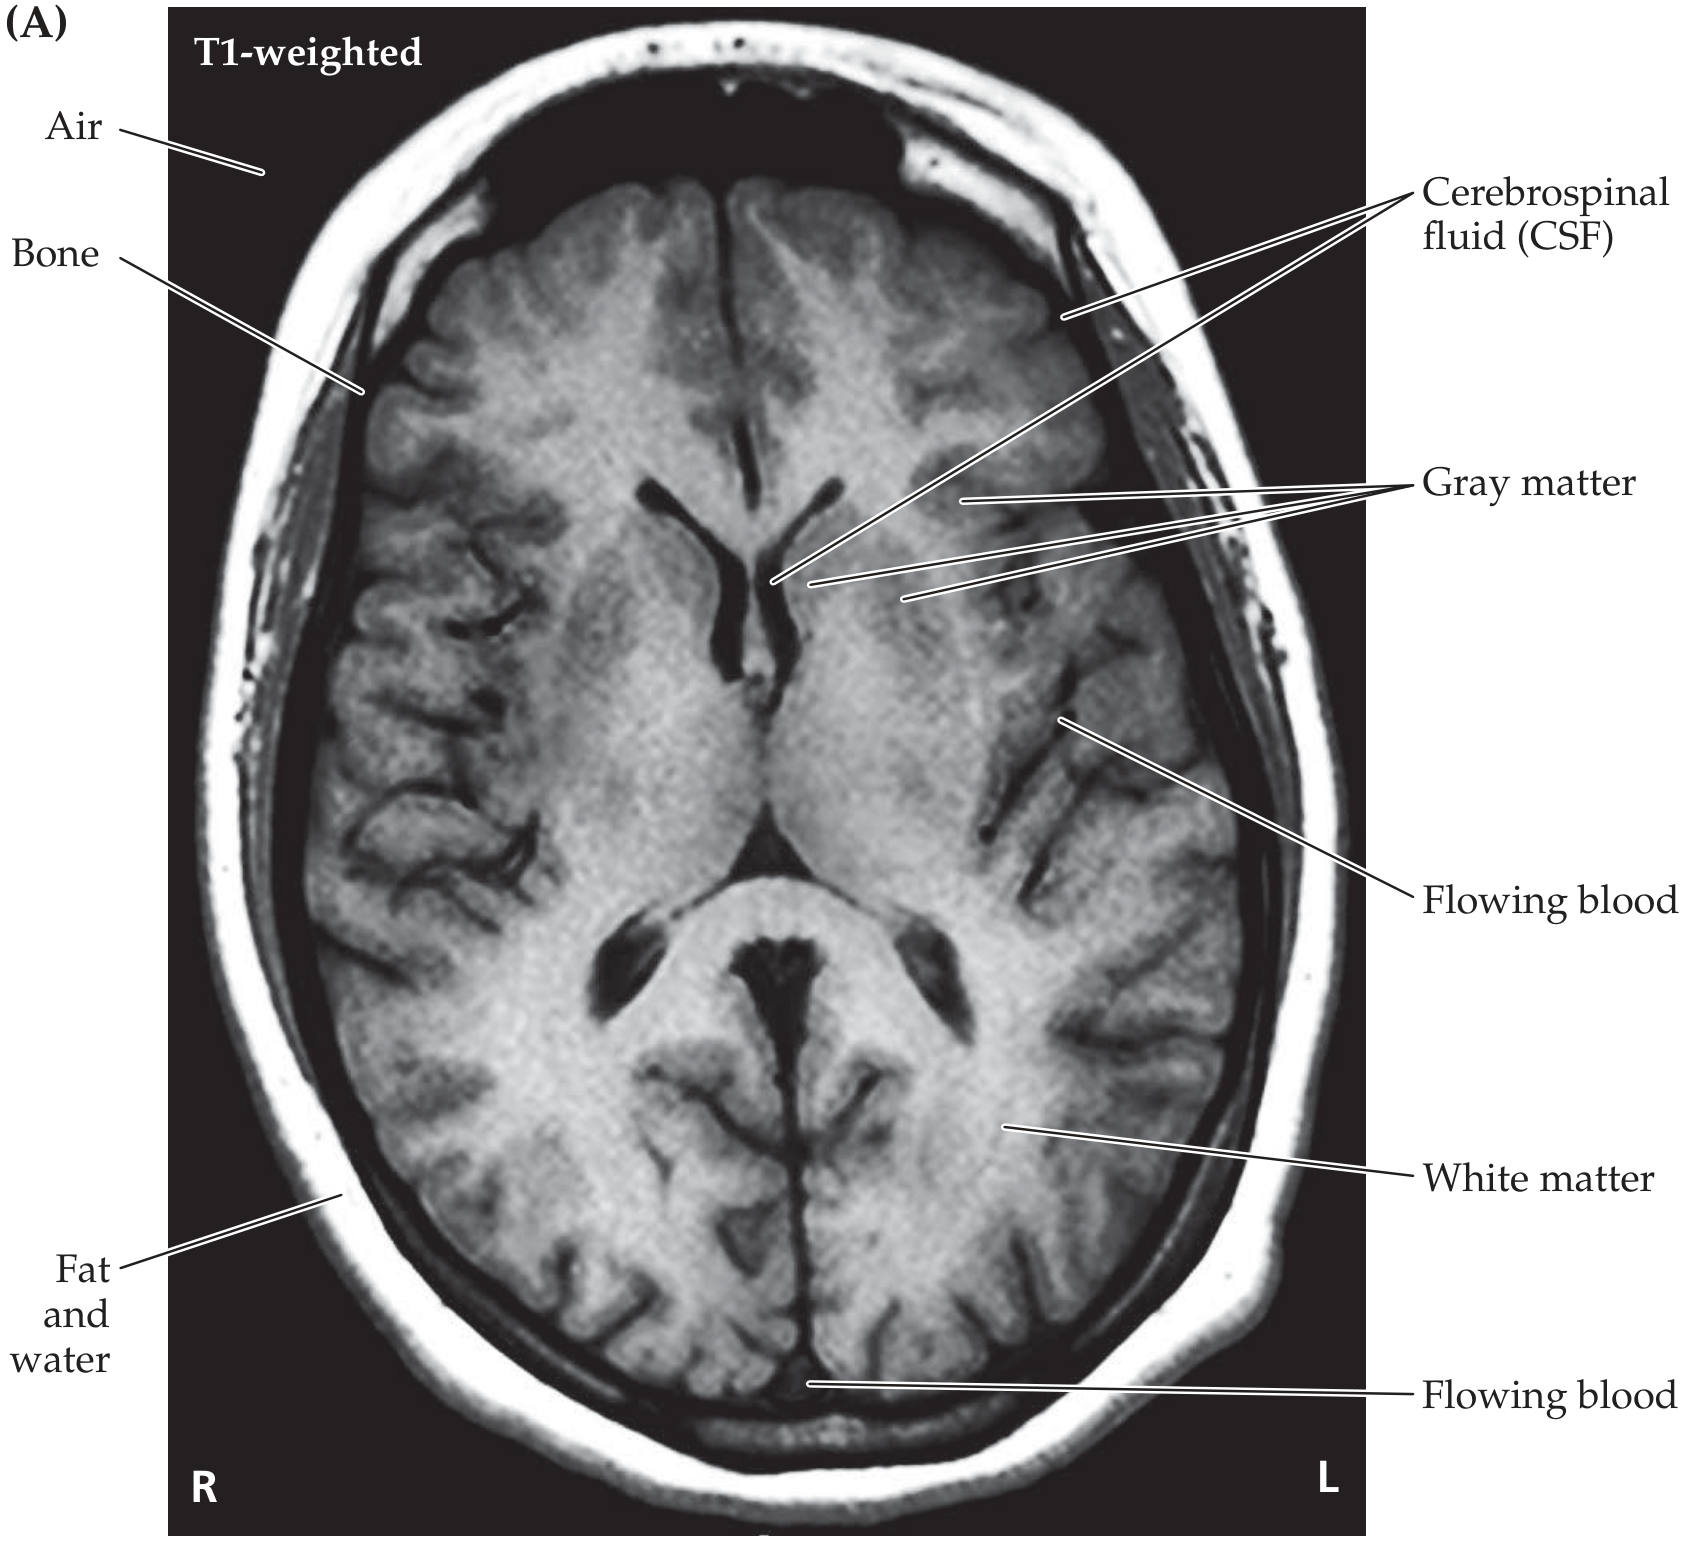
T1-weighted brain MRI:
T2-weighted brain MRI:
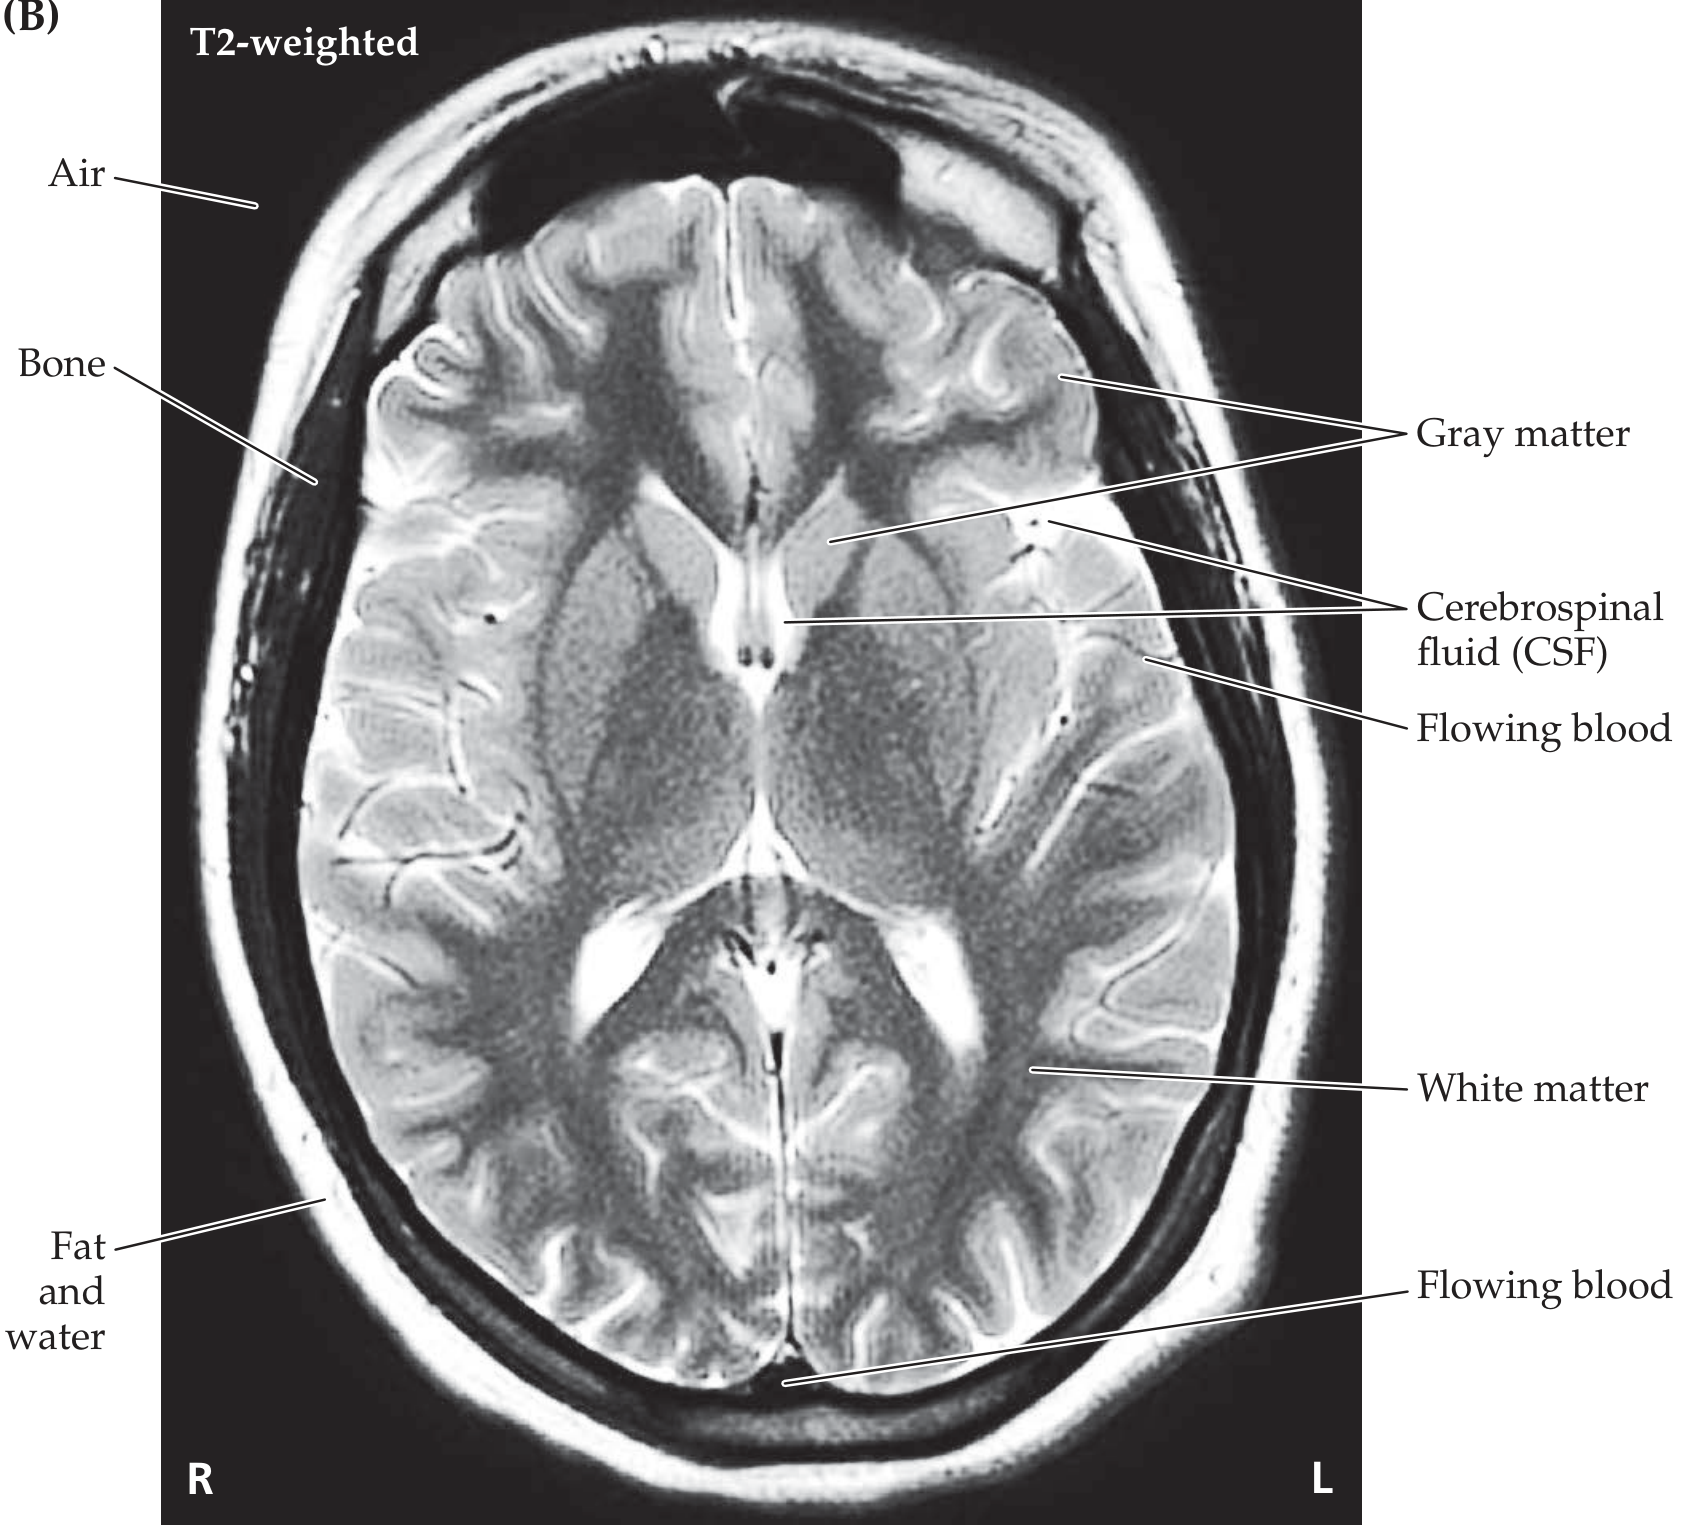
Notice: On T1 the ventricles (CSF) are dark; on T2 they are bright white. White matter is bright on T1, darker on T2. The images look like photographic negatives of each other.
| Tissue | T1-Weighted | T2-Weighted | FLAIR |
|---|---|---|---|
| Gray matter | Gray | Light gray | Light gray |
| White matter | White (bright) | Dark gray | Gray |
| CSF / Water | Black (dark) | White (bright) | Dark gray (suppressed) |
| Fat | White (bright) | White (bright on FSE)* | White* |
| Edema | Gray | White (bright) | White (bright) |
| Demyelination / gliosis | Gray | White (bright) | White (bright) |
| Bone / calcification | Black | Black | Black |
| Air | Black | Black | Black |
| Ferritin (iron) deposits | Dark gray | Black | Black |
| Subacute blood (methemoglobin) | White (bright) | Variable | Variable |
| Gadolinium enhancement | White (bright) | Slight darkening | - |
*Fat appears bright on FSE/TSE T2 sequences (most modern clinical scanners) due to "J-coupling" - unless fat suppression is also applied.
Why This Matters Clinically
T1-weighted is best for:
- Anatomy - looks like a dissection specimen; white matter is white, gray matter gray
- Fat-containing lesions - dermoid cysts, lipomas, fatty marrow
- Post-contrast imaging - gadolinium shortens T1, so enhancing lesions light up brightly
- Subacute hemorrhage - methemoglobin is T1-bright
- Post-gadolinium tumor delineation, abscess rim, blood-brain barrier breakdown
T2-weighted is best for:
- Detecting pathology - most disease processes increase tissue water content, making them bright on T2 (edema, infarct, tumor, infection, demyelination)
- CSF-containing spaces - spinal cord vs. CSF (the cord is intermediate signal against bright CSF background)
- Joint fluid - bright, outlining cartilage surfaces
- Disc degeneration - dehydrated discs lose their normal T2 brightness
- Brain lesions - "Most pathological findings are detected earlier and with greater accuracy on T2"
A useful memory trick:
T1 = "1 tissue" = anatomy. Water is dark, Fat is bright. T2 = "2 pathology" = disease. Water is WHITE (bright), it "Twinkles".
Or alternatively: "Watery things are T2 bright" - CSF, edema, cysts, most tumors, inflammation.
FLAIR (Fluid Attenuated Inversion Recovery)
FLAIR is essentially a modified T2 with an additional inversion pulse that nulls the CSF signal. This is extremely useful because:
- On standard T2, bright CSF in the ventricles/sulci can mask periventricular or cortical lesions sitting right next to it
- FLAIR suppresses CSF to dark gray while keeping edema, demyelination, and gliosis bright
- This makes it the sequence of choice for Multiple Sclerosis plaques, cortical strokes, and subarachnoid hemorrhage detection
Effect of Gadolinium Contrast
Gadolinium is a paramagnetic agent that shortens both T1 and T2:
- The T1 shortening effect dominates clinically - areas of gadolinium uptake become bright on T1
- Post-contrast T1 images are used to detect blood-brain barrier breakdown (tumor, abscess, active demyelination, meningitis)
- In intra-axial brain lesions (inside the brain parenchyma), enhancement = BBB disruption
- In extra-axial lesions (outside the brain), enhancement = hypervascularity of the lesion
Fast Spin Echo (FSE) / Turbo Spin Echo (TSE)
Standard T2 sequences have a very long TR (3000 ms+), making them time-consuming. FSE acquires multiple phase-encoding steps per RF excitation, greatly reducing scan time while maintaining similar T2 contrast. One caveat: fat is brighter on FSE than conventional SE T2 due to J-coupling, which can potentially obscure vertebral metastases on spine imaging unless fat suppression is added.
Sources:
- Neuroanatomy through Clinical Cases, 3rd Edition (9781605359625), p. 117-118 - table and images
- Rheumatology 2-Volume Set, 2022 (9780702081330), p. 403 - MRI contrast section
- Grainger & Allison's Diagnostic Radiology (9780323760751), p. 1228 - spin echo T2 section
- Radiology Cafe - T1, T2 and PD Weighted Imaging
This is a shared conversation. Sign in to Orris to start your own chat.