
Normal urinary output Assessment type descriptive writing of urime output and factors affecting
normal urinary output assessment factors affecting urine output nursing
Normal Urinary Output: Assessment and Factors Affecting It
1. Definition of Urine and Urinary Output
- Tietz Textbook of Laboratory Medicine, 7th Edition
2. Normal Urinary Output Values
| Age Group | Normal Output (mL/kg/hr) | Average Daily Output (mL/24 hr) | Notes |
|---|---|---|---|
| Infants (0-1 year) | > 2.0 | 400-500 | Immature kidneys, higher rate |
| Children (1-12 years) | 1.0-2.0 | 500-1,000 | Varies with activity and hydration |
| Adults | 0.5-1.5 | 800-2,000 | Standard clinical norm |
| Elderly | ~0.5 | 500-1,500 | May decrease with age-related GFR decline |
| Neonates (end of 1st week) | - | 100-120 mL/kg/day | Minimum post-surgical acceptable: 40 mL/kg/day (~2 mL/kg/hr) |
- Tietz Textbook of Laboratory Medicine, 7th Edition
- Pye's Surgical Handicraft, 22nd Edition
- Schwartz's Principles of Surgery, 11th Edition
3. Descriptive Assessment of Urinary Output
A. Volume
- Normal adult: 0.5-1.5 mL/kg/hr or 800-2,000 mL/24 hr
- Any persistent change outside this range requires clinical investigation
B. Colour
- Pale straw/light yellow: Well hydrated; dilute urine (low specific gravity)
- Dark amber/orange: Concentrated urine; dehydration, reduced intake
- Red/pink: Haematuria (blood in urine), myoglobinuria (rhabdomyolysis), or drugs (rifampicin, beets)
- Red urine during cardiopulmonary bypass: May indicate excessive red cell haemolysis or a transfusion reaction - Morgan and Mikhail's Clinical Anesthesiology, 7th Edition
- Cloudy/turbid: Urinary tract infection (UTI), pyuria, phosphaturia
- Dark brown/cola-coloured: Hepatitis, haemolysis, myoglobinuria
C. Clarity / Transparency
D. Odour
- Normal: Faint, slightly aromatic
- Ammonia smell: Bacterial decomposition (UTI)
- Fruity/sweet smell: Ketonuria (diabetic ketoacidosis, starvation)
- Foul smell: Infection
E. Specific Gravity (Concentration)
- Normal range: 1.003 - 1.030
- Low SG (1.001-1.003): Diabetes insipidus, overhydration
- High SG (>1.030): Dehydration, SIADH, glycosuria
F. pH
- Normal: 5.0 - 6.0 (slightly acidic)
- Alkaline urine (>7): UTI with urease-producing organisms, renal tubular acidosis, vegetarian diet
- Very acidic urine (<5): Metabolic acidosis, high protein diet, starvation
G. Frequency and Pattern
- Normal: 4-8 times/day, 300-400 mL per void
- Frequency without increased volume: bladder irritation, UTI, reduced capacity
- Nocturia: >1 void at night - may indicate heart failure, diabetes, BPH, or UTI
4. Abnormal Urinary Output States
| Term | Definition | Common Causes |
|---|---|---|
| Oliguria | < 400 mL/day (or <0.5 mL/kg/hr for 6+ hrs) | Dehydration, hypovolaemia, AKI, shock, urinary catheter blockage |
| Anuria | < 100 mL/day | Severe renal failure, bilateral ureteric obstruction, profound shock |
| Polyuria | > 3,000 mL/day (or >2.5 L/day by some definitions) | Diabetes mellitus, diabetes insipidus, diuretics, excessive fluid intake, hypercalcaemia |
| Nocturia | Frequent urination at night | Diabetes, heart failure, UTI, BPH |
| Dysuria | Painful urination | UTI, urethritis, interstitial cystitis |
- Tietz Textbook of Laboratory Medicine, 7th Edition
- OpenStax Fundamentals of Nursing - Factors Affecting Urinary Elimination
5. Factors Affecting Urinary Output
A. Physiological / Intrinsic Factors
-
Fluid Intake The most direct determinant. Increased oral or intravenous fluid intake raises urine volume as the kidneys excrete excess water to maintain osmotic balance. Reduced intake leads to concentrated, lower-volume urine.
-
Age
- Infants produce more urine per kg due to immature renal tubular reabsorption
- Elderly patients have a reduced GFR and diminished renal reserve, producing less concentrated urine and being more vulnerable to both dehydration and fluid overload
- Age-related changes must be factored into interpreting urine output norms
-
Body Weight Larger individuals have higher absolute urine production; hence weight-based formulas (mL/kg/hr) are used clinically.
-
Sex / Hormonal Status Oestrogen and progesterone influence sodium and water retention. Pregnancy increases blood volume and GFR, thereby increasing urine output. Menstrual cycle phases may subtly affect output.
-
Antidiuretic Hormone (ADH / Vasopressin) ADH is released by the posterior pituitary in response to increased plasma osmolality or reduced blood volume. It acts on the renal collecting ducts to reabsorb water, decreasing urine volume and increasing concentration. Absence or resistance to ADH (diabetes insipidus) causes massive dilute polyuria.
-
Aldosterone and RAAS The renin-angiotensin-aldosterone system regulates sodium (and thus water) reabsorption in the distal nephron. Activation (e.g., in hypovolaemia or heart failure) leads to sodium and water retention - reduced urine output. Changes in blood flow and the RAAS are primary regulators of renal water and sodium output. - Barash Clinical Anesthesia, 9th Edition
-
Glomerular Filtration Rate (GFR) GFR is the volume of plasma filtered per minute (~125 mL/min in healthy adults = ~180 L/day filtered, reduced to ~1-2 L urine). Any drop in GFR (renal disease, reduced perfusion pressure) directly reduces urine output.
-
Blood Pressure / Renal Perfusion Pressure Increased arterial pressure causes pressure natriuresis and diuresis - urine volume and output rise. At 200 mmHg, urine output can be 4-6 times normal. Low blood pressure (hypotension, shock) sharply reduces renal perfusion and urine output. - Guyton and Hall Textbook of Medical Physiology
B. Pathological Factors
| Factor | Effect on Urine Output |
|---|---|
| Hypovolaemia / Dehydration | Oliguria - reduced renal perfusion activates RAAS and ADH |
| Shock (all types) | Oliguria or anuria; urine output < 0.5 mL/kg/hr is a key perfusion marker |
| Acute Kidney Injury (AKI) | Oliguria or anuria depending on severity and stage (KDIGO staging uses <0.5 mL/kg/hr as criterion) |
| Chronic Kidney Disease | Progressive decline in GFR reduces concentrating ability; may be polyuric early, oliguric late |
| Diabetes Mellitus | Osmotic diuresis from glucosuria causes polyuria |
| Diabetes Insipidus | Lack of ADH (central) or ADH resistance (nephrogenic) - massive dilute polyuria |
| Heart Failure | Reduced cardiac output lowers renal perfusion; oliguria; oedema with sodium retention |
| Urinary Tract Obstruction | Can cause oliguria/anuria (e.g., prostate hypertrophy, stones, tumour); also post-obstructive diuresis upon relief |
| Sepsis / Infection | Cytokine-mediated renal vasoconstriction reduces GFR; oliguria in septic shock |
| Cushing Syndrome | Excess cortisol with hyperaldosteronism - fluid and electrolyte disturbances affecting output |
| Liver Failure | Hepatorenal syndrome reduces renal perfusion and output |
C. Environmental and Lifestyle Factors
-
Temperature and Physical Activity Hot environments and vigorous exercise increase sweating (insensible fluid loss), leaving less circulating fluid available for renal excretion. This reduces urine output and increases concentration. In neonates nursed under overhead radiant heaters or receiving phototherapy for jaundice, insensible losses may increase fluid requirements by 50-200%, requiring careful monitoring of urinary output. - Pye's Surgical Handicraft, 22nd Edition
-
Diet
- High salt (sodium) intake promotes fluid retention and can alter output
- High protein diet increases urea production, driving obligatory water excretion
- Caffeine and alcohol inhibit ADH, causing diuresis (increased output)
- Vegetarian/high-fruit diets can alkalinise urine
-
Medications
- Diuretics (furosemide, thiazides): Directly increase urine output by blocking tubular reabsorption
- Thiazide diuretics in nephrogenic diabetes insipidus paradoxically decrease output by inducing volume depletion and reducing water delivery to collecting tubules - Morgan and Mikhail's Clinical Anesthesiology
- NSAIDs: Reduce renal prostaglandin synthesis, decrease GFR, may cause oliguria
- ACE inhibitors / ARBs: Reduce GFR, particularly in bilateral renal artery stenosis
- IV fluids: Increase output proportionally
- Vasopressors: Improve renal perfusion in shock, increase output
-
Surgical / Anaesthetic Factors Surgical manipulation, major blood loss, general anaesthesia, and CPB can all reduce renal perfusion and urine output. An indwelling urinary catheter is placed routinely during anaesthesia to monitor output as a surrogate for organ perfusion. Suddenly decreased or minimal urine output post-operatively requires immediate attention: likely causes include volume depletion, urinary catheter blockage, or urinary leak - Schwartz's Principles of Surgery, 11th Edition
6. Clinical Significance of Urine Output Monitoring
- Urine output is a direct real-time indicator of renal perfusion and function
- A drop to < 0.5 mL/kg/hr for 6 hours meets KDIGO criteria for Stage 1 AKI
- In shock assessment, hourly urine output target of 0.5-1 mL/kg/hr is standard
- Critically ill patients, post-operative patients, and those on IV fluids require strict intake and output (I&O) charting every hour or every 8 hours
- Urine output must always be interpreted alongside clinical signs: skin turgor, mucous membranes, blood pressure, heart rate, serum creatinine, and BUN
Summary Table
| Parameter | Normal Value | Significance if Abnormal |
|---|---|---|
| Volume (adult) | 800-2,000 mL/day | Oliguria or polyuria - see definitions above |
| Rate | 0.5-1.5 mL/kg/hr | <0.5 mL/kg/hr = oliguria; indicates poor perfusion |
| Colour | Pale straw to amber | Dark = concentrated; red = haematuria/haemolysis |
| pH | 5.0-6.0 | Alkaline = infection/RTA; very acidic = metabolic acidosis |
| Specific Gravity | 1.003-1.030 | Low = DI/overhydration; high = dehydration/SIADH |
| Clarity | Clear | Turbid = infection, cells, crystals |
| Odour | Faint aromatic | Ammoniacal = UTI; fruity = DKA/ketonuria |
| Frequency | 4-8 voids/day | Increased with infection, decreased with obstruction |
- Tietz Textbook of Laboratory Medicine, 7th Edition - definitions, normal values
- Guyton and Hall Textbook of Medical Physiology - pressure natriuresis, GFR regulation
- Schwartz's Principles of Surgery, 11th Edition - perioperative urine monitoring
- Morgan and Mikhail's Clinical Anesthesiology, 7th Edition - intraoperative monitoring, ADH effects
- Pye's Surgical Handicraft, 22nd Edition - paediatric and neonatal norms
- Barash Clinical Anesthesia, 9th Edition - RAAS and renal regulation
Gram positive and gram negative
gram positive vs gram negative bacteria cell wall structure differences comparison microbiology
gram positive gram negative bacteria cell wall structure comparison diagram
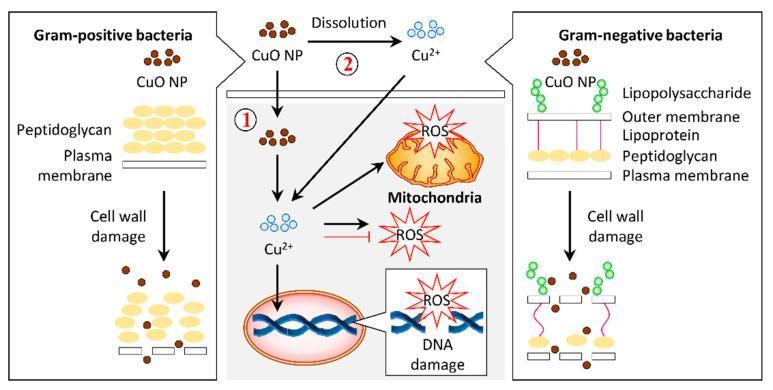
A pathophysiology diagram illustrating the antibacterial mechanisms of copper oxide nanoparticles (CuO NPs) on Gram-positive and Gram-negative bacteria. The left panel shows Gram-positive bacteria with a thick peptidoglycan layer above a plasma membrane. The right panel shows Gram-negative bacteria with a complex cell wall including lipopolysaccharides, an outer membrane, lipoproteins, and a thin peptidoglycan layer. Both panels demonstrate CuO NPs causing cell wall damage and lysis. The central panel details the intracellular bactericidal pathway labeled as mechanism 1 and 2. Mechanism 1 involves the internalization of CuO NPs into the cytosol, while mechanism 2 illustrates the dissolution of CuO NPs into copper ions (Cu2+) which then permeate the cell. Inside the cell, both Cu2+ ions and CuO NPs induce the production of reactive oxygen species (ROS). The resulting oxidative stress leads to mitochondrial disruption and DNA damage, ultimately resulting in cell death. This infographic highlights the role of nanoparticle morphology and ion release in targeting bacterial structural and metabolic integrity.
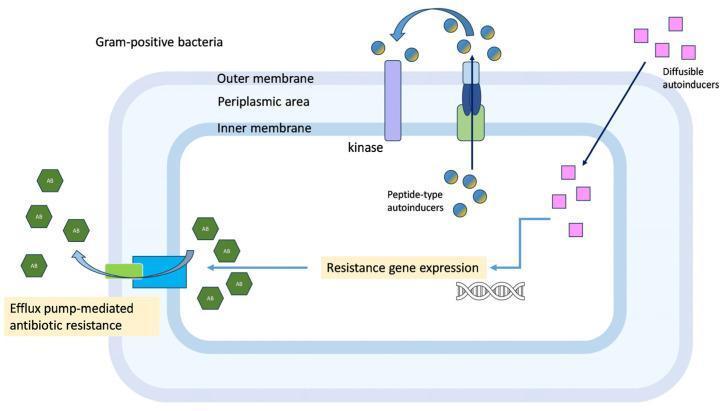
This pathophysiology diagram illustrates quorum-sensing-regulated resistance mechanisms in Gram-positive bacteria. The bacterial cell structure is depicted with three distinct layers: an inner membrane, a periplasmic area, and an outer membrane. The diagram highlights two primary signaling pathways involved in cell-to-cell communication. The first involves 'peptide-type autoinducers' (represented as blue/yellow spheres), which are processed and secreted via a transmembrane receptor and then detected by a membrane-spanning kinase. The second pathway involves 'diffusible autoinducers' (pink squares) that freely enter the cell. Both pathways converge to trigger 'resistance gene expression' at the DNA level. This genetic activation leads to physiological outcomes, specifically 'efflux pump-mediated antibiotic resistance,' where a transmembrane efflux pump actively transports antibiotic molecules (green hexagons) out of the intracellular space. This educational graphic demonstrates the interplay between bacterial signaling and multidrug resistance mechanisms.
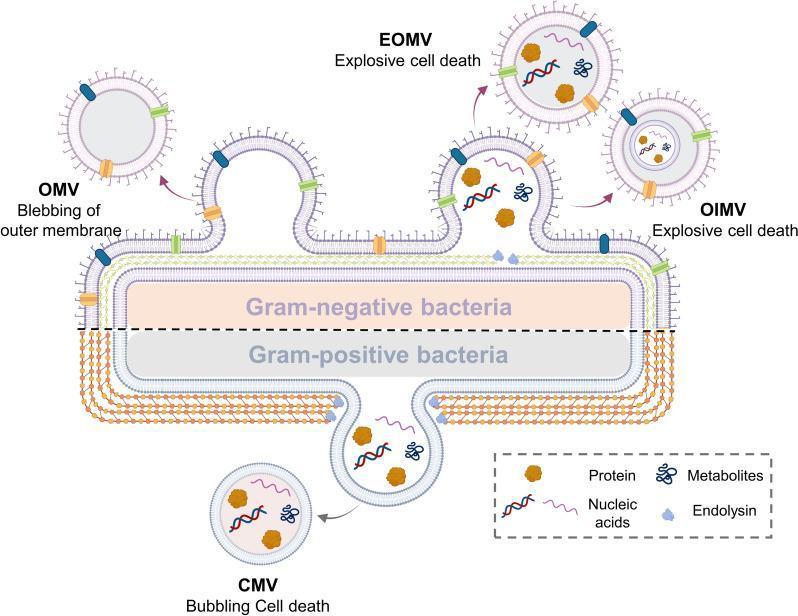
A medical microbiology diagram illustrating the biogenesis and classification of bacterial extracellular vesicles (BEVs) from Gram-negative and Gram-positive bacteria. The top half depicts a Gram-negative bacterium with its triple-layered cell envelope (outer membrane, periplasmic space, and cytoplasmic membrane). Three vesicle formation mechanisms are shown: blebbing of the outer membrane creating Outer Membrane Vesicles (OMV), and explosive cell death leading to Explosive Outer Membrane Vesicles (EOMV) and Outer-Inner Membrane Vesicles (OIMV). The bottom half represents a Gram-positive bacterium characterized by a thick peptidoglycan cell wall and a single cytoplasmic membrane. This section illustrates 'bubbling cell death' resulting in Cytoplasmic Membrane Vesicles (CMV). A legend identifies the internal cargo within these vesicles, including proteins (brown shapes), nucleic acids (wavy lines), metabolites (blue branched icons), and endolysin (light blue shapes). This pathophysiology diagram highlights the structural differences in bacterial envelopes and the various pathways—blebbing, explosive death, and bubbling—that contribute to BEV diversity and composition.
Gram-Positive and Gram-Negative Bacteria
1. The Gram Stain - Historical Background and Principle
- Jawetz, Melnick & Adelberg's Medical Microbiology, 28th Edition
2. The Gram Staining Procedure (Steps)
| Step | Reagent Used | Action |
|---|---|---|
| 1. Primary stain | Crystal violet (purple dye) | Stains all bacteria purple |
| 2. Mordant | Gram's iodine | Forms a crystal violet-iodine complex inside the cell |
| 3. Decolorization | Alcohol or acetone | Gram-positive retain the complex; Gram-negative are decolorized |
| 4. Counterstain | Safranin (red/pink dye) | Gram-negative cells take up the red counterstain |
- Gram-positive = Purple/violet
- Gram-negative = Red/pink
3. Cell Wall Structure - The Basis of Gram Staining
A. Gram-Positive Cell Wall
- Cytoplasmic membrane (inner membrane)
- Thick peptidoglycan layer (up to 40 sheets, 30-100 nm thick, comprising 50% of cell wall material)
- Teichoic acids embedded throughout
- Made of alternating N-acetylglucosamine (NAG) and N-acetylmuramic acid (NAM) units joined by β1→4 linkages
- Cross-linked tetrapeptide side chains give it rigidity
- Up to 40 sheets thick; forms a single giant cross-linked molecule
- Comprises up to 50% of the dry weight of the wall
- Polymers of glycerophosphate or ribitol phosphate; unique to Gram-positive bacteria
- Constitute up to 50% of the dry weight of the wall and 10% of the total cell dry weight
- Two types:
- Wall teichoic acid (WTA): covalently linked to peptidoglycan
- Lipoteichoic acid (LTA): covalently linked to membrane glycolipid; extends through the cell wall to the surface
- They are negatively charged - partly responsible for the net negative charge of the cell surface
- Together with peptidoglycan, they form a polyanionic network providing elasticity, porosity, tensile strength, and electrostatic properties
- Constitute major surface antigens of Gram-positive species
- Jawetz, Melnick & Adelberg's Medical Microbiology, 28th Edition
- Sherris & Ryan's Medical Microbiology, 8th Edition
B. Gram-Negative Cell Wall
- Cytoplasmic membrane (inner membrane)
- Periplasmic space - contains enzymes and transport proteins
- Thin peptidoglycan layer (1-2 sheets only, a few nm thick, 5-10% of wall material)
- Outer membrane - a unique lipid bilayer with LPS, lipoproteins, and porin proteins
- Only 1-2 sheets, forming 5-10% of wall material
- Most Gram-negative bacteria have diaminopimelic acid (DAP) at position 3 of tetrapeptide (vs. L-lysine in Gram-positive)
- Cross-bridged via direct peptide linkage between DAP and terminal D-alanine
- Located between the inner cytoplasmic membrane and the outer membrane
- Contains enzymes for nutrient processing, binding proteins, and components of the RAAS transport system
- A lipid bilayer with:
- Lipopolysaccharide (LPS) / Endotoxin - the outer leaflet of the outer membrane contains LPS, which is extremely toxic to humans and animals. Even minute amounts released into the circulation cause fever, shock, and systemic inflammation. LPS has three parts: Lipid A (toxic anchor), Core polysaccharide, and O-antigen (outer polysaccharide chain that varies between species).
- Porins (e.g., OmpC, OmpF, OmpD in E. coli): Trimeric proteins that span the outer membrane and form channels allowing free diffusion of small hydrophilic solutes. Different species have different exclusion limits (~MW 600 in E. coli; up to >3,000 in Pseudomonas).
- Lipoproteins (e.g., Braun's lipoprotein): Anchor the outer membrane to the thin peptidoglycan layer
- OmpA protein: Helps anchor the outer membrane to the peptidoglycan and serves as the sex pilus receptor in conjugation
- Jawetz, Melnick & Adelberg's Medical Microbiology, 28th Edition
- Sherris & Ryan's Medical Microbiology, 8th Edition
- Robbins & Cotran Pathologic Basis of Disease
4. Comparison Table: Gram-Positive vs. Gram-Negative
| Feature | Gram-Positive | Gram-Negative |
|---|---|---|
| Gram stain colour | Purple/Violet | Red/Pink |
| Cell wall structure | Monoderm (single membrane) | Diderm (two membranes) |
| Peptidoglycan layer | Thick (up to 40 sheets; 30-100 nm) | Thin (1-2 sheets; few nm) |
| Peptidoglycan content | 50% of cell wall | 5-10% of cell wall |
| Teichoic acids | Present (WTA and LTA) | Absent |
| Outer membrane | Absent | Present |
| Lipopolysaccharide (LPS) / Endotoxin | Absent | Present |
| Porin proteins | Absent (no outer membrane) | Present |
| Periplasmic space | Absent | Present |
| Lipoproteins | Absent | Present |
| Amino acid at peptide position 3 | L-lysine (usually) | Diaminopimelic acid (DAP) |
| Sensitivity to penicillin | Generally more susceptible | Generally less susceptible |
| Sensitivity to lysozyme | Yes (thick PG cleaved) | No (protected by outer membrane) |
| Crystal violet retention | Retained (thick PG traps complex) | Lost (thin PG + outer membrane) |
- Jawetz, Melnick & Adelberg's Medical Microbiology, 28th Edition (Table 2-1)
- Medical Microbiology, 9th Edition
5. Representative Examples
Gram-Positive Bacteria (Purple)
| Category | Examples | Clinical Significance |
|---|---|---|
| Cocci | Staphylococcus aureus | Skin, wound, bloodstream infections, MRSA |
| Streptococcus pyogenes | Pharyngitis, rheumatic fever, cellulitis | |
| Streptococcus pneumoniae | Pneumonia, meningitis, otitis media | |
| Enterococcus spp. | UTI, endocarditis, VRE strains | |
| Bacilli | Bacillus anthracis | Anthrax |
| Clostridium perfringens | Gas gangrene, food poisoning | |
| Clostridium difficile | Pseudomembranous colitis | |
| Listeria monocytogenes | Meningitis in neonates/immunocompromised | |
| Corynebacterium diphtheriae | Diphtheria |
Gram-Negative Bacteria (Pink/Red)
| Category | Examples | Clinical Significance |
|---|---|---|
| Cocci | Neisseria meningitidis | Meningitis, septicaemia |
| Neisseria gonorrhoeae | Gonorrhoea, PID | |
| Enteric rods | Escherichia coli | UTI, diarrhoea, sepsis, neonatal meningitis |
| Klebsiella pneumoniae | Pneumonia, UTI, sepsis | |
| Salmonella typhi | Typhoid fever | |
| Shigella spp. | Bacillary dysentery | |
| Helicobacter pylori | Peptic ulcer disease | |
| Non-enteric rods | Pseudomonas aeruginosa | Opportunistic infections, burns, cystic fibrosis |
| Haemophilus influenzae | Epiglottitis, pneumonia, meningitis | |
| Vibrio cholerae | Cholera | |
| Spirochetes | Treponema pallidum | Syphilis |
| Intracellular | Rickettsia spp. | Spotted fevers, typhus |
6. Clinical Significance and Antibiotic Implications
Why it Matters Clinically
-
Endotoxin (LPS) in Gram-negative infections: When Gram-negative bacteria die or are killed by antibiotics, LPS is released from the outer membrane. Even in minute amounts, endotoxin entering the circulation triggers fever, hypotension, cytokine storm, and can lead to septic shock and multi-organ failure. This is a major concern in treating Gram-negative sepsis. - Robbins & Cotran Pathologic Basis of Disease
-
Antibiotic susceptibility differences:
| Antibiotic Class | Active Against | Reason |
|---|---|---|
| Penicillins (narrow spectrum) | Primarily Gram-positive | The thick PG is the target; outer membrane limits access in Gram-negative |
| Vancomycin | Gram-positive only | Large glycopeptide cannot penetrate the outer membrane of Gram-negative |
| Aminoglycosides | Mainly Gram-negative | Penetrate outer membrane porins |
| Broad-spectrum penicillins (ampicillin, amoxicillin) | Both | Penetrate outer membrane via porins |
| Polymyxins (polymyxin B, colistin) | Gram-negative | Bind Lipid A of LPS, disrupt outer membrane; used for multi-drug resistant Gram-negatives |
| Carbapenems, 3rd/4th gen cephalosporins | Both (broad spectrum) | Penetrate outer membrane porins |
-
Lysozyme cleaves the β1→4 bond in peptidoglycan (NAG-NAM linkage). It is effective against Gram-positive bacteria (where thick PG is exposed), but not against Gram-negative bacteria (where the outer membrane shields the thin PG layer).
-
Gram stain as a rapid diagnostic tool: A Gram stain of clinical specimens (sputum, CSF, wound swabs, blood culture) can provide provisional identification within minutes, guiding empirical antibiotic therapy before culture results are available.
7. Why Gram-Positive Bacteria Retain Crystal Violet
- Crystal violet + iodine form a large complex inside the cell
- Alcohol dehydrates the thick, multi-layered peptidoglycan - the pores tighten
- The complex is trapped inside the thick PG layer
- The cell remains purple
Why Gram-Negative Bacteria Do NOT Retain Crystal Violet
- The thin peptidoglycan cannot trap the crystal violet-iodine complex efficiently
- The outer membrane (lipid-rich) is dissolved by alcohol during decolorization
- This creates channels through which the crystal violet-iodine complex washes out
- The colourless cell then takes up the safranin counterstain and appears red/pink
- Tietz Textbook of Laboratory Medicine, 7th Edition
Summary
| Gram-Positive | Gram-Negative | |
|---|---|---|
| Colour after Gram stain | Purple | Pink/Red |
| Key structure | Thick peptidoglycan + teichoic acids | Thin peptidoglycan + outer membrane + LPS |
| Endotoxin | No | Yes (LPS - major virulence factor) |
| Example organisms | Staph, Strep, Bacillus, Clostridium | E. coli, Pseudomonas, Neisseria, Salmonella |
| Antibiotic sensitivity | Sensitive to penicillin, vancomycin, lysozyme | Less sensitive; outer membrane is a barrier |
| Clinical concern | Exotoxins (protein toxins), biofilms | Endotoxin (LPS) - septic shock, antibiotic resistance |
- Jawetz, Melnick & Adelberg's Medical Microbiology, 28th Edition
- Sherris & Ryan's Medical Microbiology, 8th Edition
- Medical Microbiology, 9th Edition
- Robbins & Cotran Pathologic Basis of Disease