
ECG learning
Asking for Preferences
What aspect of ECG would you like to focus on? · What's your level?
Perfect - a full ECG curriculum for an intermediate learner. Let me pull everything from the medical library.
Searching sources...
Reading File
Finding Sources
Finding Sources
Finding Sources
Finding Sources
Finding Sources
Finding Sources
Finding Sources
Reading File
Reading File
Reading File
Loading Image
Finding Sources
Finding Sources
Reading File
Reading File
Loading Image
Reading File
Reading File
Loading Image
Reading File
Reading File
Excellent - I have rich material from Harrison's, Frameworks for Internal Medicine, and Costanzo Physiology. Let me fetch the key ischemia and STEMI images and the ST-elevation section.
Loading Image
Reading File
I now have comprehensive material from Harrison's 22E and Frameworks for Internal Medicine. Let me compile the full ECG learning guide.
ECG Learning Guide - Intermediate Level
Sources: Harrison's Principles of Internal Medicine 22E (2025), Frameworks for Internal Medicine, Costanzo Physiology 7E
Part 1 - The Basics: What the ECG is Recording
The ECG measures tiny potential differences on the body's surface that reflect the timing and sequence of myocardial depolarization and repolarization. Because different regions depolarize at different times (atria before ventricles, septum before free walls), voltage gradients arise between them - and it's these gradients the electrodes capture.
Paper speed and scale:
- Small box = 0.04 s (horizontal) / 0.1 mV (vertical)
- Large box = 0.2 s / 0.5 mV
- 300 large boxes = 1 minute (useful for rate calculation)
Part 2 - The Normal Waveform

| Component | What it represents | Normal value |
|---|---|---|
| P wave | Atrial depolarization | <120 ms, <2.5 mm |
| PR interval | SA node → AV node → Bundle of His (includes the P wave + isoelectric segment) | 120-200 ms |
| QRS complex | Ventricular depolarization | <120 ms |
| ST segment | Early ventricular repolarization (isoelectric normally) | Flat at baseline |
| T wave | Ventricular repolarization | Same polarity as QRS |
| QT interval | Total ventricular electrical activity | Varies with rate; QTc <440 ms (men), <460 ms (women) |
| U wave | Small, same polarity as T; prominent = hypokalemia or drugs (sotalol, amiodarone, quinidine) | ≤1 mm |
Key point: The QRS is similar in duration to the P wave despite the ventricles being far larger - because the His-Purkinje system conducts far faster than atrial myocardium. - Costanzo Physiology, p. 149
Part 3 - The Systematic 14-Point Approach
Per Harrison's 22E, the following 14 parameters should be assessed on every ECG (errors of omission are the most common mistake):
- Standardization and technical quality - Is the calibration marker 10 mm tall? Any lead reversals or artifact?
- Rhythm - Regular? Irregular? Identify P waves and their relationship to QRS
- Heart rate - "300 ÷ number of large boxes between R waves" (regular); or count QRS complexes × 6 (irregular)
- PR interval / AV conduction - Normal 120-200 ms
- QRS interval - Normal <120 ms; widening = bundle branch block or hyperkalemia
- QT/QTc interval - Corrected for rate using Bazett: QTc = QT ÷ √RR
- Mean QRS electrical axis
- P wave morphology
- QRS voltages - Tall = hypertrophy; low = pericardial effusion, obesity, emphysema
- Precordial R-wave progression - R grows V1→V6; transition at V3/V4
- Abnormal Q waves - >40 ms wide or >25% of following R = pathological
- ST segments - Elevation or depression
- T waves - Inversion, peaking
- U waves - Prominent? Alternating?
Part 4 - Electrical Axis
The axis describes the net direction of ventricular depolarization in the frontal plane. Use Lead I (0°) and aVF (+90°) as your two reference points.
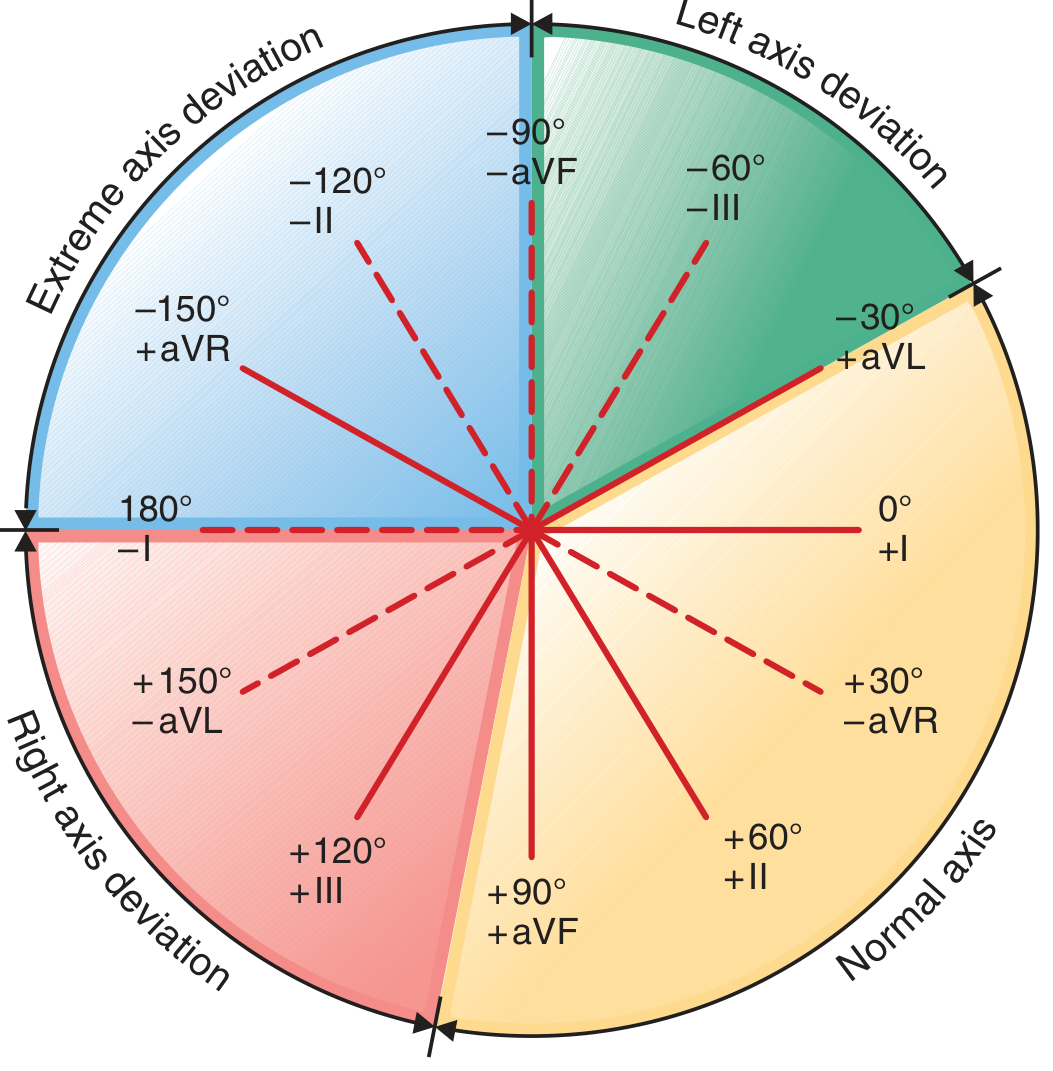
| Zone | Degrees | QRS in Lead I | QRS in aVF |
|---|---|---|---|
| Normal | -30° to +90° | Upright | Upright |
| Left axis deviation (LAD) | -30° to -90° | Upright | Negative |
| Right axis deviation (RAD) | +90° to +180° | Negative | Upright |
| Extreme | -90° to ±180° | Negative | Negative |
Causes:
- LAD: LVH, left anterior fascicular block (LAFB), inferior MI
- RAD: RVH, LPFB, lateral MI, pulmonary embolism (PE), WPW, left pneumothorax, lead reversal
Quick axis trick: If Lead I is upright and aVF is upright, the axis is normal. "Thumb up" in both = normal.
Part 5 - Bundle Branch Blocks
Complete BBB = QRS ≥120 ms. Look at V1 and V6 to differentiate:
| RBBB | LBBB | |
|---|---|---|
| V1 | rSR' ("rabbit ears" or "M" pattern) | Deep broad QS or rS (no R' in V1) |
| V6 | Slurred S wave | Tall, broad, notched R wave ("M" shape in V6) |
| Axis | Normal or RAD | Normal or LAD |
| Clinical | Often benign; also PE, RVH, ASD | Always abnormal; correlates with LVD, CAD |
| Ischemia diagnosis | Possible through ST-T changes | Sgarbossa criteria needed (STEMI often masked) |
With LBBB, normal early septal activation is reversed (septum depolarizes right to left instead of left to right), so QRS morphology is completely altered. Never interpret ST changes in LBBB at face value - Harrison's 22E, p. 1916
Part 6 - Ischemia and Infarction Patterns
The ST Vector and "Current of Injury"
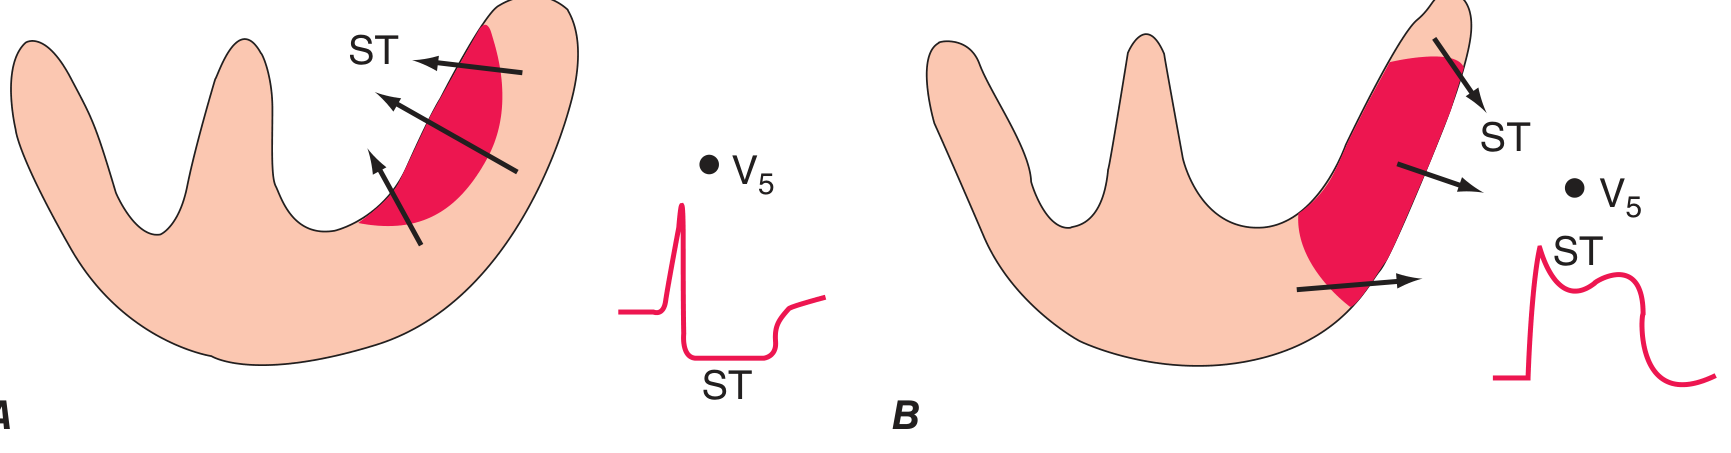
- Subendocardial ischemia - ST vector points inward toward cavity → ST depression in overlying leads (demand ischemia, NSTEMI)
- Transmural / epicardial ischemia - ST vector points outward → ST elevation in overlying leads (STEMI)
Localizing the Territory
| ST elevation in... | Territory | Culprit artery |
|---|---|---|
| V1-V4 | Anterior wall | LAD |
| I, aVL, V5-V6 | Lateral wall | LCx |
| II, III, aVF | Inferior wall | RCA (80%), LCx (20%) |
| V1-V2 (tall R, ST depression) | Posterior wall | RCA or LCx (reciprocal) |
| V1, II, III, aVF | RV involvement | Proximal RCA |
Evolutionary ECG Changes in STEMI
- Hyperacute T waves - Very tall, broad T waves (earliest sign, often missed)
- ST elevation - "Current of injury"
- Q wave formation - Pathological Q waves develop over hours-days (necrosis)
- T-wave inversion - As ST normalizes
- ST normalization - With reperfusion or time
Wellens Syndrome
Deep symmetric T-wave inversions in V1-V4 (with or without enzyme elevation) = critical LAD stenosis. These patients are at high risk for anterior STEMI. Do NOT stress test them. - Harrison's 22E, p. 1916
Pathological Q Waves
- Width >40 ms (one small box) OR depth >25% of the following R wave
- Represent electrically silent (necrotic) myocardium
- May resolve in small infarcts; persist in large ones
- Posterior MI shows no Q waves in standard leads - instead look for tall R in V1/V2 + ST depression V1-V2 (reciprocal)
Part 7 - AV Blocks
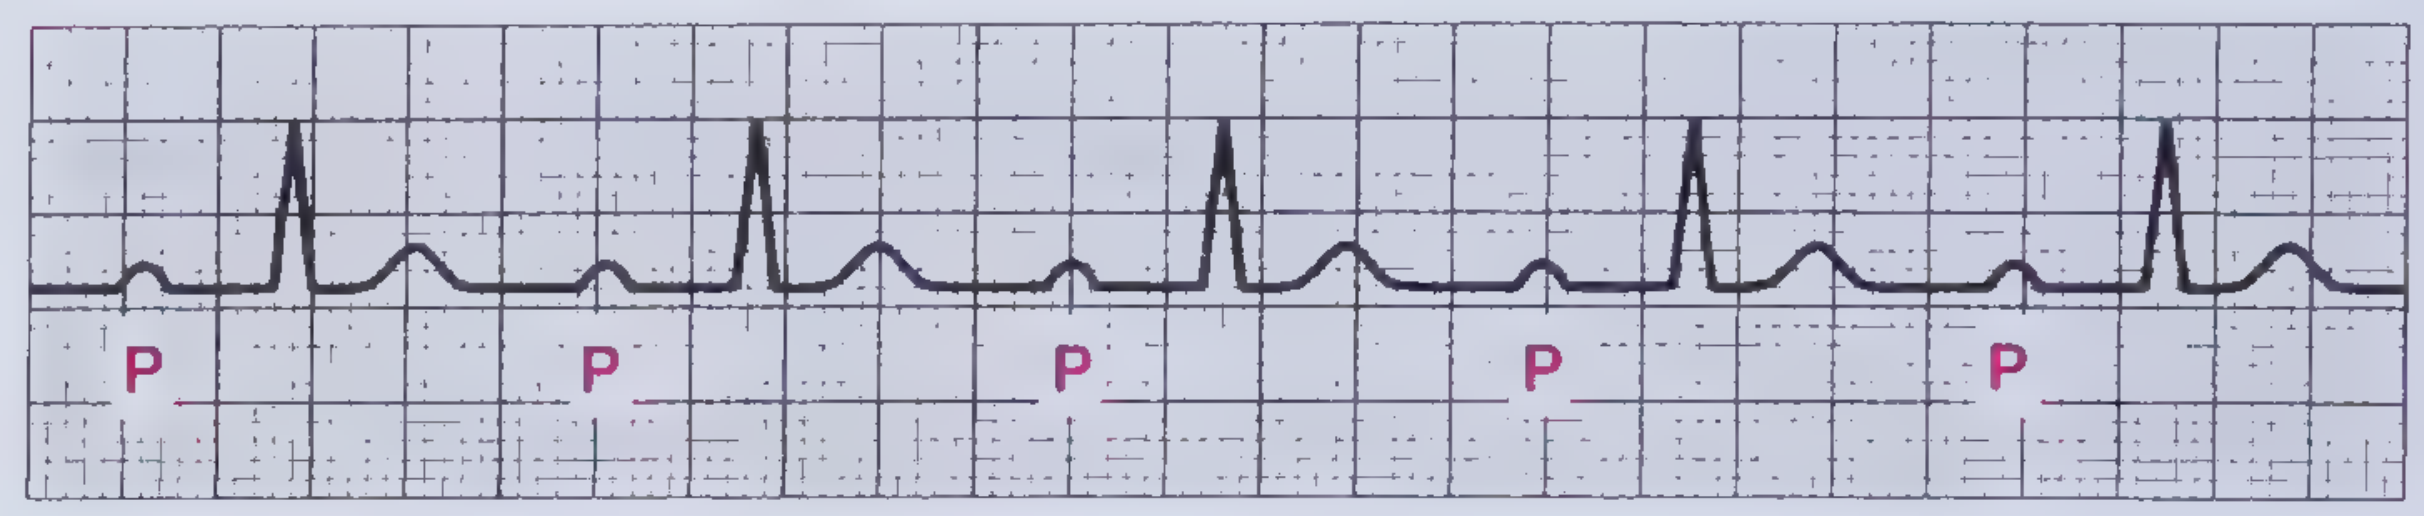
First-Degree AV Block
- ECG: PR interval >200 ms (>5 small boxes), every P followed by a QRS
- Location of block: AV node
- Significance: Usually benign; caused by drugs (beta-blockers, digoxin), Lyme disease, inferior MI, athletic bradycardia
- Treatment: Usually none; pacemaker only if PR >300 ms with symptoms
Second-Degree AV Block
Mobitz I (Wenckebach)
- PR progressively lengthens → dropped beat (P without QRS) → cycle resets
- Block is in the AV node
- Associated with inferior MI (RCA supplies AV node in 80%)
- Generally benign; rarely needs pacing unless symptomatic/hemodynamically unstable
Mobitz II
- Constant PR interval → sudden dropped beat with no warning
- Block is infranodal (bundle of His or bundle branches)
- QRS is often wide (BBB pattern)
- Higher risk than Mobitz I; can progress to complete block
- Permanent pacemaker usually indicated
2:1 Block - Every other P is blocked. Cannot classify as Mobitz I or II without seeing ≥2 conducted beats in a row. Wide QRS → likely Mobitz II (infranodal). Narrow QRS → likely Mobitz I (AV nodal).
Third-Degree (Complete) AV Block
- ECG: Complete AV dissociation - P waves and QRS complexes march at independent rates (P rate > QRS rate)
- Ventricular escape rhythm: narrow (40-60 bpm, junctional) or wide (20-40 bpm, ventricular)
- Causes: inferior MI, Lyme disease, congenital, iatrogenic (ablation), degenerative (Lenègre's/Lev's disease)
- Emergency: Hemodynamic compromise → atropine → transcutaneous pacing → permanent pacemaker
Part 8 - Supraventricular Arrhythmias
Atrial Fibrillation (AF)
- ECG: Absent P waves, irregularly irregular rhythm, wavy baseline (fibrillatory baseline)
- Rate: Ventricular rate depends on AV node conduction
- Causes: HTN, valvular disease, alcohol, thyrotoxicosis, sleep apnea, post-cardiac surgery
- Management priorities: Rate control vs rhythm control; anticoagulation (CHA₂DS₂-VASc scoring)
Atrial Flutter
- ECG: Sawtooth flutter waves at 250-350 bpm (typically 300 bpm), best in II, III, aVF and V1
- Typically 2:1 conduction → ventricular rate ~150 bpm (classic "regular tachycardia at 150 = flutter until proven otherwise")
- Variable conduction produces irregular rhythm
AV Nodal Reentrant Tachycardia (AVNRT)
- Most common regular SVT; narrow QRS at 150-250 bpm
- P waves buried in or just after QRS (retrograde, negative in II/III/aVF)
- Treat: vagal maneuvers → adenosine → beta-blockers/CCBs
WPW (Wolff-Parkinson-White)
- ECG: Short PR (<120 ms) + delta wave (slurred QRS upstroke) + wide QRS
- Accessory pathway (Bundle of Kent) bypasses AV node
- Risk: If AF occurs in WPW, accessory pathway can conduct at very rapid rates → ventricular fibrillation
- Never use AV nodal blocking drugs (adenosine, digoxin, verapamil) in WPW + AF - can precipitate VF
Part 9 - Ventricular Arrhythmias
Ventricular Tachycardia (VT)
- Wide complex tachycardia (QRS ≥120 ms) at rate >100 bpm
- AV dissociation on ECG = VT until proven otherwise
- Fusion beats (QRS morphology between sinus and ectopic) = diagnostic of VT
- Capture beats (narrow QRS in midst of wide complex tachycardia) = diagnostic of VT
- Brugada criteria and aVR algorithm help distinguish VT from SVT with aberrancy
Ventricular Fibrillation (VF)
- Chaotic, no organized QRS; immediate CPR + defibrillation
Torsades de Pointes
- Polymorphic VT with QRS twisting around the isoelectric line
- Triggered by long QT (congenital or acquired: hypokalemia, hypomagnesemia, QT-prolonging drugs)
- Treatment: IV magnesium sulfate; correct electrolytes; stop offending drugs; temporary pacing (overdrive pacing)
Part 10 - Electrolyte and Drug Effects
| Finding | Cause |
|---|---|
| Peaked T waves | Hyperkalemia (early) |
| Wide QRS + sine wave | Severe hyperkalemia |
| Flat P waves + wide QRS | Severe hyperkalemia |
| Prolonged QT | Hypocalcemia, hypomagnesemia, hypokalemia, drugs (sotalol, amiodarone, antipsychotics, TCAs, macrolides, fluoroquinolones) |
| Short QT / shortened ST | Hypercalcemia |
| Prominent U waves | Hypokalemia, amiodarone, sotalol, quinidine |
| Electrical alternans | Pericardial effusion / tamponade (alternating QRS amplitude) |
| Digoxin effect | "Reverse tick" ST (scooped ST depression), PR prolongation |
Part 11 - Special Patterns Worth Knowing
| Pattern | Key ECG findings | Diagnosis |
|---|---|---|
| S1Q3T3 | S wave in I, Q wave in III, T inversion in III | Acute PE / cor pulmonale |
| Brugada pattern | Coved ST elevation V1-V2 + RBBB morphology | Brugada syndrome (sudden death risk) |
| Osborn (J) waves | Positive deflection at J point | Hypothermia |
| Early repolarization | Concave ST elevation V2-V5, notched J point in young athletes | Usually benign; some risk in inferior leads |
| de Winter T waves | Tall hyperacute T waves + ST depression V1-V4 + no ST elevation | Proximal LAD occlusion (STEMI equivalent!) |
| Aslanger pattern | Inferior ST elevation + ST depression limited to V4-V6 | Inferior STEMI + multivessel disease |
Quick Reference: Rate Calculation
| R-R large boxes | Heart rate |
|---|---|
| 1 | 300 bpm |
| 2 | 150 bpm |
| 3 | 100 bpm |
| 4 | 75 bpm |
| 5 | 60 bpm |
| 6 | 50 bpm |
Mnemonic: 300, 150, 100, 75, 60, 50
Recommended Learning Resources
- Goldberger's Clinical Electrocardiography: A Simplified Approach, 10th ed. (2024) - the standard self-study text
- ECG Wave-Maven (ecg.bidmc.harvard.edu) - free Harvard online practice library with 300+ real ECGs
- Amal Mattu's ECG Weekly - high-yield video cases for clinical learners
- LifeInTheFastLane.com/ecg-library - excellent free reference with images
This guide draws from: Harrison's Principles of Internal Medicine 22E (2025), Frameworks for Internal Medicine, and Costanzo Physiology 7E.
This is a shared conversation. Sign in to Orris to start your own chat.