
Nutritional status indicator
nutritional status indicators assessment methods clinical
nutritional assessment anthropometric biochemical clinical indicators diagram
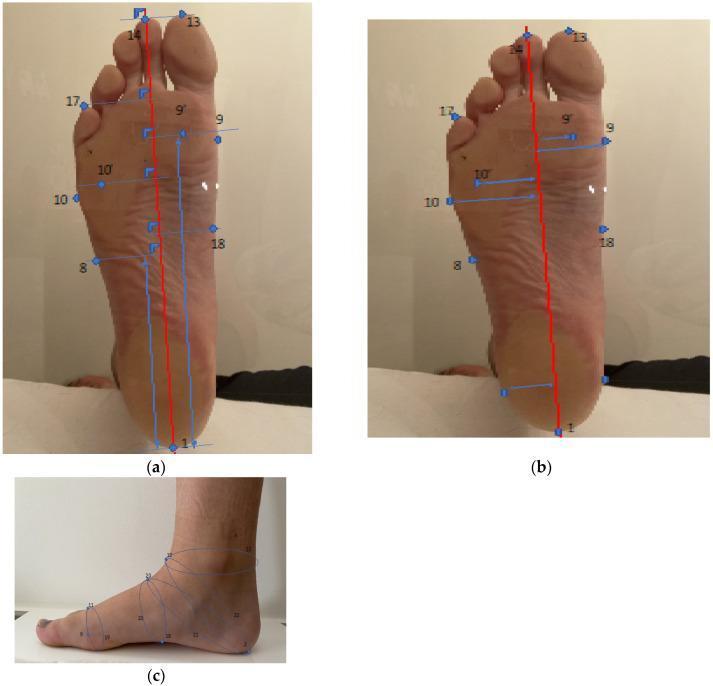
Anatomical diagram and clinical photographs demonstrating anthropometric foot measurement protocols for orthotics and orthopedic shoe manufacturing. Figure (a) displays a plantar view of a human foot with a red longitudinal axis extending from the pternion (heel) through the second digit (toe 2); blue indicators mark length measurements at various anatomical nodes. Figure (b) shows the same plantar orientation but emphasizes width measurements, with blue arrows extending perpendicularly from the longitudinal axis to the medial and lateral borders of the foot, including landmarks such as the hallux (13) and metatarsophalangeal regions (9, 10, 17, 18). Figure (c) provides a medial sagittal profile view of the foot and ankle, illustrating circumference measurements. Blue lines encircle the ankle joint, instep, and forefoot areas to define volume and girth parameters. This visualization represents the automated output of a 3D full-foot laser scanner used in podiatry and biomechanics to quantify pedal morphology with high precision for clinical and industrial application.
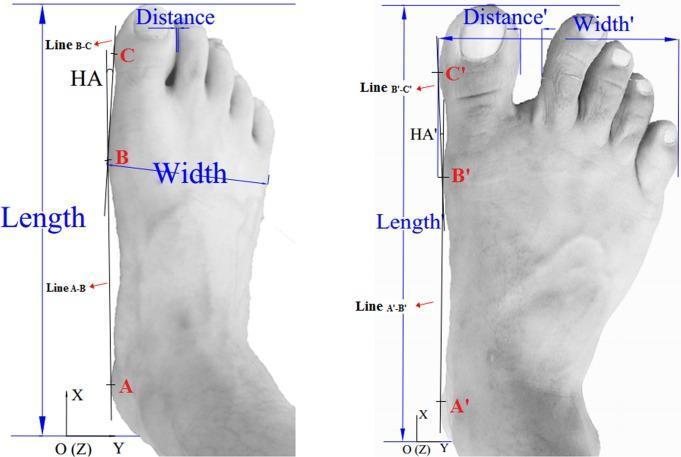
This clinical diagram illustrates the anthropometric assessment of human foot morphology using 2D/3D surface data, specifically comparing a habitually shod foot (left) and an unshod foot (right). The image depicts a dorsal view with quantitative measurements for foot length, width, and interdigital distance between the hallux and second toe. A key educational focus is the calculation of the hallux angle (HA and HA'), which serves as an indicator of hallux valgus deformity. Three anatomical landmarks are utilized for this calculation: Point A (medial calcaneus), Point B (head of the first metatarsophalangeal joint), and Point C (medial aspect of the hallux distal phalanx). The hallux angle is defined by the intersection of Line A-B and Line B-C. Visually, the shod foot demonstrates a larger hallux angle (medial deviation) and a smaller interdigital distance compared to the unshod foot, which displays a more neutral hallux alignment and wider forefoot spreading. This content is relevant for orthopedics, podiatry, and biomechanical studies of footwear influence on foot health.
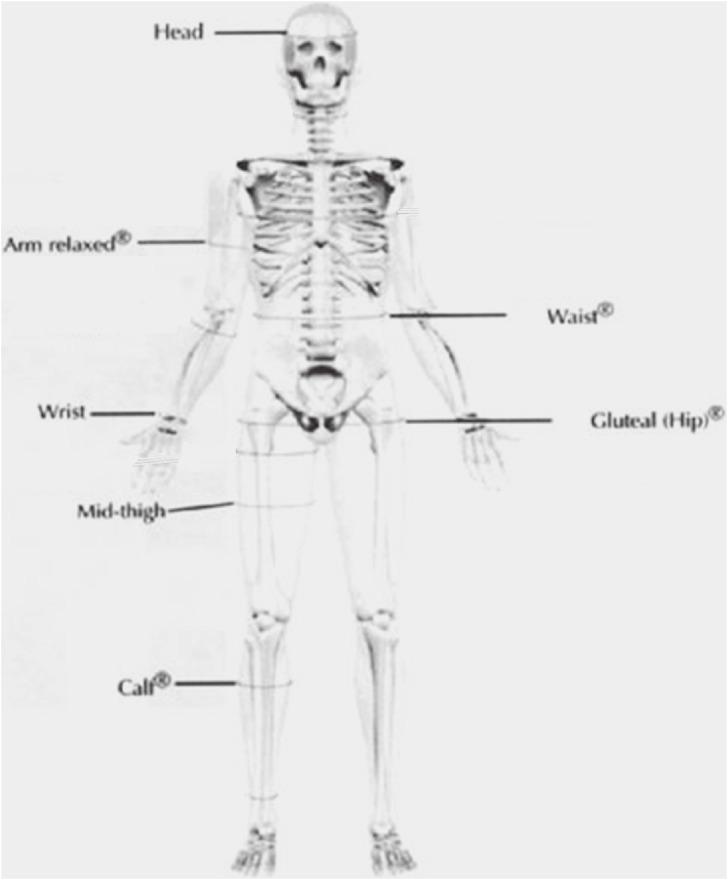
Anatomical Diagram. This illustration presents a full-body anterior skeletal view of a human, serving as an educational guide for standardized anthropometric girth measurements based on International Society for the Advancement of Kinanthropometry (ISAK) standards. The diagram identifies seven key measurement sites using horizontal lines and text labels: Head (cranial circumference), Arm relaxed (mid-upper arm), Wrist, Waist (abdominal midsection), Gluteal (hip), Mid-thigh (equidistant between the inguinal fold and superior patellar border), and Calf (maximal lower leg circumference). Following standard clinical protocol for consistency and comparative analysis, the diagram emphasizes measurement on the right side of the body, as indicated by the primary positioning of labels and lines. This resource is intended for students and professionals in sports medicine, nutrition, and clinical research to ensure high intra-observer and inter-observer reliability during physical assessment and body composition analysis.
Nutritional Status Indicators
Nutritional Status as a Health Indicator (Public Health Perspective)
- Anthropometric measurements of preschool children - weight, height, mid-arm circumference
- Heights (and sometimes weights) of children at school entry
- Prevalence of low birth weight (< 2.5 kg)
Methods of Nutritional Status Assessment
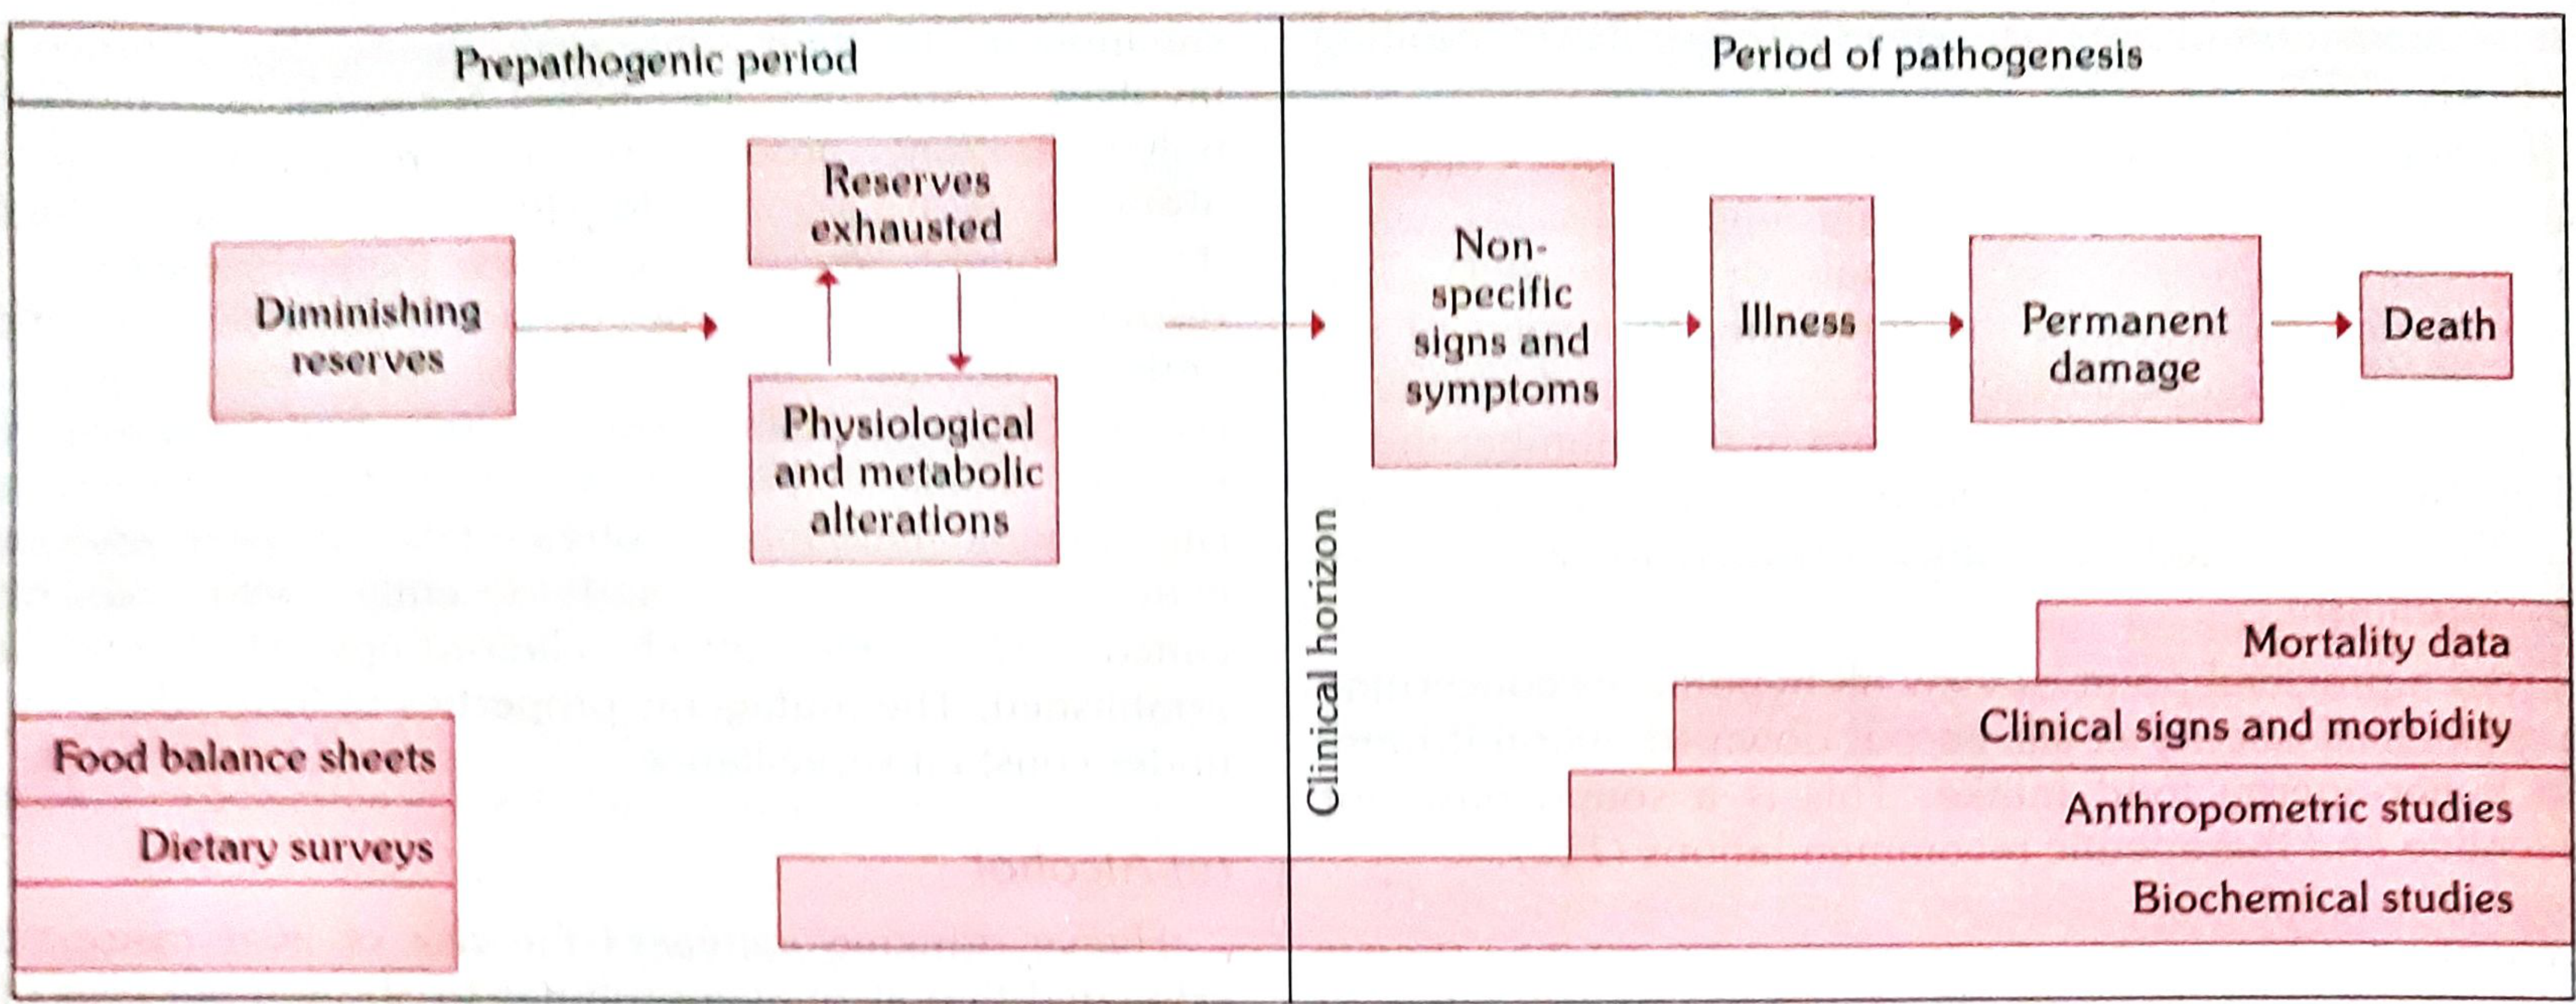
1. Clinical Examination
- The simplest and most practical method
- Looks for physical signs of malnutrition across body systems
- WHO classifies clinical signs into: signs not related to nutrition, signs needing further investigation, and signs known to be of value (e.g., angular stomatitis, Bitot's spots, calf tenderness/absent knee jerks for beri-beri, goitre for iodine deficiency)
- Limitations: cannot quantify malnutrition; many deficiencies have no physical signs; signs are often non-specific and subjective
2. Anthropometry
| Measurement | What It Indicates |
|---|---|
| Weight-for-age | Underweight (acute + chronic malnutrition) |
| Height-for-age | Stunting (chronic malnutrition) |
| Weight-for-height | Wasting (acute malnutrition) |
| BMI | Over- and undernutrition |
| Mid-Upper Arm Circumference (MUAC) | Protein-energy malnutrition, especially in children |
| Skinfold thickness (triceps, subscapular) | Body fat stores |
| Head and chest circumference | Growth and nutrition in infants |
3. Biochemical / Laboratory Evaluation
- Haemoglobin - the most important test in nutrition surveys; reflects overall nutritional state, not just anaemia
- RBC count and haematocrit
- Stool examination - for intestinal parasites (which affect nutrient absorption)
- Urine - for albumin and sugar
| Marker | Notes |
|---|---|
| Serum albumin | Half-life ~20 days; reflects chronic nutritional status; strong preoperative prognostic value |
| Prealbumin (transthyretin) | Half-life ~2 days; more sensitive for short-term/acute changes |
| Retinol-binding protein | Short half-life; sensitive acute-phase marker |
| Transferrin | Reflects protein status |
| Serum retinol | Vitamin A status |
| Serum iron / ferritin | Iron status |
| Urinary iodine | Iodine status |
| Enzyme assays | e.g., riboflavin deficiency assessed via co-factor enzymes |
Important caveat: Serum albumin and prealbumin are acute-phase reactants - levels fall with inflammation even when the patient is well nourished. A Sabiston meta-analysis found these markers stayed normal until severe malnutrition (BMI < 12 or 6 weeks of starvation). They are better used as preoperative prognostic factors than as reliable indicators of current nutrition during illness.
4. Functional Assessment
- Muscle strength (hand-grip dynamometry)
- Physical performance tests
- Mobility and functional reserve
- These are increasingly used as functional decline often precedes anthropometric changes
5. Dietary Assessment
- 24-hour dietary recall - quick, useful for highlighting major deficiencies
- Food frequency questionnaires (FFQ) - evaluates typical intake patterns
- Weighed food records (5-7 days) - most accurate but burdensome
- Food balance sheets - population-level estimates
- Evaluated against Dietary Reference Intakes (DRIs)
6. Vital and Health Statistics
- Morbidity and mortality data (especially infant and under-5 mortality)
- These reflect the downstream population-level impact of nutritional status
7. Ecological Studies
- Agricultural food production
- Household income and per capita food availability
- Food prices and accessibility
- Cultural and social eating habits
- These are indirect indicators reflecting community-level nutritional risk
Nutritional Screening Tools (Clinical Settings)
- Malnutrition Universal Screening Tool (MUST) - evaluates current condition, clinical stability, and disease contribution to malnutrition; validated for reliability
- Subjective Global Assessment (SGA) - clinician-rated tool combining history and physical exam findings
- Mini Nutritional Assessment (MNA) - widely used in elderly populations
GLIM Criteria for Malnutrition Diagnosis
- Phenotypic criteria: weight loss, low BMI, reduced muscle mass
- Etiologic criteria: reduced food intake/assimilation, inflammation/disease burden
Summary Table
| Domain | Key Indicators | Best For |
|---|---|---|
| Anthropometric | Weight, height, BMI, MUAC, skinfolds | Under/over-nutrition, growth monitoring |
| Biochemical | Hb, albumin, prealbumin, serum micronutrients | Specific deficiencies, prognostication |
| Clinical | Physical signs (Bitot's spots, oedema, etc.) | Overt/late-stage deficiency |
| Dietary | 24h recall, FFQ, food records | Identifying intake gaps |
| Functional | Grip strength, physical performance | Sarcopenia, frailty |
| Ecological/Vital stats | Food availability, infant mortality | Community/population level |
- Park's Textbook of Preventive and Social Medicine, pp. 744-748
- Sabiston Textbook of Surgery, pp. 616-617
- Tietz Textbook of Laboratory Medicine, 7th Ed., p. 1690
- Harrison's Principles of Internal Medicine 22E (2025), p. 2076