
· ECG Interpretation (Multiple Stations): · Atrial Fibrillation · Atrial Flutter · Heart Blocks (1st, 2nd, 3rd degree) · Ventricular Tachycardia · Ventricular Fibrillation · Torsades de Pointes · Bundle Branch Blocks (LBBB, RBBB) · Ventricular Hypertrophy (LVH, RVH) · WPW Syndrome · Myocardial Infarction (Inferior, Anteroseptal) · Pericarditis · Trifascicular Block , i m preparing for medical medicine TOaCS exam fcps 2 kindly give me all the ecg findings all along with the pictures and Questions regarding in a very discrete manner and precise knowledge provide samples too
Topic Map (12 OSCE/FCPS-2 ECG Stations)
- Atrial Fibrillation — irregularly irregular rhythm, absent P waves
- Atrial Flutter — sawtooth flutter waves, regular atrial rate ~300/min
- Heart Blocks (1°, 2° Mobitz I & II, 3°/complete) — PR interval and AV conduction patterns
- Ventricular Tachycardia — wide complex tachycardia, monomorphic vs polymorphic
- Ventricular Fibrillation — chaotic, no discernible complexes, pre-arrest rhythm
- Torsades de Pointes — polymorphic VT with twisting axis, prolonged QT
- Bundle Branch Blocks (LBBB, RBBB) — QRS widening, morphology in V1/V6
- Ventricular Hypertrophy (LVH, RVH) — voltage criteria, axis deviation
- WPW Syndrome — short PR, delta wave, wide QRS
- MI patterns (Inferior, Anteroseptal) — ST elevation localization, reciprocal changes
- Pericarditis — diffuse ST elevation, PR depression
- Trifascicular Block — RBBB + LAFB/LPFB + 1st degree AV block combination
Quick Orientation (high-level, not exam-depth yet)
- Rate/rhythm disturbances: AF, flutter, VT, VF, Torsades — the examiner wants you to name it fast, state 3-5 defining ECG features, and jump straight to immediate management (rate vs rhythm control, defibrillation, magnesium for Torsades).
- Conduction disease: heart blocks, BBB, trifascicular block, WPW — these test whether you can read PR/QRS intervals systematically and know which ones need urgent pacing (Mobitz II, complete heart block, trifascicular block) versus which are benign incidental findings.
- Structural/ischemic disease: LVH/RVH, MI territories, pericarditis — these test pattern recognition (voltage criteria, ST segment territory mapping) plus a differential (e.g., pericarditis vs STEMI, LVH vs RVH causes).
Which ECG station should we go deep on first?
Topic Map (12 OSCE/FCPS-2 ECG Stations)
- Atrial Fibrillation — irregularly irregular rhythm, absent P waves
- Atrial Flutter — sawtooth flutter waves, regular atrial rate ~300/min
- Heart Blocks (1°, 2° Mobitz I & II, 3°/complete) — PR interval and AV conduction patterns
- Ventricular Tachycardia — wide complex tachycardia, monomorphic vs polymorphic
- Ventricular Fibrillation — chaotic, no discernible complexes, pre-arrest rhythm
- Torsades de Pointes — polymorphic VT with twisting axis, prolonged QT
- Bundle Branch Blocks (LBBB, RBBB) — QRS widening, morphology in V1/V6
- Ventricular Hypertrophy (LVH, RVH) — voltage criteria, axis deviation
- WPW Syndrome — short PR, delta wave, wide QRS
- MI patterns (Inferior, Anteroseptal) — ST elevation localization, reciprocal changes
- Pericarditis — diffuse ST elevation, PR depression
- Trifascicular Block — RBBB + LAFB/LPFB + 1st degree AV block combination
Quick Orientation (high-level, not exam-depth yet)
- Rate/rhythm disturbances: AF, flutter, VT, VF, Torsades — the examiner wants you to name it fast, state 3-5 defining ECG features, and jump straight to immediate management (rate vs rhythm control, defibrillation, magnesium for Torsades).
- Conduction disease: heart blocks, BBB, trifascicular block, WPW — these test whether you can read PR/QRS intervals systematically and know which ones need urgent pacing (Mobitz II, complete heart block, trifascicular block) versus which are benign incidental findings.
- Structural/ischemic disease: LVH/RVH, MI territories, pericarditis — these test pattern recognition (voltage criteria, ST segment territory mapping) plus a differential (e.g., pericarditis vs STEMI, LVH vs RVH causes).
You are helping build FCPS-2 Medicine OSCE exam prep content on ECG interpretation. Cover these 6 ECG topics: (1) Atrial Fibrillation, (2) Atrial Flutter, (3) Ventricular Tachycardia, (4) Ventricular Fibrillation, (5) Torsades de Pointes, (6) WPW Syndrome. For EACH of the 6 topics, use the medical-library skill (read /skills/readonly/medical-library/SKILL.md first if not already familiar) via query_library_db (FTS search on paragraphs_fts and headings_fts) to pull authoritative textbook content, and use search_image tool to find 1 real representative ECG image for each topic (query like "atrial fibrillation ECG rhythm strip", "torsades de pointes ECG", etc). Use fetch_image only if you need to verify an image before including it (optional, use sparingly - budget is limited to 10 total fetch_image calls, 10 search_image calls, 10 query_library_db calls across the whole task). For EACH topic produce, in a clean structured format: - Definition / mechanism (1-2 sentences) - Key ECG diagnostic criteria (bulleted, precise - rate, rhythm, P waves, QRS, specific pathognomonic features) - Differential diagnosis / mimics an examiner might probe - Immediate management pearls (1-3 lines, since FCPS-2 OSCE always asks "what will you do now") - One representative image URL (from search_image) with a one-line caption - 3 sample OSCE/viva questions WITH concise model answers (the kind an FCPS-2 examiner would ask at an ECG station) - Book citation (Book Title, p. XXX) for the textbook content used Be precise and exam-focused, not generic textbook prose. Keep each topic to a tight, scannable block (not more than ~200-250 words of prose per topic, but keep all bullets/questions). Return your FULL findings for all 6 topics as your final message, in markdown, ready to be inserted into a larger document. Include all image URLs found.
You are helping build FCPS-2 Medicine OSCE exam prep content on ECG interpretation. Cover these 7 ECG topics: (1) First degree AV block, (2) Second degree AV block (Mobitz I and Mobitz II), (3) Third degree (complete) AV block, (4) Trifascicular Block, (5) Bundle Branch Blocks - LBBB and RBBB, (6) Ventricular Hypertrophy - LVH and RVH, (7) Myocardial Infarction patterns (Inferior MI and Anteroseptal MI) and Pericarditis (treat MI and Pericarditis as one combined topic since they are often compared/differentiated in exams). For EACH topic, use the medical-library skill (read /skills/readonly/medical-library/SKILL.md first if not already familiar) via query_library_db (FTS search on paragraphs_fts and headings_fts) to pull authoritative textbook content, and use search_image tool to find 1 real representative ECG image for each topic (query like "complete heart block ECG", "left bundle branch block ECG", "inferior wall MI ECG ST elevation", "pericarditis ECG PR depression", etc). Use fetch_image only if you need to verify an image before including it (optional, use sparingly - budget is limited to 10 total fetch_image calls, 10 search_image calls, 10 query_library_db calls across the whole task). For EACH topic produce, in a clean structured format: - Definition / mechanism (1-2 sentences) - Key ECG diagnostic criteria (bulleted, precise - PR interval, QRS width/morphology, axis, voltage criteria, ST/T changes, reciprocal changes, territory/coronary artery correlation as relevant) - Differential diagnosis / mimics an examiner might probe (e.g. pericarditis vs STEMI, LVH criteria vs RVH, Mobitz I vs II significance) - Immediate management pearls (1-3 lines, especially which blocks need urgent pacing: Mobitz II, complete heart block, trifascicular block; and MI reperfusion urgency) - One representative image URL (from search_image) with a one-line caption - 3 sample OSCE/viva questions WITH concise model answers (the kind an FCPS-2 examiner would ask at an ECG station) - Book citation (Book Title, p. XXX) for the textbook content used Be precise and exam-focused, not generic textbook prose. Keep each topic to a tight, scannable block (not more than ~200-250 words of prose per topic, but keep all bullets/questions). Return your FULL findings for all 7 topics as your final message, in markdown, ready to be inserted into a larger document. Include all image URLs found.
Topic Map (12 OSCE/FCPS-2 ECG Stations)
- Atrial Fibrillation — irregularly irregular rhythm, absent P waves
- Atrial Flutter — sawtooth flutter waves, regular atrial rate ~300/min
- Heart Blocks (1°, 2° Mobitz I & II, 3°/complete) — PR interval and AV conduction patterns
- Ventricular Tachycardia — wide complex tachycardia, monomorphic vs polymorphic
- Ventricular Fibrillation — chaotic, no discernible complexes, pre-arrest rhythm
- Torsades de Pointes — polymorphic VT with twisting axis, prolonged QT
- Bundle Branch Blocks (LBBB, RBBB) — QRS widening, morphology in V1/V6
- Ventricular Hypertrophy (LVH, RVH) — voltage criteria, axis deviation
- WPW Syndrome — short PR, delta wave, wide QRS
- MI patterns (Inferior, Anteroseptal) — ST elevation localization, reciprocal changes
- Pericarditis — diffuse ST elevation, PR depression
- Trifascicular Block — RBBB + LAFB/LPFB + 1st degree AV block combination
Quick Orientation (high-level, not exam-depth yet)
- Rate/rhythm disturbances: AF, flutter, VT, VF, Torsades — the examiner wants you to name it fast, state 3-5 defining ECG features, and jump straight to immediate management (rate vs rhythm control, defibrillation, magnesium for Torsades).
- Conduction disease: heart blocks, BBB, trifascicular block, WPW — these test whether you can read PR/QRS intervals systematically and know which ones need urgent pacing (Mobitz II, complete heart block, trifascicular block) versus which are benign incidental findings.
- Structural/ischemic disease: LVH/RVH, MI territories, pericarditis — these test pattern recognition (voltage criteria, ST segment territory mapping) plus a differential (e.g., pericarditis vs STEMI, LVH vs RVH causes).
Which ECG topic should I cover in full depth first?
Which ECG topic should I go deep on first?
Give me all one by one in series
atrial fibrillation ECG rhythm strip irregularly irregular
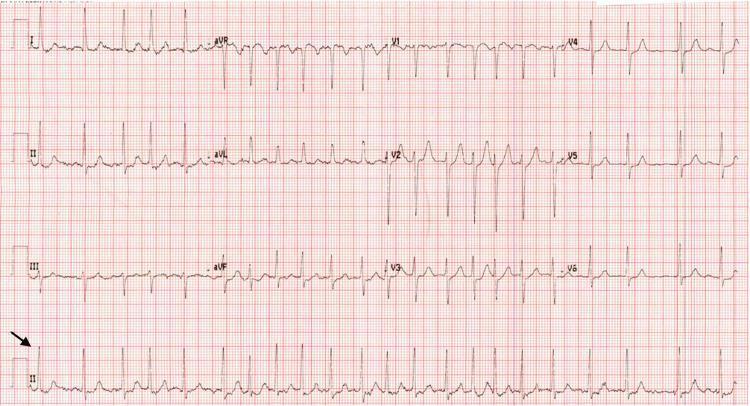
This diagnostic image is a 12-lead electrocardiogram (ECG) printed on standard grid paper, demonstrating new-onset atrial fibrillation. The ECG displays the standard limb leads (I, II, III), augmented limb leads (aVR, aVL, aVF), and precordial leads (V1-V6), with a rhythm strip for lead II at the bottom. The tracing is characterized by an irregularly irregular rhythm and the absence of discernible P waves. In their place, the baseline exhibits fine, irregular fibrillatory (f) waves, most prominently seen in lead V1 and the rhythm strip (indicated by a black arrow). The QRS complexes appear narrow and vary in their R-R intervals, a hallmark of irregular ventricular response in atrial fibrillation. Precordial leads V1 through V6 show a progression of R-wave amplitude. There is no evidence of significant ST-segment elevation or depression, suggesting an absence of acute myocardial infarction. This visual serves as a classic educational example of atrial fibrillation pathophysiology and diagnostic ECG features.
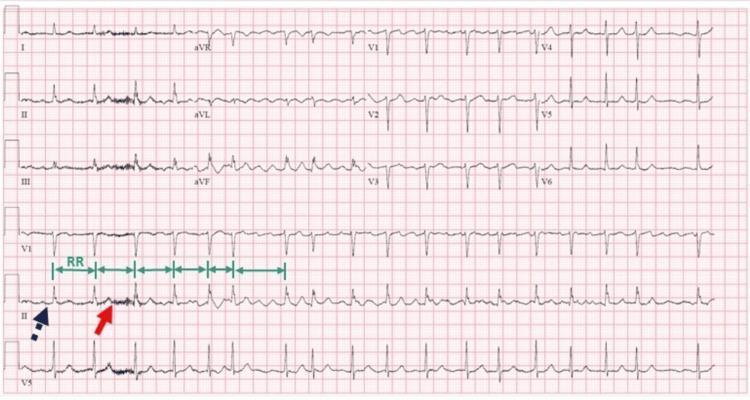
This diagnostic image is a 12-lead electrocardiogram (ECG) printed on standard grid paper, demonstrating classic features of atrial fibrillation. The tracing shows a rhythm characterized by 'irregularly irregular' R-R intervals, which are explicitly marked with green bidirectional arrows in the rhythm strip to highlight the variability in heart rate. A defining feature of this ECG is the complete absence of organized P waves preceding the QRS complexes. Instead, the baseline exhibits fibrillatory waves—small, rapid, and irregular oscillations—most clearly visible in the rhythm strip of Lead II (indicated by a solid red arrow) and Lead V1. The purple dashed arrow highlights the flat or undulating baseline where a P wave would normally be expected in sinus rhythm. The QRS complexes appear narrow, suggesting normal ventricular conduction despite the supraventricular arrhythmia. This visual material is a primary educational resource for cardiology and internal medicine, illustrating the fundamental diagnostic criteria for atrial fibrillation.
atrial flutter ECG sawtooth flutter waves
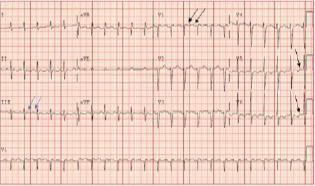
This diagnostic image is a 12-lead electrocardiogram (ECG) demonstrating a narrow-complex tachycardia, specifically identified as atypical atrial flutter. The tracing exhibits a 2:1 conduction ratio, where two P waves are visible for every QRS complex. A key diagnostic feature is the presence of upright flutter waves in the inferior leads (II, III, aVF), annotated with blue arrows, suggesting high-to-low atrial activation. In the precordial leads (V1-V6), the flutter waves remain positive across the entire sequence (noted by black arrows), demonstrating an 'absent precordial transition' that is characteristic of a left atrial origin rather than typical cavotricuspid isthmus (CTI)-dependent right atrial flutter. The ECG lacks the classic 'sawtooth' undulating morphology, instead showing discrete flutter waves. These findings are clinically significant in the context of post-ablation arrhythmias and tachycardia-mediated cardiomyopathy, helping to differentiate between focal atrial tachycardia and macroreentrant circuits originating in the left atrium.
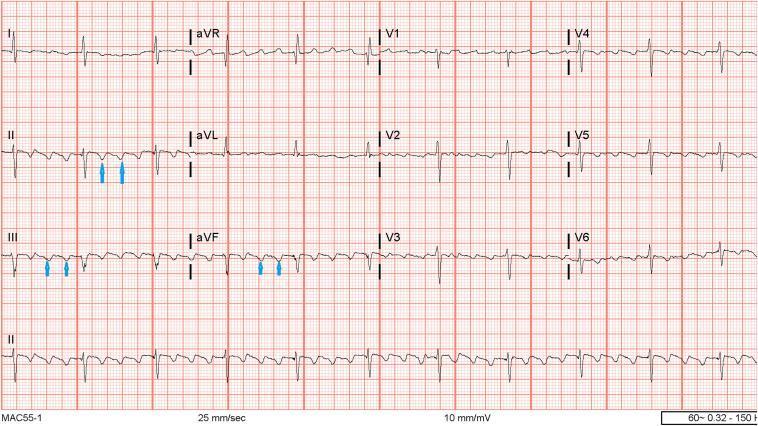
A standard 12-lead electrocardiogram (ECG) displayed on a traditional grid background (25 mm/sec, 10 mm/mV). The tracing demonstrates typical Atrial Flutter (AFL). The most prominent feature is the continuous 'sawtooth' baseline pattern, consisting of rapid, regular flutter waves (F waves). These F waves are most clearly visualized in the inferior leads (II, III, and aVF), where they exhibit a predominantly negative deflection. Blue arrows in leads II, III, and aVF highlight these recurring macro-reentrant atrial oscillations. The ventricular rhythm is regular, suggesting a fixed atrioventricular (AV) conduction ratio, likely 2:1 or 4:1 given the flutter rate. Normal QRS complexes and T waves are present across all leads but are superimposed upon the undulating flutter baseline. Precordial leads (V1-V6) show small, upright flutter waves in V1, typical for counterclockwise cavotricuspid isthmus-dependent atrial flutter. This diagnostic image serves as a classic educational example for identifying supraventricular tachyarrhythmias and understanding the morphology of counterclockwise atrial flutter.
complete heart block third degree AV block ECG AV dissociation
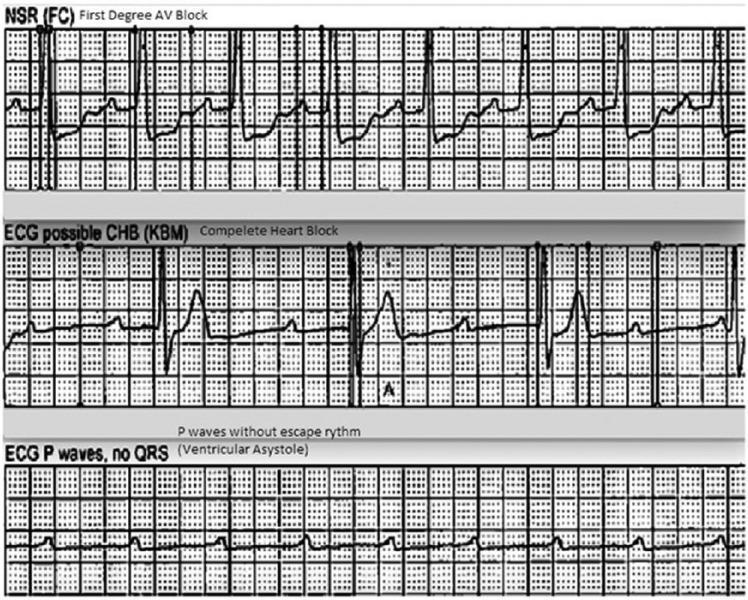
This diagnostic image displays a vertical comparison of three ECG rhythm strips demonstrating the progression and characteristics of different cardiac conduction abnormalities. The top strip, labeled 'NSR (FC) First Degree AV Block,' shows a sinus rhythm with a prolonged PR interval, indicating a delay in conduction between the atria and ventricles. The middle strip, labeled 'ECG possible CHB (KBM) Complete Heart Block,' illustrates third-degree atrioventricular (AV) block characterized by complete AV dissociation; P waves are present but occur independently of the slow, irregular QRS complexes (escape rhythm). The bottom strip, labeled 'ECG P waves, no QRS (Ventricular Asystole),' depicts a high-grade block where atrial activity (P waves) continues, but there is a total failure of ventricular conduction resulting in ventricular asystole. This sequence serves as an educational tool for identifying varying severity levels of heart blocks and the transition from conduction delay to lethal ventricular standstill.
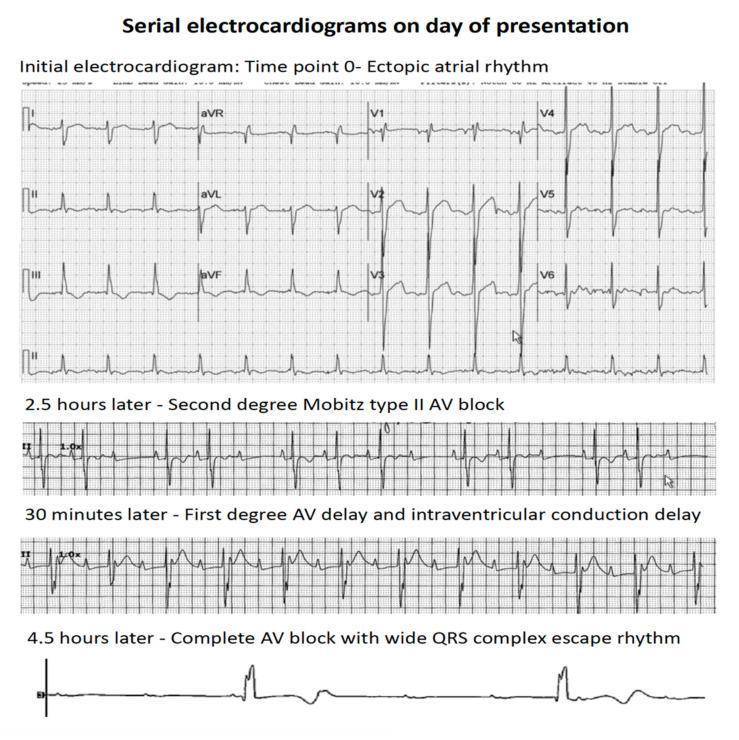
This diagnostic image consists of a series of four electrocardiogram (ECG) rhythm strips demonstrating the rapid clinical progression of atrioventricular (AV) conduction abnormalities over a period of 4.5 hours. The top panel, labeled 'Time point 0', shows an ectopic atrial rhythm with organized P-wave activity and narrow QRS complexes. The second strip, recorded 2.5 hours later, displays a second-degree Mobitz type II AV block, characterized by intermittently dropped QRS complexes without preceding PR interval lengthening. The third strip, 30 minutes later, indicates a first-degree AV delay (prolonged PR interval) and intraventricular conduction delay (widened QRS). The final rhythm strip at 4.5 hours shows third-degree (complete) AV block, characterized by complete AV dissociation and a slow, wide QRS complex ventricular escape rhythm. This progression illustrates acute cardiac conduction system failure, typically associated with myocardial infiltration or severe injury, as seen in patients with leukemic infiltration of the heart.
ventricular tachycardia ECG wide complex monomorphic
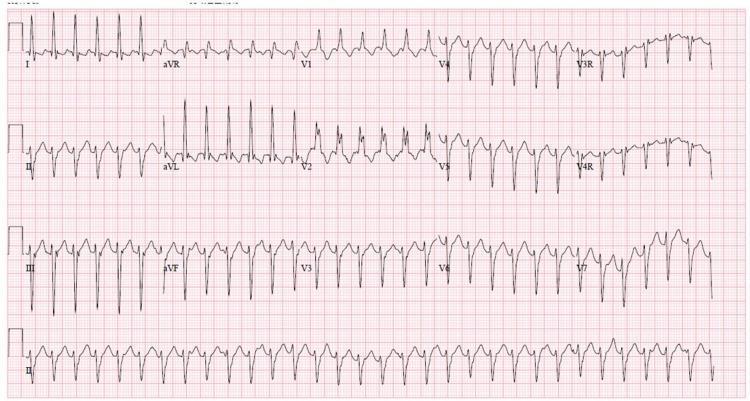
A 12-lead electrocardiogram (ECG) demonstrating a regular wide complex tachycardia (WCT). The rhythm is characterized by a rapid ventricular rate and broad QRS complexes, indicating delayed ventricular depolarization. Key morphological findings include a Right Bundle Branch Block (RBBB) pattern, notably visible as an RSR' or notched morphology in the right precordial leads (V1, V2). There is significant left axis deviation (LAD), with predominantly negative QRS complexes in the inferior leads (II, III, and aVF) and positive complexes in leads I and aVL. This combination of RBBB morphology and left axis deviation in the context of wide complex tachycardia is a classic presentation of idiopathic left ventricular tachycardia, also known as Belhassen tachycardia or verapamil-sensitive fascicular ventricular tachycardia. The rhythm appears monomorphic, and the baseline shows no clearly identifiable P waves, suggesting atrioventricular dissociation or retrograde conduction common in ventricular arrhythmias.
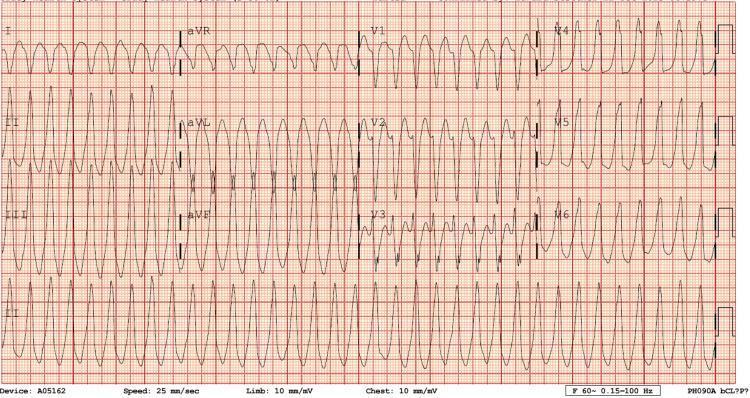
This diagnostic image is a 12-lead electrocardiogram (ECG) demonstrating a regular, monomorphic wide-complex tachycardia (WCT). The ventricular rate is approximately 250 beats per minute, characterized by widened QRS complexes that maintain a consistent morphology across each lead. P waves are not clearly discernible, and there is no obvious evidence of atrioventricular (AV) dissociation on this tracing, making it visually challenging to differentiate between ventricular tachycardia (VT) and supraventricular tachycardia (SVT) with aberrant conduction. Notably, the limb leads aVR and aVL exhibit signs of potential lead reversal, complicating axis determination. The rhythm is monomorphic, suggesting a uniform ventricular depolarization pathway. This ECG is a critical educational example used to illustrate the emergency department presentation of tachyarrhythmias, often requiring clinical correlation and potentially electrical cardioversion. It serves as a teaching tool for advanced cardiac life support (ACLS) and cardiology-level interpretation of life-threatening arrhythmias.
ventricular fibrillation ECG chaotic irregular
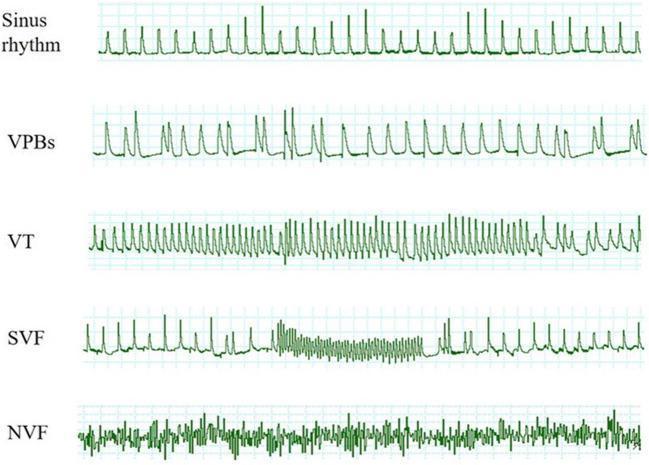
This diagnostic image displays a vertical sequence of five electrocardiogram (ECG) tracings illustrating the progression of ischemia/reperfusion-induced ventricular arrhythmias. 1. Sinus Rhythm: Shows a baseline regular rhythm with identifiable QRS complexes and T waves. 2. VPBs (Ventricular Premature Beats): Demonstrates intermittent, wide, and premature QRS complexes disrupting the regular sinus cadence. 3. VT (Ventricular Tachycardia): A rapid, monomorphic sequence of wide QRS complexes with no visible P waves, indicating a sustained tachyarrhythmia. 4. SVF (Spontaneous Ventricular Fibrillation): A chaotic, high-frequency oscillatory pattern that spontaneously terminates, transitioning back into a more organized, regular ventricular rhythm. 5. NVF (Non-terminated Ventricular Fibrillation): A continuous, irregular, and low-amplitude chaotic baseline with no discernible organized electrical activity or termination within the observation period. This comparison is used to study the severity and duration of malignant arrhythmias in clinical and experimental cardiology settings.
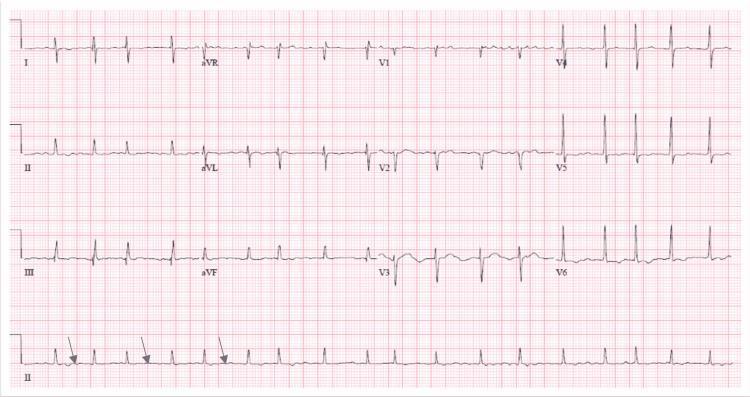
This diagnostic image is a 12-lead electrocardiogram (ECG) mounted on a standard grid, displaying leads I, II, III, aVR, aVL, aVF, and V1-V6. The tracing demonstrates an irregularly irregular rhythm characteristic of atrial fibrillation. Key diagnostic features include the absence of distinct P waves, which are replaced by low-amplitude, chaotic fibrillary (f) waves, highlighted by blue arrows in the rhythm strip (lead II at the bottom). The QRS complexes are narrow and occur at varying intervals, indicating an inconsistent ventricular response. The ventricular rate is approximately 108 beats per minute, consistent with a rapid ventricular rate (RVR). There are no significant ST-segment or T-wave abnormalities visible; however, a right axis deviation is present. This ECG serves as an educational example for identifying supraventricular tachyarrhythmias and chaotic atrial electrical activity in a clinical setting.
torsades de pointes ECG polymorphic ventricular tachycardia
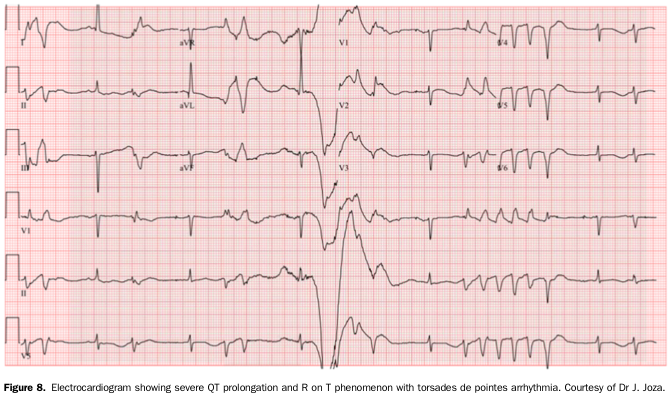
Summary : This figure presents a 12-lead electrocardiogram (ECG) demonstrating severe QT interval prolongation, the R on T phenomenon, and the onset of torsades de pointes arrhythmia.
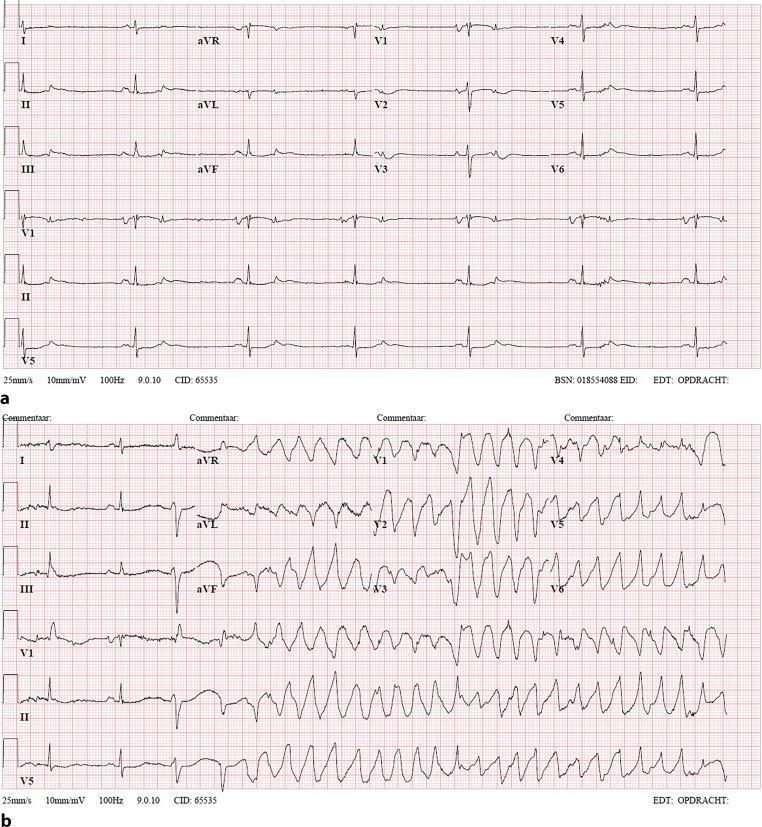
Two-part 12-lead electrocardiogram (ECG) comparison demonstrating drug-induced arrhythmia. (a) Initial ECG showing sinus bradycardia at approximately 40 bpm. Findings include narrow QRS complexes, prolonged QT interval, and T-wave abnormalities (inversions in inferior leads II, III, and aVF). This baseline demonstrates common findings in patients on QT-prolonging agents like sotalol. (b) ECG recorded during a syncopal event, displaying a transition from sinus rhythm into a polymorphic ventricular tachycardia (Torsades de Pointes). The tachycardia is characterized by wide QRS complexes (duration >120ms) with a shifting axis, rotating around the isoelectric line at a rapid rate of 150-200 bpm. The visual sequence illustrates the clinical progression from drug-induced QT prolongation to life-threatening ventricular arrhythmia. Educational focus is on identifying bradycardia, QT prolongation, and the morphology of polymorphic ventricular tachycardia in the context of syncope.
left bundle branch block ECG V1 V6 morphology
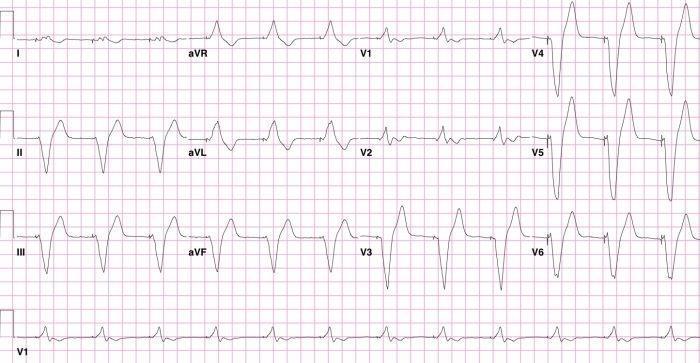
A 12-lead electrocardiogram (ECG) demonstrating a ventricular paced rhythm with a Right Bundle Branch Block (RBBB) morphology, indicative of inadvertent endocardial left ventricular (LV) lead placement. Visible pacing spikes precede each wide QRS complex. The QRS morphology in the precordial leads shows a transition from predominantly negative complexes in V1-V2 to tall, positive R-waves in leads V4-V6. Specifically, V1 displays a broad, slurred complex with terminal positivity, while V4-V6 exhibit prominent R-waves followed by minor secondary deflections. Secondary ST-T wave changes are present, including T-wave inversion in V1-V2 and upright T-waves in V4-V6 and the inferior leads (II, III, aVF). Minor ST-segment depression is noted in the lateral leads (V5-V6). This educational visual highlights the clinical significance of paced RBBB patterns in diagnosing lead malposition via an atrial septal defect into the left ventricle, which contrasts with the expected Left Bundle Branch Block (LBBB) pattern typically seen with right ventricular pacing.
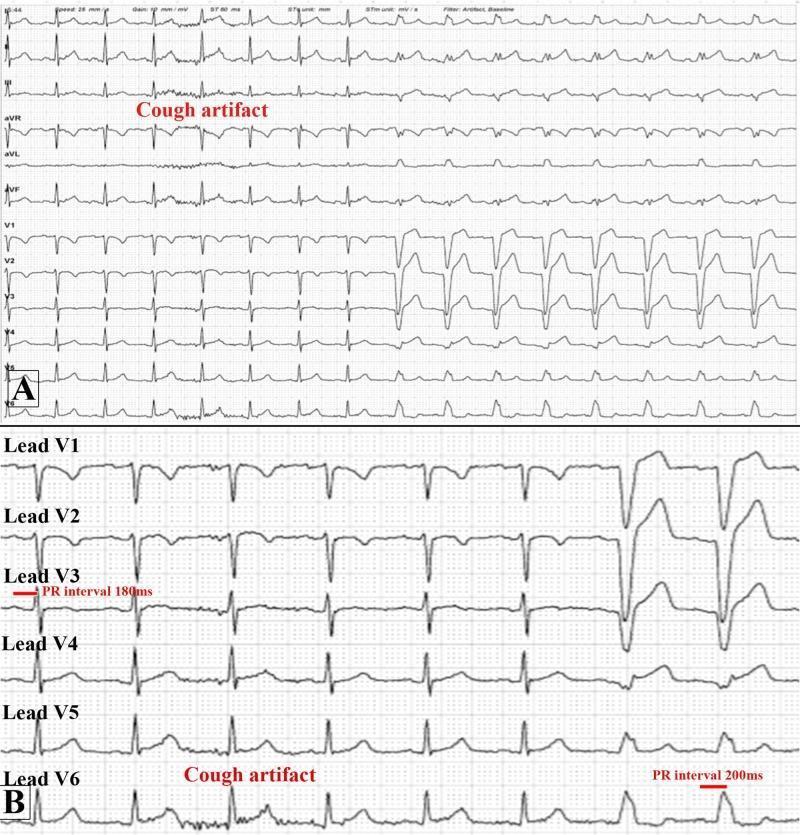
This diagnostic image is a 12-lead electrocardiogram (ECG) demonstrating the phenomenon of phase 4 (bradycardia-dependent) left bundle branch block (LBBB) triggered by a cough. Panel A shows a standard 12-lead tracing (I, II, III, aVR, aVL, aVF, V1-V6). A 'cough artifact' is annotated in the rhythm strip, immediately followed by a transition from narrow QRS complexes to wide QRS complexes with a LBBB morphology. Panel B provides a zoomed-in view of the precordial leads V1-V6, highlighting the specific conduction changes. It documents an increase in the PR interval from 180 milliseconds (associated with narrow QRS complexes) to 200 milliseconds (associated with wide QRS complexes) following the cough. The morphology transition is most evident in leads V1 and V2 (deep S-waves) and lead V6 (monophasic R-wave). This tracing illustrates an uncommon mechanism where a physiological maneuver (coughing) alters cardiac conduction timing, leading to a rate- or pause-dependent bundle branch block during a myocardial perfusion stress test protocol.
right bundle branch block ECG RSR V1
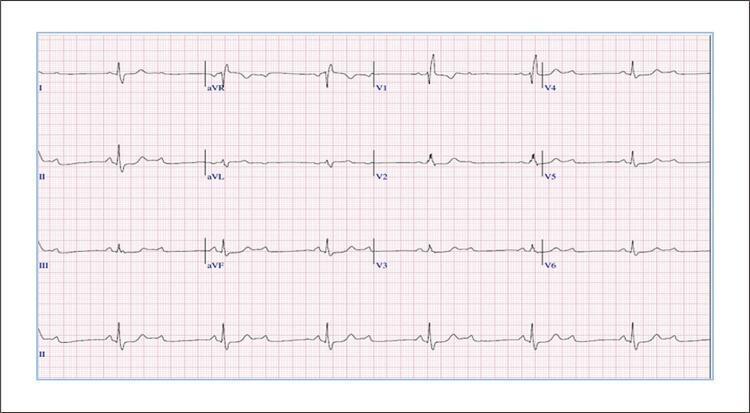
This diagnostic image is a 12-lead electrocardiogram (ECG) with a rhythm strip (Lead II) illustrating complex cardiac conduction disturbances. The primary finding is a Second-Degree Atrioventricular (AV) Block with a 2:1 conduction ratio, characterized by regular P waves occurring at approximately double the frequency of the QRS complexes, where every second P wave fails to conduct to the ventricles. The conducted QRS complexes demonstrate a Right Bundle Branch Block (RBBB) morphology, most prominent in lead V1, which shows an rsR' pattern and wide, slurred S waves in leads I and V6. The ST-segment and T-waves show secondary repolarization changes consistent with the intraventricular conduction delay, including T-wave inversions in the right precordial leads (V1-V3). This ECG is an educational example of exercise-related or recovery-phase conduction system disease, demonstrating the coexistence of AV nodal or infra-nodal block and bundle branch block, which carries clinical significance for potential progression to complete heart block.
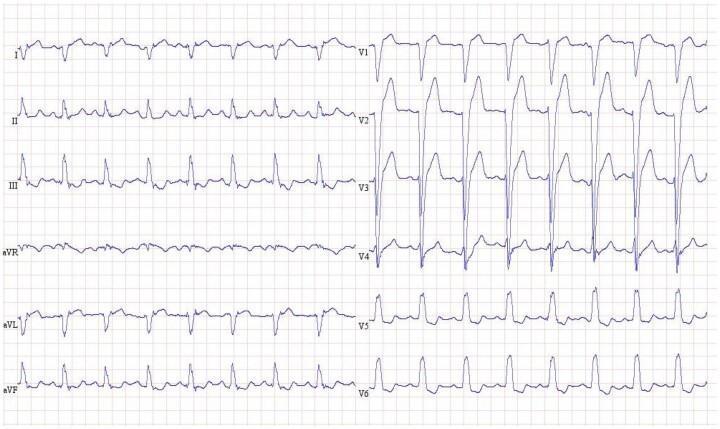
This diagnostic image is a 12-lead electrocardiogram (ECG) demonstrating a sinus rhythm with features characteristic of a Right Bundle Branch Block (RBBB). The ECG shows regular P waves preceding each QRS complex, indicating a sinus origin. The key diagnostic finding is the marked widening of the QRS complex (>120 ms). In the precordial leads V1 through V3, there are prominent, broad, and notched monophasic R waves (Rsr' pattern), which are classic indicators of delayed right ventricular depolarization. Leads V5 and V6 demonstrate slurred S waves. Secondary repolarization abnormalities, including T-wave inversion and ST-segment depression, are visible in the right precordial leads (V1-V3), which are common discordant changes in the setting of a bundle branch block. This tracing is an educational example of intraventricular conduction delay used to teach cardiac electrophysiology and the interpretation of morphological changes in ventricular depolarization.
Wolff Parkinson White syndrome ECG delta wave short PR
This diagnostic image is a 12-lead electrocardiogram (ECG) demonstrating ventricular preexcitation characteristic of Wolff-Parkinson-White (WPW) syndrome. The tracing shows a short PR interval and prominent delta waves at the onset of the QRS complexes. Specifically, positive delta waves are visible in the precordial leads (V1 through V6), resulting in a dominant R-wave pattern in V1, which suggests an accessory pathway (AP) located on the left side of the heart. In the inferior leads (II, III, and aVF), the delta waves are negative (downward deflections), resembling pathological Q waves; this 'pseudoinfarction' pattern indicates the vector of initial ventricular activation is moving away from the inferior wall, highly suggestive of a left posteroseptal accessory pathway. The highest negative delta wave amplitudes are seen in leads II and III. This ECG is a classic educational example for identifying and localizing bypass tracts based on delta wave polarity and QRS morphology in patients with symptomatic or asymptomatic preexcitation.
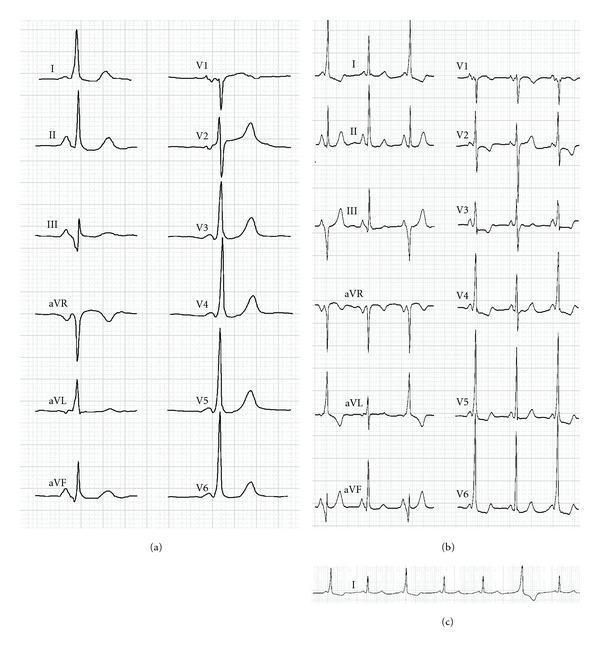
This composite diagnostic image displays surface electrocardiograms (ECGs) from a patient with ventricular pre-excitation. Panel (a) shows a standard 12-lead ECG characterized by a shortened PR interval, the presence of a delta wave (slurring of the initial QRS upstroke), and widened QRS complexes, which are classic signs of Wolff-Parkinson-White (WPW) syndrome pattern. Panel (b) presents another 12-lead strip showing beat-to-beat variability: the first and third beats exhibit pre-excitation (short PR, delta wave, wide QRS), while the second beat displays a normal PR interval and narrow QRS morphology. Panel (c) provides a continuous Lead I rhythm strip illustrating this electrical alternation (alternance), where pre-excited beats alternate with normally conducted beats. The ECG findings are essential for identifying accessory pathway conduction and evaluating the results of catheter ablation procedures. Clinically, the alternation in Panel (b) and (c) can represent intermittent pre-excitation or fusion beats between normal atrioventricular conduction and an ectopic ventricular rhythm arising near a previous ablation site.
inferior wall myocardial infarction ECG ST elevation leads II III aVF
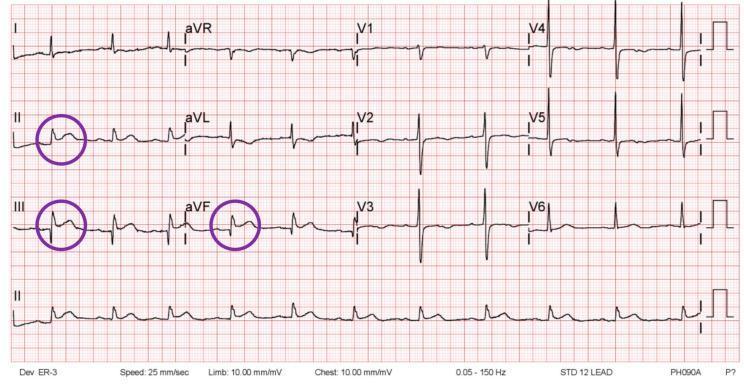
This diagnostic image is a standard 12-lead electrocardiogram (ECG) tracing on a red grid background, illustrating an acute inferior wall ST-elevation myocardial infarction (STEMI). The tracing displays the six limb leads (I, II, III, aVR, aVL, aVF) and the six precordial leads (V1-V6), with a continuous rhythm strip of lead II at the bottom. Purple circles highlight significant ST-segment elevation at the J-point in the inferior leads: II, III, and aVF. The ST elevation is approximately 1 mm or greater with a convex or upward-sloping morphology. Reciprocal ST-segment depression is visible in the high lateral leads (I and aVL), which is a classic finding in inferior STEMI. The precordial leads (V1-V6) show a normal R-wave progression without acute ST-segment changes. This ECG is a key educational tool for cardiovascular medicine, specifically for diagnosing acute coronary syndromes and identifying regional wall ischemia or infarction patterns.
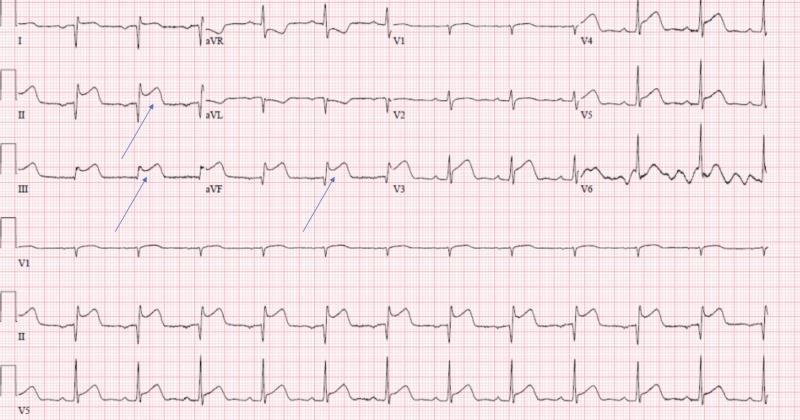
This diagnostic image is a 12-lead electrocardiogram (ECG) printed on standard red-grid paper, demonstrating findings consistent with an acute inferior wall ST-segment elevation myocardial infarction (STEMI). Significant ST-segment elevation is clearly visible in the inferior leads (II, III, and aVF), with the elevation in lead III being particularly prominent and exhibiting a convex-upward morphology. Reciprocal ST-segment depression is noted in the high lateral leads (I and aVL). Blue arrows in leads II, III, and aVF highlight the pathognomonic ST-segment displacement. The ECG also includes precordial leads V1-V6 and a rhythm strip at the bottom showing leads V1, II, and V5. Key educational features include the visualization of injury patterns in an anatomical vascular distribution (right coronary artery or left circumflex), making it an essential resource for students learning to identify acute coronary syndromes and distinguish between inferior and lateral wall changes.
ECG OSCE Stations — FCPS-2 Medicine Series (All 12, One by One)
STATION 1: ATRIAL FIBRILLATION (AF)
- Irregularly irregular R-R intervals
- Absent discrete P waves - replaced by fibrillatory (f) waves, best seen in V1 and lead II
- Narrow QRS (unless pre-existing BBB or WPW)
- Ventricular rate variable (controlled 60-100, RVR >100)
- "What is the single most important thing you'd assess before deciding rate vs rhythm control?" → Hemodynamic stability first; then duration of AF (>48h or unknown = need anticoagulation/TEE before cardioversion due to clot risk).
- "How do you calculate stroke risk in this patient?" → CHA2DS2-VASc score (CHF, HTN, Age≥75(2), DM, prior Stroke/TIA(2), Vascular disease, Age65-74, Sex female).
- "Patient in AF with rate 160 and BP 80/50 - next step?" → Immediate synchronized electrical cardioversion, don't wait for anticoagulation workup in unstable patient.
STATION 2: ATRIAL FLUTTER
- Regular sawtooth flutter (F) waves, atrial rate ~300/min
- Classic typical flutter: negative F waves in II, III, aVF; positive in V1
- Fixed or variable AV conduction ratio (commonly 2:1, giving ventricular rate ~150 - a classic exam trap)
- Regular ventricular rhythm if fixed ratio
- "Ventricular rate is exactly 150 - what should you suspect?" → Atrial flutter with 2:1 block until proven otherwise.
- "How would you unmask flutter waves hidden in QRS/T?" → Give IV adenosine or carotid sinus massage to transiently increase AV block and reveal flutter waves.
- "Definitive curative treatment?" → Catheter ablation of the cavotricuspid isthmus.
STATION 3: HEART BLOCKS (1st, 2nd Mobitz I/II, 3rd Degree)
- "How do you differentiate Mobitz I from Mobitz II on the strip?" → Mobitz I: progressively lengthening PR before the dropped beat. Mobitz II: constant PR interval on conducted beats, then an abrupt dropped QRS.
- "Which of the second-degree blocks needs a pacemaker?" → Mobitz II (and any high-grade/2:1 block where site is uncertain) - it is unstable and prone to sudden progression to complete heart block.
- "Complete heart block patient is asymptomatic - do you still treat?" → Yes, permanent pacemaker is indicated in third-degree AV block regardless of symptoms.
STATION 4: VENTRICULAR TACHYCARDIA (VT)
- Wide QRS (>120ms), rate typically 150-250/min
- Monomorphic (consistent morphology) vs polymorphic
- AV dissociation, capture beats, fusion beats support VT over SVT with aberrancy
- Concordance of QRS across precordial leads (all positive or all negative) strongly favors VT
- "Wide complex tachycardia, patient is talking to you comfortably - is it safe to assume SVT?" → No. Always assume VT in a wide complex tachycardia until proven otherwise, regardless of hemodynamic tolerance.
- "Name 2 ECG features that favor VT over SVT with aberrancy." → AV dissociation / capture-fusion beats, and precordial QRS concordance.
- "Patient in VT with BP 70/40 - immediate step?" → Synchronized cardioversion (or defibrillation if pulseless/polymorphic without clear R wave to sync).
STATION 5: VENTRICULAR FIBRILLATION (VF)
- No identifiable P, QRS, or T waves
- Irregular, chaotic undulating baseline of varying amplitude/frequency
- Coarse VF (higher amplitude, better prognosis with defibrillation) vs fine VF (low amplitude, may be mistaken for asystole)
- "Monitor shows a chaotic rhythm with no discernible complexes - first action?" → Confirm no pulse/unresponsive, then immediate defibrillation + start CPR.
- "Difference in management of shockable vs non-shockable arrest rhythms?" → Shockable (VF/pulseless VT) → defibrillate ASAP + CPR + epinephrine every 3-5 min; non-shockable (asystole/PEA) → CPR + epinephrine only, no shock.
- "How do you differentiate fine VF from asystole?" → Check rhythm in a second lead and increase the gain; true asystole is a flat line in all leads.
STATION 6: TORSADES DE POINTES
- Baseline QT prolongation before the event (QTc >500ms is high risk)
- Polymorphic VT with progressively changing QRS amplitude/axis, "twisting" appearance
- Often preceded by a long pause followed by a PVC landing on the T wave ("R on T" phenomenon)
- Self-terminating episodes may cause recurrent syncope; sustained episodes can degenerate to VF
- "What is the first-line drug for Torsades, and why give it even if labs are normal?" → IV magnesium sulfate - it stabilizes membrane potential and suppresses triggered activity independent of serum Mg level.
- "Patient on methadone develops Torsades - what do you do?" → Stop the QT-prolonging drug, give IV magnesium, correct electrolytes, consider overdrive pacing if recurrent/bradycardia-dependent.
- "Why should you avoid amiodarone/procainamide in Torsades?" → They are QT-prolonging antiarrhythmics and can worsen the arrhythmia.
STATION 7: WOLFF-PARKINSON-WHITE (WPW) SYNDROME
- Short PR interval (<120ms)
- Delta wave - slurred upstroke at the start of the QRS
- Widened QRS (>110ms) from fusion of normal and accessory pathway conduction
- Can produce a "pseudo-infarct" pattern (negative delta waves mimicking Q waves) depending on pathway location
- "Name the 3 classic ECG features of WPW." → Short PR interval, delta wave, widened QRS.
- "Patient with known WPW develops AF with a very fast irregular wide-complex rhythm - which drugs must you avoid?" → Adenosine, beta-blockers, calcium channel blockers, digoxin - all can accelerate accessory pathway conduction and precipitate VF.
- "Definitive treatment for symptomatic WPW?" → Catheter ablation of the accessory pathway.
STATION 8: BUNDLE BRANCH BLOCKS (LBBB & RBBB)
- QRS >120ms
- RSR' ("rabbit ears") pattern in V1
- Wide slurred S wave in leads I and V6
- Secondary T-wave inversion in V1-V3
- QRS >120ms
- Broad, notched/monophasic R wave in V6 and lead I
- Deep, broad S wave (or QS) in V1
- Absence of normal septal Q waves in lateral leads
- Discordant ST-T changes (opposite direction to QRS) - normal in LBBB, NOT a sign of ischemia by itself
- "How do you remember RBBB vs LBBB morphology in V1?" → "WiLLiaM MoRRoW": W pattern in V1 and M in V6 for LBBB; M (rSR') in V1 and W in V6 for RBBB.
- "A patient with chest pain has a new LBBB on ECG - what do you do?" → Treat as STEMI-equivalent - activate cath lab / reperfusion pathway per protocol; get urgent echo.
- "Is ST discordance in LBBB always abnormal?" → No - discordant ST-T changes are expected/normal in LBBB; use Sgarbossa criteria to judge if superimposed ischemia is present.
STATION 9: VENTRICULAR HYPERTROPHY (LVH & RVH)
- Sokolow-Lyon: S in V1 + R in V5 or V6 ≥35mm
- Cornell criteria: R in aVL + S in V3 >28mm (men) / >20mm (women)
- Associated: left axis deviation, ST depression/T inversion in lateral leads ("strain pattern")
- Right axis deviation
- Dominant R wave in V1 (R>S)
- Deep S waves in V5-V6
- Associated with right atrial enlargement (peaked P in II - "P pulmonale")
- "Give one voltage criterion each for LVH and RVH." → LVH: S(V1)+R(V5/V6) ≥35mm (Sokolow-Lyon). RVH: dominant R wave in V1 with right axis deviation.
- "Patient has LVH on ECG with strain pattern - what does 'strain' mean and what does it suggest?" → ST depression and T-wave inversion in the lateral leads, reflecting more advanced hypertrophy/increased myocardial wall stress.
- "A 25-year-old with RVH on ECG and a known VSD - what syndrome would you suspect if there's also pulmonary stenosis and RV outflow obstruction?" → Tetralogy of Fallot.
STATION 10: MYOCARDIAL INFARCTION - INFERIOR & ANTEROSEPTAL
- ST elevation in II, III, aVF
- Reciprocal ST depression in I and aVL
- Lead III elevation > Lead II elevation suggests RCA culprit (vs LCx)
- Always check V4R for right ventricular involvement, and posterior leads (V7-V9) for co-existing posterior MI - RV infarct patients are preload-dependent, avoid nitrates/diuretics
- ST elevation in V1-V3 (septal + anterior)
- Loss of normal R wave progression / poor R waves in V1-V3
- Often the most extensive infarcts given LAD supplies a large myocardial territory - higher risk of complications (heart block if septal branches involved, since AV node blood supply variably from RCA/LAD septals)
- "Inferior MI patient becomes hypotensive after you give sublingual nitrate - why, and what should you have checked first?" → Likely concurrent RV infarction (preload dependent) - should have checked V4R for ST elevation before giving nitrates.
- "How do you tell if the culprit vessel in inferior MI is RCA vs LCx?" → Lead III ST elevation greater than lead II, plus ST depression in lead I, favors RCA; if elevation in II ≥ III, consider LCx.
- "Anteroseptal STEMI patient develops a new complete heart block - why?" → Septal perforator branches of the LAD supply part of the AV conduction system, so extensive anteroseptal infarction can damage the conduction system, unlike inferior MI (usually causes transient AV nodal block that often resolves).
STATION 11: PERICARDITIS
- Diffuse concave ("saddle-shaped") ST elevation across multiple leads not confined to one territory
- PR segment depression (especially in lead II and aVL/V6) - highly specific finding
- Reciprocal PR elevation and ST depression in aVR
- No reciprocal ST depression elsewhere (unlike STEMI) and no pathological Q waves
- "What ECG finding best distinguishes pericarditis from STEMI?" → PR segment depression with diffuse, concave, non-territorial ST elevation (versus convex, localized ST elevation with reciprocal changes in STEMI).
- "What clinical exam finding supports pericarditis over ACS?" → Pericardial friction rub, pain relieved by leaning forward/worsened lying flat, pleuritic quality.
- "First-line pharmacologic treatment?" → NSAID (or aspirin) plus colchicine to reduce recurrence risk.
STATION 12: TRIFASCICULAR BLOCK
- RBBB pattern (RSR' in V1) PLUS
- Left axis deviation (left anterior fascicular block) or right axis deviation (left posterior fascicular block) PLUS
- First-degree AV block (prolonged PR) or evidence of intermittent higher-grade AV block
- Essentially: bifascicular block (RBBB + LAFB/LPFB) + PR prolongation reflecting delay in the remaining fascicle
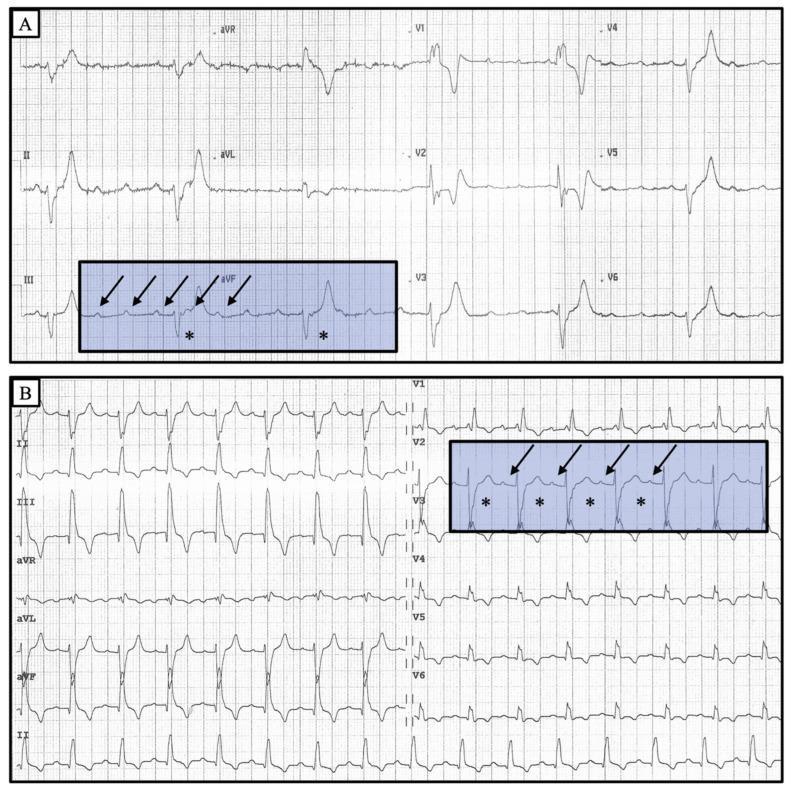
- "What 3 ECG components make up trifascicular block?" → RBBB + left axis deviation (LAFB, or right axis deviation for LPFB) + first-degree AV block (or evidence of higher AV block).
- "Asymptomatic patient found to have trifascicular block on routine ECG - what next?" → Further evaluate for higher-grade block (ambulatory ECG monitoring); pacemaker decision often based on symptoms and documented advanced block, per current guideline recommendations.
- "Why is trifascicular block higher risk than simple bifascicular block?" → It indicates disease in the entire remaining conduction reserve, with a much higher risk of unpredictable progression to complete heart block.