
/generatehandwrittenimages Discuss the physiological issues affecting transgenders, gender non conforming and non-binary individuals for md physiology 10 marks theory question. You can make many images and not just one for completing the answer
transgender physiology endocrine health
transgender gender nonconforming physiological issues MD physiology endocrine cardiovascular bone mental health
hypothalamic pituitary gonadal axis diagram
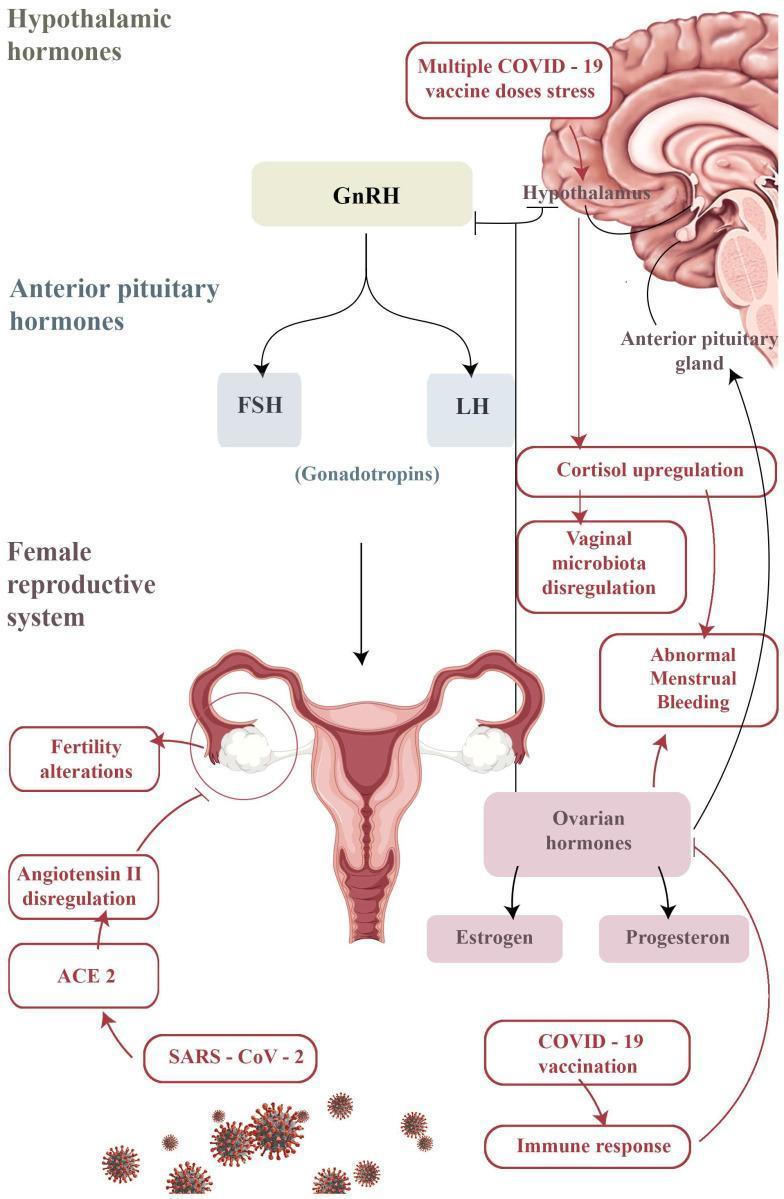
A pathophysiology diagram illustrating the hypothalamic-pituitary-gonadal (HPG) axis and potential mechanisms for gynecological changes following COVID-19 vaccination or infection. The central axis shows the Hypothalamus releasing GnRH, which stimulates the Anterior Pituitary Gland to release the gonadotropins FSH and LH, acting upon the female reproductive system (uterus and ovaries). A secondary pathway details the 'Multiple COVID-19 vaccine doses stress' response, which is shown to inhibit pulsatile GnRH secretion and promote 'Cortisol upregulation.' This cortisol increase is linked to 'Vaginal microbiota dysregulation' and 'Abnormal Menstrual Bleeding.' Simultaneously, an 'Immune response' from vaccination is depicted affecting 'Ovarian hormones' (Estrogen and Progesterone), also contributing to menstrual irregularities. Finally, the diagram indicates that SARS-CoV-2 infection can lead to 'Angiotensin II dysregulation' via the ACE2 receptor on ovarian tissue, potentially resulting in 'Fertility alterations.' This medical illustration serves to visualize the complex neuroendocrine and immunological interactions impacting reproductive health in the context of viral stress and immune activation.
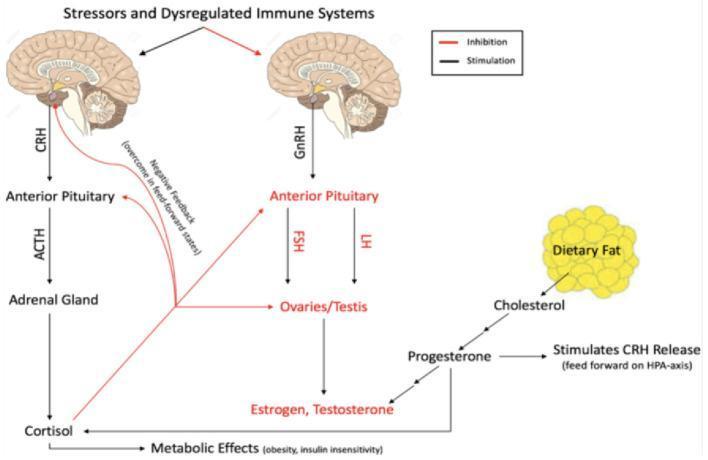
A medical flow diagram illustrating the complex interactions between the Hypothalamic-Pituitary-Adrenal (HPA) axis, the Hypothalamic-Pituitary-Gonadal (HPG) axis, and metabolic factors. The diagram uses black arrows to signify stimulation and red lines to signify inhibition. The HPA axis pathway shows 'Stressors and Dysregulated Immune Systems' triggering the release of Corticotropin-Releasing Hormone (CRH), which stimulates the Anterior Pituitary to release ACTH, subsequently causing the Adrenal Gland to produce Cortisol. A negative feedback loop is shown where Cortisol inhibits the Anterior Pituitary. The HPG axis involves Gonadotropin-Releasing Hormone (GnRH) stimulating the release of FSH and LH from the Anterior Pituitary, which acts on the Ovaries/Testis to produce Estrogen and Testosterone. Cross-talk is evidenced by Cortisol inhibiting the HPG axis at multiple levels. Additionally, a metabolic pathway demonstrates 'Dietary Fat' converting to Cholesterol and Progesterone, which exerts a feed-forward stimulatory effect on CRH release, linking nutrition and obesity to HPA axis dysregulation.
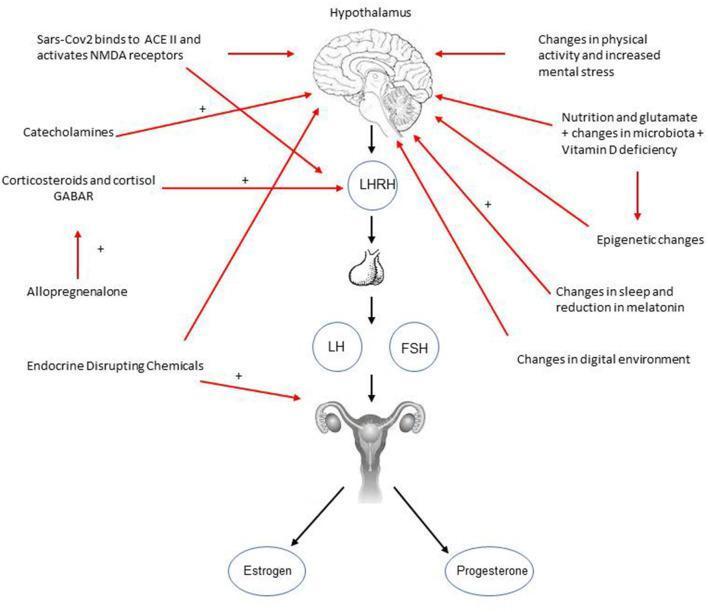
This pathophysiology diagram illustrates the hypothalamic-pituitary-gonadal (HPG) axis and various external factors contributing to precocious or rapidly progressive puberty. The central vertical axis displays a downward cascade starting from the hypothalamus, leading to LHRH (GnRH), then the pituitary gland, which secretes LH and FSH. These hormones act on the uterus and ovaries to produce estrogen and progesterone. Surrounding this central axis are several environmental and physiological stressors linked by red arrows. Factors influencing the hypothalamus include SARS-CoV-2 binding to ACE II/NMDA receptors, catecholamines, physical activity changes, mental stress, nutrition, and microbiota alterations. Direct influences on LHRH involve corticosteroids, cortisol, and allopregnanolone. Endocrine-disrupting chemicals are shown targeting the reproductive organs. Positive symbols (+) indicate stimulatory pathways. The diagram serves as an educational tool for endocrinology and pediatrics, highlighting how modern lifestyle factors, infections, and environmental toxins can disrupt normal pubertal timing via neuroendocrine pathways.
gender affirming hormone therapy effects on body systems
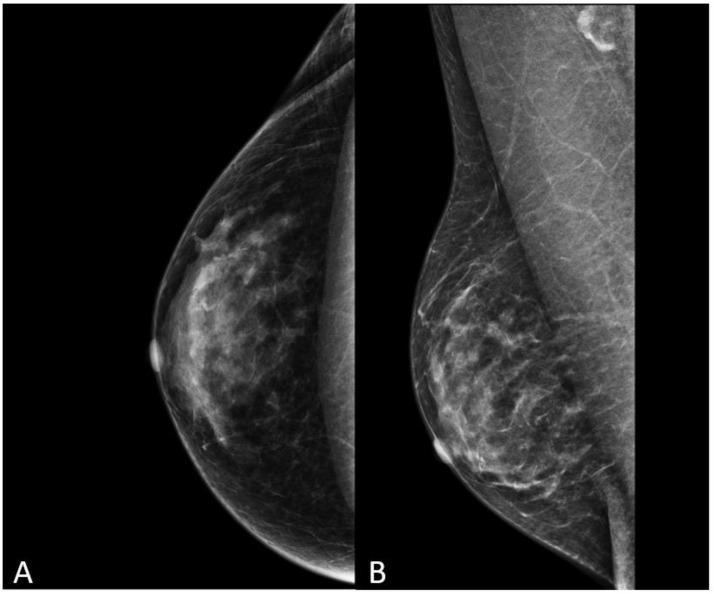
This diagnostic image displays two mammographic projections of the left breast: (A) the Cranio-Caudal (CC) view and (B) the Medio-Lateral Oblique (MLO) view. The clinical context involves a 52-year-old transgender woman following 5 years of feminizing hormone therapy. The mammogram reveals a diffuse, radio-opaque fibroglandular tissue pattern, which is more concentrated in the retroareolar and central regions and extends towards the axilla in the MLO view. This appearance mimics the typical parenchyma of a biological female breast, a result of estrogen-induced ductal and stromal development. No suspicious spiculated masses, architectural distortions, or clustered microcalcifications are identified. Small, well-defined oval densities near the skin surface may represent benign findings such as epidermal cysts or small intramammary lymph nodes. The pectoral muscle is visible in the MLO view, and the nipple is seen in profile in both projections. This image illustrates the expected physiological changes in breast tissue composition following long-term gender-affirming hormone therapy.

Clinical photograph comparison showing pre-operative and immediate post-operative results of a gender-affirming bilateral mastectomy. Top image: Pre-operative view of a patient with an obese body habitus and pendulous breast tissue. Purple surgical markings delineate the double-opposing incision planes, midline, and inframammary folds. Diffuse acne and scattered seborrheic keratoses are visible on the chest skin. Bottom image: Immediate post-operative result (POD 0) following subcutaneous mastectomy with free nipple grafting. The chest displays a flatter, more masculine contour with bilateral horizontal incision lines closed by sutures. Two circular free nipple grafts are visible in a superior, lateral position relative to the main incisions. A transparent occlusive dressing covers the surgical field, and a Jackson-Pratt drainage tube is visible exiting the lateral chest wall. The comparison illustrates the surgical transition from female-typical breast anatomy to a masculinized chest wall appearance as part of gender-affirming care.
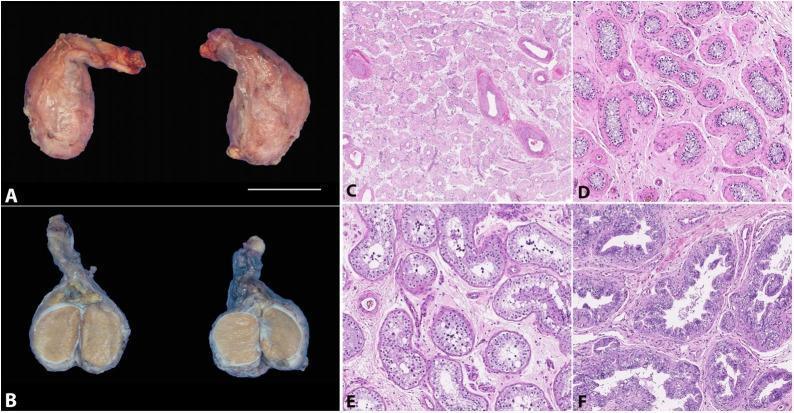
This composite figure illustrates the gross and microscopic pathology of an orchiectomy specimen following hormone therapy. Panels A and B show the gross external and cut surfaces of the testis and epididymis; the external surface is pale pink-tan and smooth, while the cut surface reveals a homogenous, tan parenchyma (scale bar = 3 cm). Panels C through F are light micrographs stained with Hematoxylin and Eosin (H&E) demonstrating characteristic histopathological changes. Panel C (40X) displays widespread fibrosis of seminiferous tubules and a notable absence of Leydig cells. Panel D (100X) highlights prominent peritubular hyalinization and fibrosis. Panel E (100X) illustrates significantly reduced spermatogenesis and germ cell maturation arrest within the tubules. Panel F (100X) shows peri-epididymal fibrosis accompanied by hyperplasia of the epididymal epithelium. This collection serves as an educational reference for the effects of gender-affirming hormone therapy on testicular architecture and spermatogenesis.
bone mineral density osteoporosis transgender
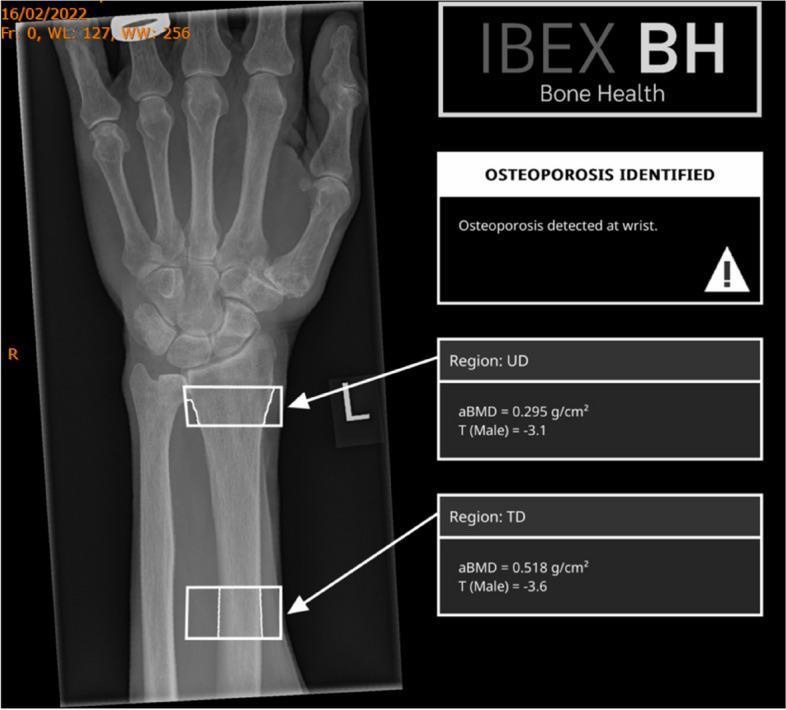
An IBEX Bone Health DICOM report displaying an automated bone mineral density (BMD) analysis on a posterior-anterior (PA) radiograph of a human forearm and wrist. On the left, the X-ray shows the distal radius, ulna, and carpal bones with two superimposed white rectangular Regions of Interest (ROI). The superior ROI is placed at the ultra-distal (UD) radius, and the inferior ROI is placed at the distal-third (TD) shaft of the radius. On the right, diagnostic text boxes indicate 'OSTEOPOROSIS IDENTIFIED' with a warning symbol. Quantitative data for each region is provided: the UD region shows an areal BMD (aBMD) of 0.295 g/cm² and a male-referenced T-score of -3.1, while the TD region shows an aBMD of 0.518 g/cm² and a T-score of -3.6. This diagnostic tool is used for osteoporosis screening and risk assessment by deriving bone density metrics from standard digital radiographs.
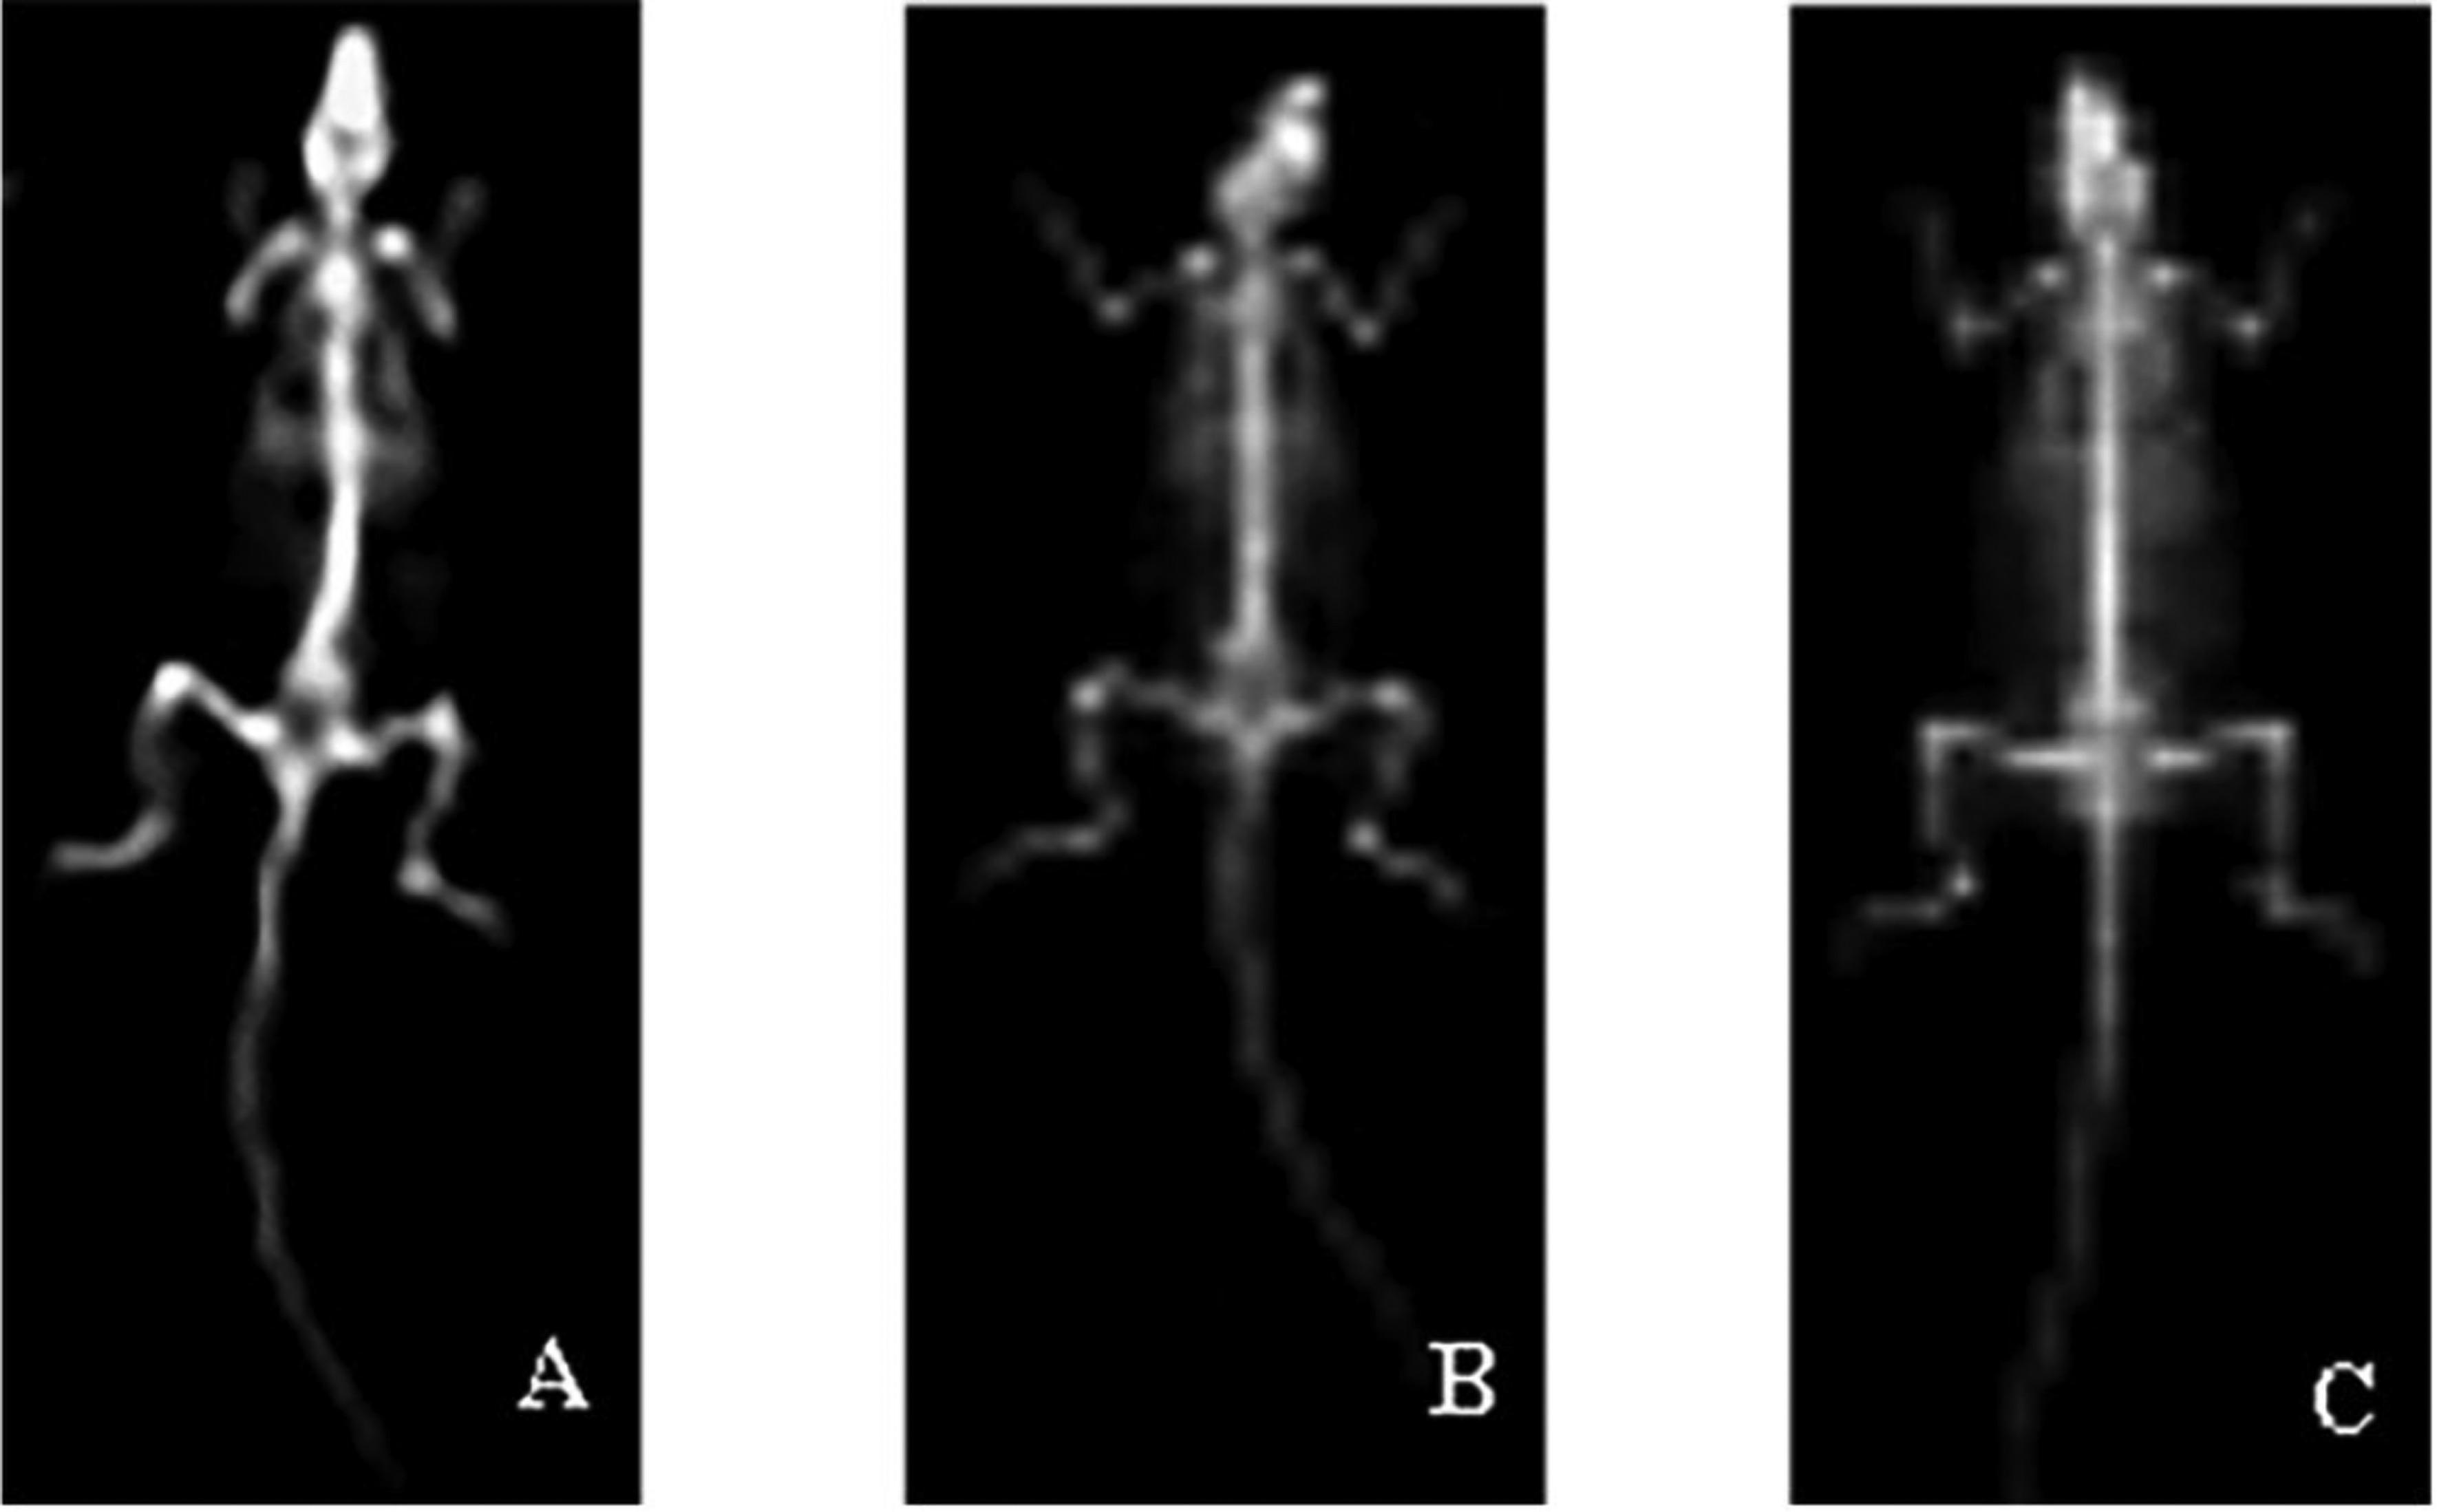
This diagnostic X-ray series displays full-body skeletal imaging of three rat models (A, B, and C) to compare bone mineral density (BMD) in the context of osteoporosis research. (A) Representing the Sham operation group, the skeleton exhibits high radiopacity, particularly in the femoral and vertebral regions, indicating healthy, dense bone structure. (B) Representing the model group (ovariectomized), there is a visible reduction in radiopacity; the bones appear more radiolucent and less distinct, signifying systemic bone loss and decreased mineral density characteristic of osteoporosis. (C) Representing the RRP treatment group, the image shows a qualitative increase in bone radiopacity compared to the model group, suggesting partial restoration or preservation of bone mineral content following intervention. The images provide a comparative visual assessment of skeletal integrity, highlighting the pathological thinning of cortical and trabecular bone in the disease model and the therapeutic effect of the studied compound on bone density maintenance.
cardiovascular risk thrombosis venous embolism estrogen
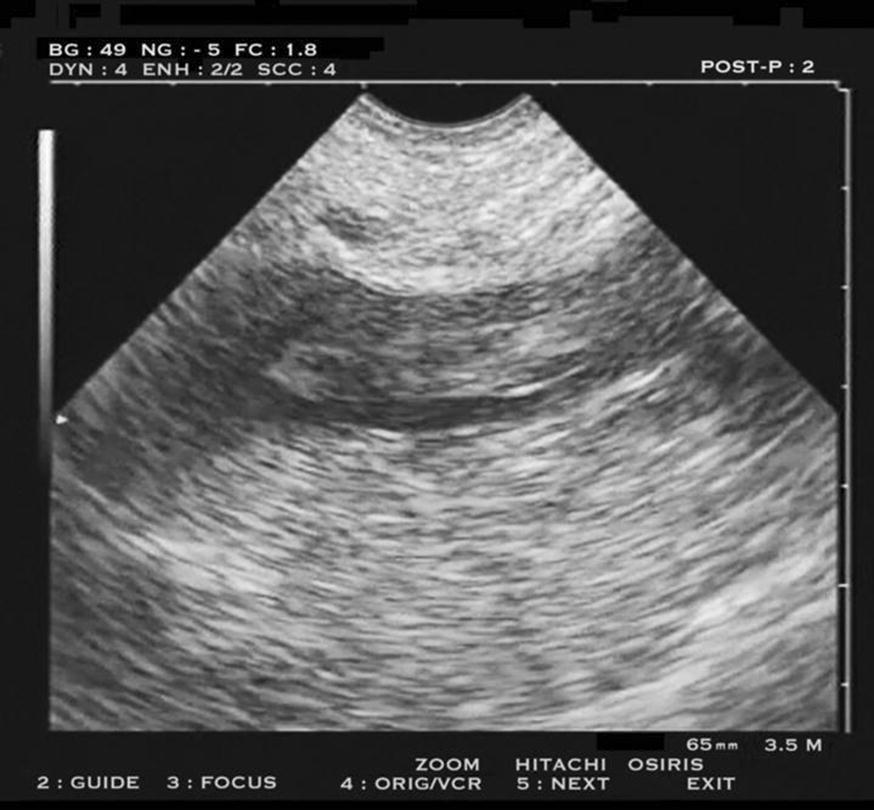
This diagnostic ultrasound image, captured in the longitudinal plane using a microconvex probe, demonstrates a deep venous thrombosis (DVT) within the external iliac vein. The image shows a prominent hypoechoic, elongated tubular structure representing the vein. Within the vessel lumen, there is a distinct, heterogeneously echogenic mass consistent with a 'floating' thrombus. The thrombus displays a mottled texture with interspersed hyperechoic and hypoechoic areas, appearing detached from the vessel walls at certain points. The surrounding tissues exhibit varying echogenicity with horizontal banding patterns. This visual is clinically significant for identifying high-risk venous thromboembolism, where the substantial volume and lack of complete adherence to the vessel wall suggest a high risk of dislodgement and subsequent pulmonary embolism. The imaging is part of a point-of-care ultrasound (POCUS) protocol used for pre-transportation screening in critical care and emergency medicine.
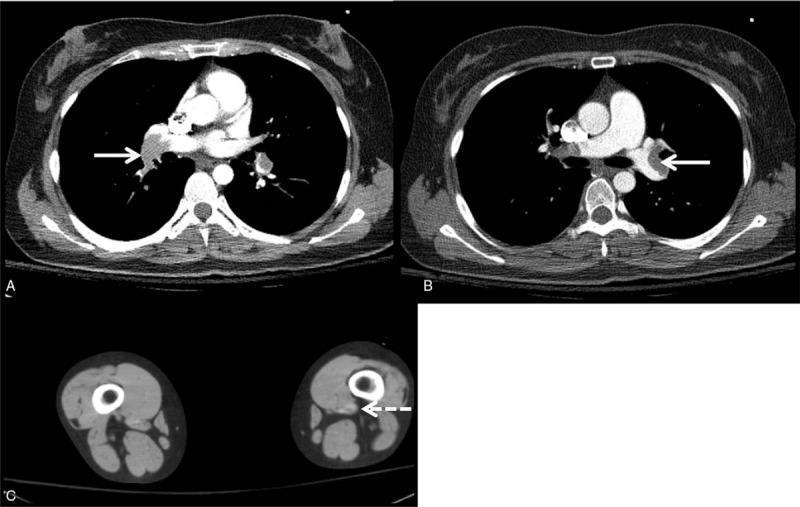
This composite diagnostic image features contrast-enhanced computed tomography (CT) scans illustrating a case of venous thromboembolism. Panels A and B are axial CT pulmonary angiogram (CTPA) slices of the thorax, demonstrating significant filling defects within the right and left main pulmonary arteries (indicated by solid white arrows), as well as within the lobar branches. These hypodense areas within the contrast-opacified vascular lumen are pathognomonic for acute pulmonary embolism. Panel C is an axial CT scan of the lower extremities at the level of the thighs/popliteal fossa, showing a filling defect in the left popliteal vein (indicated by a dashed white arrow), consistent with deep vein thrombosis (DVT). The educational focus of the image is to demonstrate the radiological correlation between a proximal DVT and resultant massive pulmonary thromboembolism. This material is relevant for medical students and radiology residents studying cardiovascular pathology and emergency diagnostic imaging.
sex differentiation brain hypothalamus gender
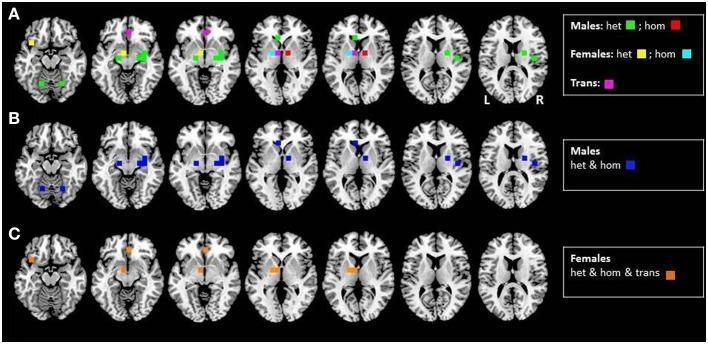
A diagnostic functional neuroimaging visualization presenting axial brain slices organized into three horizontal rows (A, B, and C). The images illustrate neural activation patterns in response to a pheromone-like compound (AND), mapped using positron emission tomography (PET) data. Row A demonstrates comparative activations based on sex and sexual orientation, with colored 10 mm spheres indicating specific groups: green for heterosexual males, red for homosexual males, yellow for heterosexual females, cyan for homosexual females, and magenta for male-to-female transsexuals. Row B shows aggregated sex-specific activation for both heterosexual and homosexual males in blue. Row C displays combined activation for heterosexual females, homosexual females, and male-to-female transsexuals in orange. The slices are oriented in a standard radiological view with 'L' and 'R' markers visible in the far-right panel of row A. The visualization highlights distinct cortical and subcortical areas of activation, including the hypothalamus and limbic regions, providing clinical insight into the neurobiology of sexual orientation and gender identity.
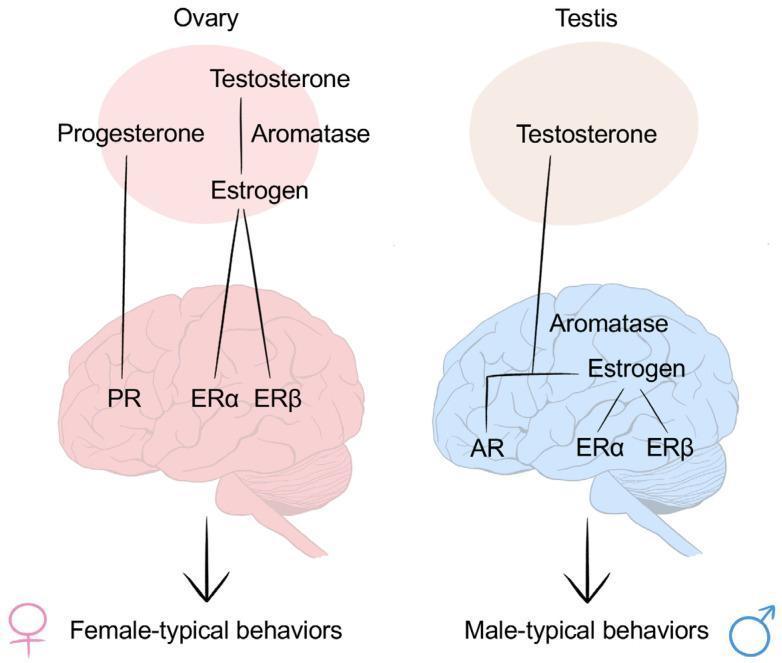
A comparative pathophysiology diagram illustrating the organizational-activational hypothesis of brain sexual differentiation. The diagram is divided into female (left) and male (right) pathways. On the female side (pink), the ovary produces progesterone, testosterone, and estrogen; these hormones travel to the brain to bind with progesterone receptors (PR), estrogen receptor alpha (EȒ̑α), and estrogen receptor beta (ERβ), leading to female-typical behaviors. On the male side (blue), the testis produces testosterone, which travels to the brain. In the male brain, testosterone binds directly to androgen receptors (AR) or is converted into estrogen via the enzyme aromatase, which then binds to ERα and ERβ to promote masculinization and male-typical behaviors. The illustration highlights the key roles of sex steroids and local brain enzymatic activity (aromatization) in determining neurobiological sex differences. This content is relevant for endocrinology, neurobiology, and reproductive medicine studies.