
Hlo
Best medicine for old people for leg patela pain like reumotoid arthritis
rheumatoid arthritis knee pain elderly treatment
rheumatoid arthritis knee joint treatment
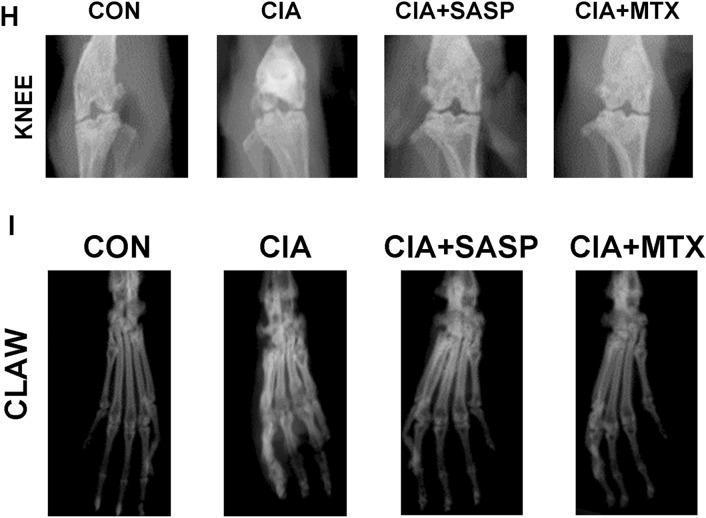
This diagnostic image set displays comparative radiographic views of mouse knee joints (Panel H) and claws (Panel I) within an experimental Rheumatoid Arthritis (RA) model. The content is organized into four comparative groups: Control (CON), Collagen-Induced Arthritis (CIA), CIA treated with Sulfasalazine (CIA+SASP), and CIA treated with Methotrexate (CIA+MTX). In the knee joint radiographs, the CON group shows clear joint spaces and smooth cortical margins. The CIA group exhibits joint space narrowing and articular surface erosion. Treatment groups (SASP and MTX) demonstrate partial preservation of the joint architecture. In the claw radiographs (Panel I), the CON group shows normal bone density and alignment of the phalanges and metacarpals. The CIA group displays signs of inflammatory bone destruction, characterized by decreased bone density and structural blurring. The CIA+SASP and CIA+MTX groups show improved bone integrity and better-defined skeletal structures compared to the untreated CIA group. These images illustrate the radiographic progression of RA-like joint damage and the therapeutic efficacy of DMARDs (disease-modifying antirheumatic drugs) in a preclinical mammalian model.
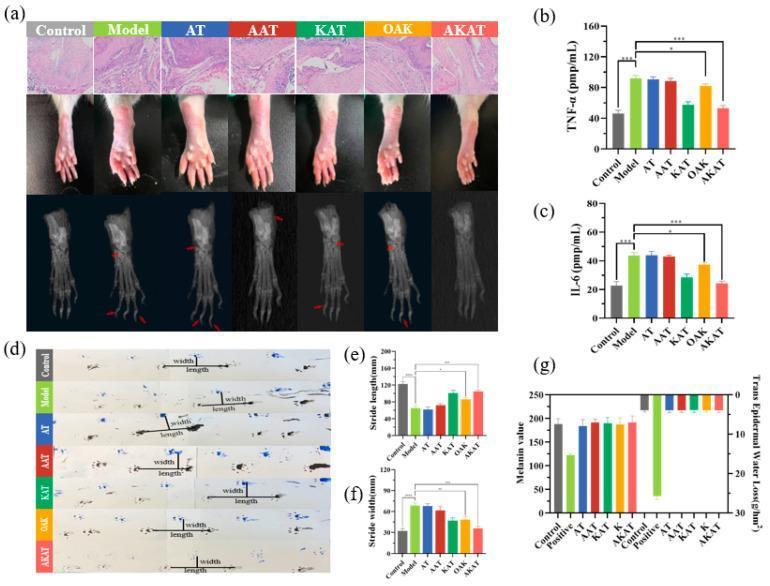
This composite educational figure illustrates the anti-inflammatory and joint-protective effects of various drug treatments (Actarit and Ketoprofen formulations) in a rat model of Rheumatoid Arthritis (RA). Section (a) features H&E-stained histological sections of knee joints, clinical photographs of hind paw edema, and radiographic (X-ray) images of the tarsometatarsal joints across seven groups (Control, Model, AT, AAT, KAT, OAK, AKAT). Red arrows on the X-rays highlight areas of bone erosion and joint space narrowing, most prominent in the Model group and least in the AKAT group. (b) and (c) are bar graphs showing serum concentrations of pro-inflammatory cytokines TNF-α and IL-6, illustrating therapeutic downregulation. (d) presents footprint analysis with labeled stride length and width, while (e) and (f) provide the corresponding statistical gait analysis, showing functional motor recovery. (g) depicts skin barrier function through melanin and trans-epidermal water loss (TEWL) measurements. This figure demonstrates the synergistic efficacy of combined DMARD and NSAID topical treatment in suppressing synovial proliferation and cartilage destruction.
![Educational visual demonstrating [18F]fluoro-PEG-folate PET-CT imaging for monitoring rheumatoid arthritis treatment response in a rodent model. The composite consists of three coronal PET-CT scans (a-c) and three corresponding time-activity curves (d-f). Images compare a control group (a) with 2x methotrexate-treated (b) and 4x methotrexate-treated groups (c). Orange ellipsoids define regions of interest (ROI) around the synovium of the arthritic knee. A color heat map correlates with the Standardized Uptake Value (SUV) scale from 0 (blue) to 1 (red). The control group shows intense tracer uptake (warmer colors) in the arthritic joint. MTX-treated groups show progressive reduction in signal intensity (cooler colors), indicating decreased folate receptor activity. Accompanying graphs plot SUV over 3500 seconds, with blue lines representing the arthritic knee and red lines the contralateral control knee. The graphs show that MTX treatment narrows the gap in tracer uptake between arthritic and healthy joints, decreasing the peak and plateau phases compared to the control group. This highlights the tracer's utility in quantifying synovial inflammation and therapeutic efficacy.](https://cdn.orris.care/cdss_images/pmc_clinical_VQA_29259aa2ffcf10bbbc7515c87053ffbc4ea9b16bada9ed89c06b35df21d29586.jpg)
Educational visual demonstrating [18F]fluoro-PEG-folate PET-CT imaging for monitoring rheumatoid arthritis treatment response in a rodent model. The composite consists of three coronal PET-CT scans (a-c) and three corresponding time-activity curves (d-f). Images compare a control group (a) with 2x methotrexate-treated (b) and 4x methotrexate-treated groups (c). Orange ellipsoids define regions of interest (ROI) around the synovium of the arthritic knee. A color heat map correlates with the Standardized Uptake Value (SUV) scale from 0 (blue) to 1 (red). The control group shows intense tracer uptake (warmer colors) in the arthritic joint. MTX-treated groups show progressive reduction in signal intensity (cooler colors), indicating decreased folate receptor activity. Accompanying graphs plot SUV over 3500 seconds, with blue lines representing the arthritic knee and red lines the contralateral control knee. The graphs show that MTX treatment narrows the gap in tracer uptake between arthritic and healthy joints, decreasing the peak and plateau phases compared to the control group. This highlights the tracer's utility in quantifying synovial inflammation and therapeutic efficacy.
Medicines for Knee/Patellar Pain in Elderly RA Patients
Important note: RA is managed by a rheumatologist. The medicines below require proper diagnosis and monitoring. Always consult a doctor before starting or changing treatment.
1. DMARDs (Disease-Modifying Antirheumatic Drugs) - First-Line
Methotrexate (MTX) - Gold Standard
- Weekly oral dose: 7.5 to 25 mg/week (taken once a week, NOT daily)
- Always combine with folic acid 1-4 mg/day to reduce side effects
- Elderly caution: Kidney function must be checked regularly - if kidneys decline, MTX can become toxic
- Monitor: blood count (CBC) + liver tests every 8-12 weeks
- Very effective at slowing joint damage - Goldman-Cecil Medicine, p. 341
Hydroxychloroquine
- Dose: keep below 5 mg/kg/day
- Yearly eye check after 5 years of use (can rarely affect vision)
- Mild drug, good for elderly; also reduces cholesterol and lowers diabetes risk
- Often combined with methotrexate - Goldman-Cecil Medicine, p. 353
Sulfasalazine
- Monthly blood count (CBC) checks for first 6 months, then every 6 months
- Another safe option, can be combined with MTX
Leflunomide
- Alternative to methotrexate
- Liver + blood count monitoring every 4-8 weeks
- Very long half-life - takes weeks to clear from body
2. Short-Term Bridging: Corticosteroids (Prednisone)
- Used to quickly control inflammation while DMARDs take effect (they take weeks to work)
- Elderly special concern: Always add calcium + vitamin D + bisphosphonate (like alendronate) to prevent steroid-induced osteoporosis
- Should NOT be used long-term - Goldman-Cecil Medicine, p. 333
3. Pain Relief (Symptomatic)
NSAIDs (e.g., Ibuprofen, Naproxen, Celecoxib)
- Help with pain and inflammation
- Celecoxib (a COX-2 inhibitor) is preferred in elderly - less stomach bleeding risk than regular NSAIDs
- Elderly risks to watch: kidney damage, high blood pressure, stomach ulcers, heart problems
- Use the lowest effective dose for shortest time
- Add a proton pump inhibitor (omeprazole) to protect the stomach - Goodman & Gilman's Pharmacology
Topical Diclofenac Gel
- Applied directly on the knee
- Much lower systemic (body-wide) side effects
- Excellent choice for elderly with kidney or stomach concerns
Intra-articular Corticosteroid Injection
- Doctor injects steroid directly into the knee joint
- Provides fast, targeted relief for 4-12 weeks
- Safer than oral steroids for local knee pain
4. Biologic Drugs (for moderate-severe RA not responding to DMARDs)
| Drug Class | Examples | Note |
|---|---|---|
| TNF inhibitors | Adalimumab, Etanercept | Stop if any fever/infection; risk of serious infections higher in elderly |
| IL-6 inhibitors | Tocilizumab | Raises cholesterol; avoid if history of gut perforation |
| JAK inhibitors | Tofacitinib, Baricitinib | Higher herpes zoster risk; watch liver/kidney/clot risks |
- According to Firestein & Kelley's Textbook of Rheumatology, biologic drugs are significantly more effective when combined with methotrexate
- Elderly precaution: Infection risk is higher, especially in the first 6 months of biologic therapy
5. Non-Drug Support (Very Important in Elderly)
- Physiotherapy - quadriceps strengthening reduces load on the patella
- Weight loss - each kg lost reduces 4 kg of force on the knee
- Walking aids (cane, walker) - reduce knee strain
- Hot/cold packs - temporary pain relief
- Knee splints/bracing - support the patella
Summary Table: Best Options for Elderly Knee RA Pain
| Priority | Medicine | Main Benefit | Main Risk in Elderly |
|---|---|---|---|
| 1st | Methotrexate | Stops disease progression | Kidney toxicity (monitor renal function) |
| 2nd | Hydroxychloroquine | Mild, safe, extra benefits | Eye check needed |
| Bridging | Low-dose Prednisone | Fast inflammation control | Osteoporosis |
| Pain | Topical Diclofenac | Local pain relief, safe | Minimal |
| Pain | Celecoxib | Oral pain + inflammation | GI/kidney/heart |
| Severe RA | Biologics + MTX | Best disease control | Infection risk |
Chlorzoxazone
Chlorzoxazone - Complete Drug Profile
Drug Class
Mechanism of Action
Indications
- Acute muscle spasm from local tissue trauma or muscle strains
- Musculoskeletal pain (e.g., low back pain with spasm)
- Adjunct to rest, physiotherapy, and other measures for musculoskeletal conditions
Dose
- 250 to 500 mg, three or four times per day (oral)
- Firestein & Kelley's Textbook of Rheumatology
Side Effects
| Side Effect | Notes |
|---|---|
| Drowsiness | Most common - CNS depression |
| Dizziness / Headache | Common |
| Dry mouth | Mild anticholinergic effect |
| GI upset | Nausea, stomach discomfort |
| Hepatocellular toxicity | Rare but serious - liver damage has been reported |
| Urine discoloration | Urine may turn orange or reddish-purple (harmless) |
Comparison With Other Muscle Relaxants
| Drug | Efficacy Evidence | Special Notes |
|---|---|---|
| Cyclobenzaprine | Strong (consistent trend vs. placebo) | Most sedating; tricyclic-like |
| Tizanidine | Good | Alpha-2 agonist; hypotension risk |
| Carisoprodol | Moderate | Abuse potential |
| Orphenadrine | Good | Anticholinergic; CI in glaucoma, BPH |
| Chlorzoxazone | Limited evidence | Hepatotoxicity risk |
| Methocarbamol | Limited | Well tolerated |
| Baclofen | Good for spasticity | Less useful for musculoskeletal spasm |
| Metaxalone | Mixed evidence | Least sedating |
Cautions / Contraindications
- Hepatic disease - avoid or use with great caution (hepatotoxic)
- Elderly patients - increased CNS depression and fall risk due to drowsiness/dizziness
- Alcohol - additive CNS depression; avoid combination
- Driving/machinery - warn patients about drowsiness
- Pregnancy - safety not well established
Key Clinical Point for Musculoskeletal / RA Context
Brand Names (Common)
- Parafon Forte (chlorzoxazone 500 mg)
- Lorzone, Remular-S (various regions)
- In India, commonly available in combination tablets with diclofenac or paracetamol (e.g., Flexon-MR, Dolowin-MR)