
405c1d79-1468-44ac-aa81-b8e45fb8783b.jpeg
Tell me about this ecg
Reading File
Finding Sources
Loading Image
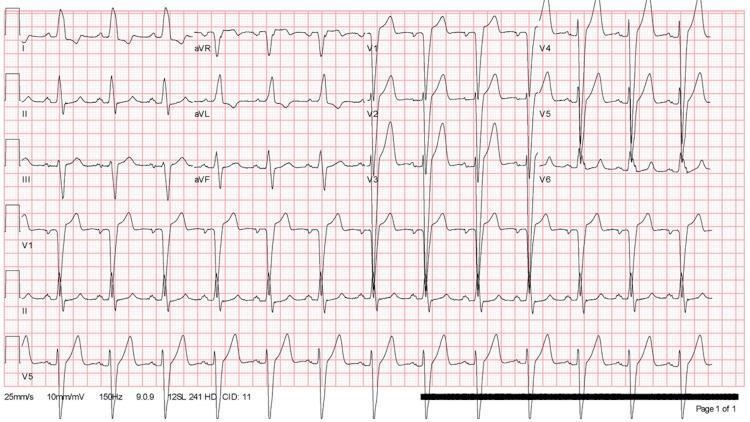
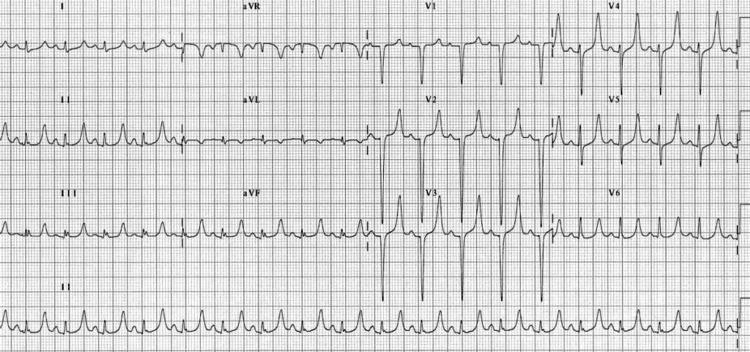
Here is a systematic interpretation of this 12-lead ECG:
ECG Technical Details
- Paper speed: 25 mm/s
- Gain: 10 mm/mV (limb leads), 5 mm/mV (some sections), 10 mm/mV (precordial)
- Filter: AC ON, 0.05–35 Hz
- Mode: AUTO
Systematic Analysis
Rate
The RR intervals appear regular and roughly consistent with a heart rate of approximately 60–80 bpm (normal range). The rhythm appears regular throughout.
Rhythm
- P waves appear present and upright in leads I and II before each QRS complex
- This is consistent with normal sinus rhythm
Axis
- Positive QRS in lead I, positive in lead II → Normal axis (approximately 0° to +90°)
- aVF appears upright, confirming normal axis
P Waves
- P waves are visible and precede each QRS
- Morphology appears normal — no evidence of P mitrale (bifid, wide) or P pulmonale (tall, peaked)
PR Interval
- Appears within normal limits (~120–200 ms / 3–5 small squares at 25 mm/s)
- No obvious prolongation suggesting AV block
QRS Complex
- QRS duration appears narrow (< 120 ms / 3 small squares) — no bundle branch block morphology obvious
- In V1: predominantly negative (rS pattern) — normal
- In V5–V6: taller R waves — normal R wave progression
ST Segments & T Waves
- Leads V1–V3: There appears to be some ST segment changes — possible mild ST elevation or early repolarization in V2–V3; T waves appear relatively tall/prominent in the precordial leads
- Inferior leads (II, III, aVF): ST segments appear isoelectric
- Lateral leads (I, aVL, V5–V6): No obvious ST depression
QT Interval
- The QT interval appears normal for the rate — no obvious QTc prolongation
Notable Findings
| Feature | Observation |
|---|---|
| Rhythm | Sinus rhythm |
| Rate | ~60–80 bpm (normal) |
| Axis | Normal |
| PR interval | Normal |
| QRS duration | Narrow |
| R wave progression | Normal (V1–V6) |
| ST changes | Possible early repolarization in V2–V3 |
| T waves | Slightly prominent precordial T waves |
Impression
This ECG is largely within normal limits, with possible early repolarization in the precordial leads (V2–V3), which is a common benign variant — particularly in young males. There is no clear evidence of:
- Acute STEMI
- Bundle branch block
- AV block
- Significant arrhythmia
- LVH or RVH criteria met
⚠️ Important disclaimer: This analysis is for educational purposes only. ECG interpretation requires clinical correlation with the patient's symptoms, history, and physical examination. A qualified clinician must review this tracing for any clinical decision-making. If this patient has chest pain, dyspnea, syncope, or other symptoms, urgent evaluation is required.
I am 21 yrs old and this is my ecg is this all normal
Yes, for a 21-year-old, this ECG looks normal and reassuring. Here's what that means for you specifically:
Your ECG at a Glance
| What we check | What yours shows | Normal for age 21? |
|---|---|---|
| Heart rhythm | Regular sinus rhythm | ✅ Yes |
| Heart rate | ~60–80 bpm | ✅ Yes |
| Electrical axis | Normal | ✅ Yes |
| PR interval | Normal | ✅ Yes |
| QRS (conduction) | Narrow, normal | ✅ Yes |
| ST segments | No worrying changes | ✅ Yes |
| T waves | Slightly prominent V2–V3 | ✅ Common at your age |
The Only "Different" Thing
The slightly tall/prominent T waves in the chest leads (V2–V3) that I noted are called early repolarization — this is:
- Seen in up to 30% of young, healthy people, especially males under 30
- Completely benign in the vast majority of cases
- Not a disease or a risk factor on its own
Bottom Line
Your ECG looks like a normal ECG for a healthy 21-year-old. There are no signs of:
- Heart attack
- Abnormal heart rhythms
- Structural heart problems
- Electrical conduction issues
One important note: An ECG is a snapshot in time. If you had it done because of symptoms like chest pain, palpitations, fainting, or shortness of breath — even with a normal ECG, you should still follow up with your doctor to discuss those symptoms directly. A normal ECG doesn't rule out every possible heart condition. But if this was a routine check, you have nothing to worry about here. 😊
Give me tricks to read ecg when it comes over my hand
Finding Sources
Finding Sources
Here is a practical, memorable system for reading any ECG quickly — the kind of approach you build into muscle memory:
The ECG Reading System: "RRIQQST"
Use this mnemonic every single time, in order. Never skip steps.
Step 1 — R: Rate
Trick: The 300 method
Count the number of large squares between two R peaks.
| Large squares | Heart rate |
|---|---|
| 1 | 300 bpm |
| 2 | 150 bpm |
| 3 | 100 bpm |
| 4 | 75 bpm |
| 5 | 60 bpm |
| 6 | 50 bpm |
🧠 Memory trick: "300, 150, 100, 75, 60, 50" — memorize this sequence like a phone number.
Step 2 — R: Rhythm
Look at the rhythm strip (usually lead II at the bottom).
- Are R-R intervals equal? → Regular
- Are P waves present before every QRS? → Sinus rhythm
- Are P waves missing or irregular? → Think atrial fibrillation, flutter, etc.
🧠 Trick: Place a piece of paper and mark 3 R peaks. Slide it along — if all peaks match, it's regular.
Step 3 — I: intervals (PR)
Normal PR = 3–5 small squares (120–200 ms)
- Short PR (<3 sq) → Pre-excitation (WPW) or junctional rhythm
- Long PR (>5 sq) → Heart block (1st, 2nd, or 3rd degree)
🧠 Trick: PR should fit "one big square" comfortably — no more, no less.
Step 4 — Q: QRS width
Normal QRS = < 3 small squares (< 120 ms)
- Narrow QRS → Electrical activation is coming from above (supraventricular) ✅
- Wide QRS (≥3 sq) → Think bundle branch block, ventricular rhythm, hyperkalaemia
🧠 Trick: If the QRS looks "fat," something is blocking the fast pathway.
Step 5 — Q: Axis
Look at leads I and aVF only:
| Lead I | aVF | Axis |
|---|---|---|
| ↑ Positive | ↑ Positive | Normal ✅ |
| ↑ Positive | ↓ Negative | Left axis deviation |
| ↓ Negative | ↑ Positive | Right axis deviation |
| ↓ Negative | ↓ Negative | Extreme axis (rare) |
🧠 Trick: "Thumbs up in I and aVF = Normal." Think of it as two thumbs up 👍👍
Step 6 — S: ST Segment
This is the most important step in an emergency.
- ST elevation (>1mm in limb leads, >2mm in chest leads) → STEMI until proven otherwise 🚨
- ST depression → Ischaemia, posterior MI, digoxin effect
- Saddle-shaped ST elevation → Pericarditis
- Flat/normal ✅
🧠 Trick: The ST segment should "sit on the fence" — perfectly flat with the baseline. Any hillside up or down is a red flag.
Step 7 — T: T waves + QTc
- Normal T waves are upright in I, II, V3–V6 and inverted in aVR (and sometimes V1)
- Tall peaked T waves → Hyperkalaemia (first ECG sign)
- Inverted T waves → Ischaemia, PE (V1–V3), RVH
- Flattened T waves → Hypokalaemia, hypothyroidism
QTc: Count QT interval, should be < half the RR interval
- Long QTc → Risk of torsades de pointes
🧠 Trick: "T wave should point the same direction as the QRS in most leads." If it doesn't → investigate.
Bonus: The "STEMI Cheat Sheet" by Territory
When you see ST elevation, localise it:
| Leads with STE | Territory | Artery |
|---|---|---|
| II, III, aVF | Inferior | RCA |
| I, aVL, V5–V6 | Lateral | LCx |
| V1–V4 | Anterior | LAD |
| V1–V2 only | Septal | LAD (proximal) |
| V7–V9 / reciprocal V1–V3 depression | Posterior | LCx or RCA |
The 60-Second ECG Checklist
Every time an ECG comes to your hand, say this out loud:
- "Rate?" → Count large squares
- "Regular? P before QRS?" → Rhythm
- "PR normal?" → 3–5 small squares
- "QRS narrow or wide?" → < 3 sq = narrow
- "Axis: thumbs up in I and aVF?"
- "ST elevation anywhere?" → Emergency scan first
- "T waves pointing right way?"
With practice, this whole process takes under 60 seconds. The more ECGs you read, the more patterns you recognise without even consciously thinking through each step. Start reading every ECG you come across, even if it's normal — normal is the baseline that makes abnormal obvious.
All with image example
Searching Images
normal sinus rhythm ECG
Searching Images
STEMI ST elevation myocardial infarction ECG
Searching Images
ECG heart rate calculation large squares
Searching Images
bundle branch block wide QRS ECG
Searching Images
atrial fibrillation ECG irregular rhythm
Searching Images
heart block PR interval prolonged first degree AV block ECG
Searching Images
T wave inversion peaked T wave hyperkalemia ECG
Searching Images
ECG axis deviation lead I aVF
Here is the complete illustrated ECG reading guide — each step with a real ECG example:
📋 How to Read Any ECG — Illustrated Guide
Step 1 — RATE
Trick: Divide 300 by the number of large squares between two R waves.
300 ÷ 5 large squares = 60 bpm | 300 ÷ 3 = 100 bpm
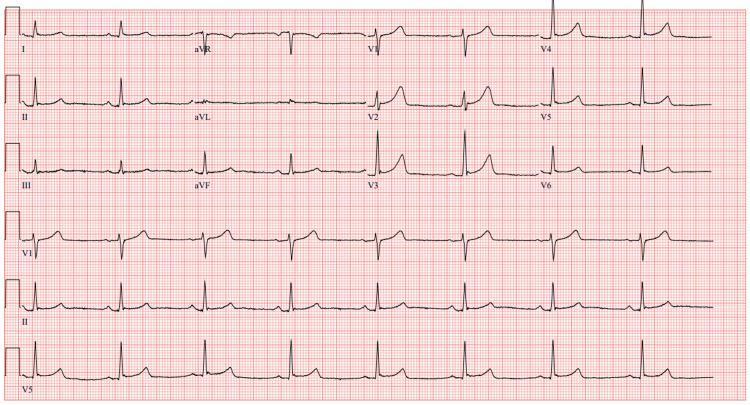
Example — Normal rate (~75 bpm), 4 large squares between R waves:
Example — Sinus Bradycardia (~48 bpm), 6 large squares between R waves:
Step 2 — RHYTHM
Look at lead II rhythm strip:
- Regular R-R intervals + P before every QRS = Sinus rhythm ✅
- Irregularly irregular + no P waves = Atrial Fibrillation ❌
Example — Atrial Fibrillation (no P waves, totally irregular):
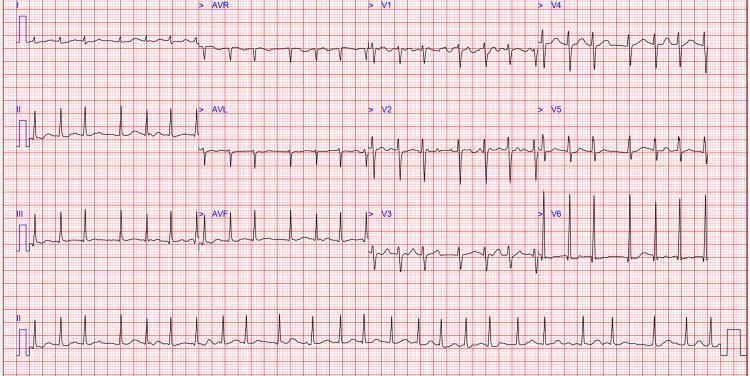
🧠 Notice: NO organised P waves. Baseline is chaotic (fibrillatory waves). R-R intervals are completely irregular.
Step 3 — PR INTERVAL
Normal = 3–5 small squares (120–200 ms)
- Too long (>5 small squares) = Heart Block
- Too short = WPW / junctional rhythm
Example — 1st Degree AV Block (markedly prolonged PR):
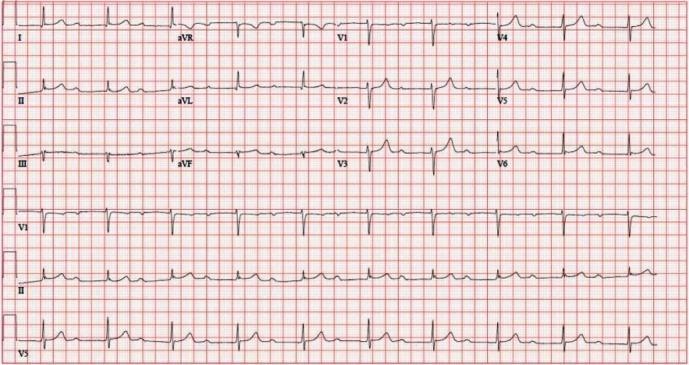
🧠 Notice: P wave is present before each QRS, but the gap between P and QRS is very long (>200 ms = >1 large square).
Step 4 — QRS WIDTH
Normal = < 3 small squares (< 120 ms)
- Narrow QRS = normal conduction ✅
- Wide QRS = Bundle branch block, ventricular rhythm, or hyperkalaemia
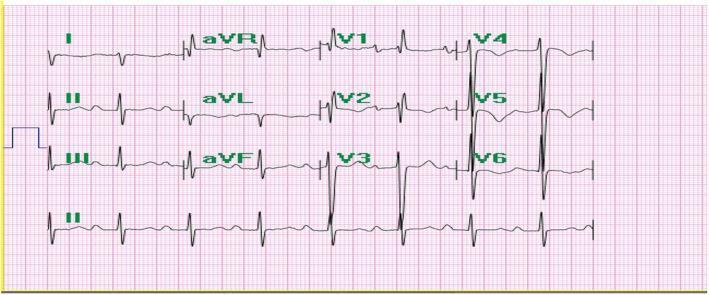
Example — Left Bundle Branch Block (wide, notched QRS):
Example — Right Bundle Branch Block (RSR' "rabbit ears" in V1):
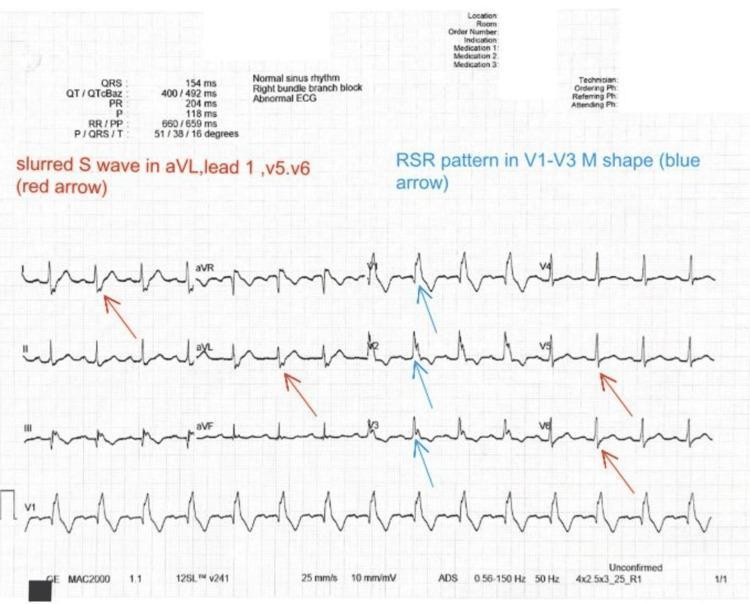
🧠 LBBB trick: Broad M-shaped R in V5/V6, deep QS in V1 — think "WiLLiaM" (W in V1, M in V5 = LBBB) 🧠 RBBB trick: RSR' in V1, slurred S in V5/V6 — think "MaRRoW" (M in V1, W in V5 = RBBB)
Step 5 — AXIS
Only look at leads I and aVF:
| Lead I | aVF | Axis |
|---|---|---|
| ↑ Up | ↑ Up | Normal 👍👍 |
| ↑ Up | ↓ Down | Left axis deviation |
| ↓ Down | ↑ Up | Right axis deviation |
Example — Right Axis Deviation (negative in lead I, positive in aVF):
🧠 Deep S wave in Lead I = something pulling electricity to the right.
Step 6 — ST SEGMENT ⚠️ Most Important Step
The ST segment should sit flat on the baseline.
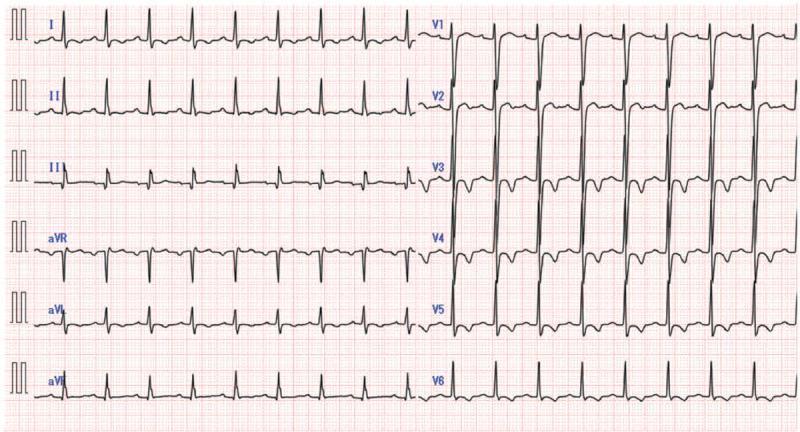
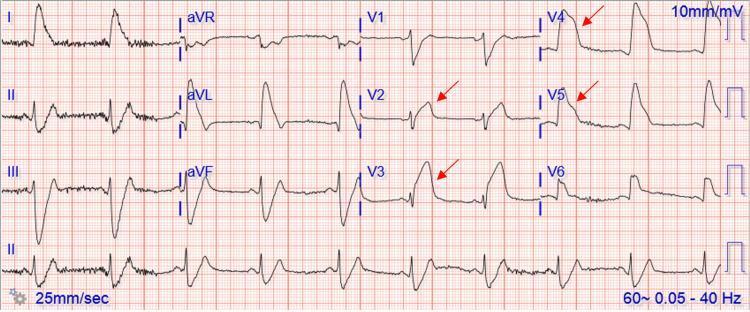
Example — Anterior STEMI (massive ST elevation in V1–V6, "tombstone" pattern):
Example — Anterolateral STEMI with reciprocal changes (ST depression in inferior leads):

🧠 Key rule: ST elevation in a territory + ST depression in the opposite leads (reciprocal changes) = STEMI until proven otherwise. Call for help immediately.
STEMI Territory Quick Reference:
| ST elevation in... | Culprit artery |
|---|---|
| V1–V4 | LAD (anterior) |
| II, III, aVF | RCA (inferior) |
| I, aVL, V5–V6 | LCx (lateral) |
Step 7 — T WAVES
Normal T waves = same direction as QRS in most leads
Example — Peaked T waves in Hyperkalaemia (tall, narrow, "tented"):
Progressive ECG changes of hyperkalaemia (from Harrison's):
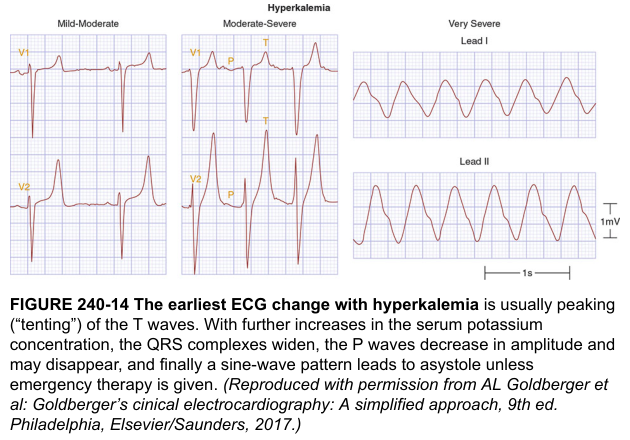
🧠 As K⁺ rises: Peaked T → Wide QRS → Sine wave → Asystole. Treat before it goes too far.
The 60-Second Mental Checklist
Every time an ECG lands in your hand, run through this in order:
1. RATE       → Count large squares between R peaks (300 ÷ n)
2. RHYTHM     → Regular? P before every QRS?
3. PR         → 3–5 small squares? (< 1 large square)
4. QRS        → Narrow (< 3 sq)? Wide = block
5. AXIS       → Thumbs up in I and aVF?
6. ST         → Elevation anywhere? → STEMI scan first!
7. T waves    → Same direction as QRS? Peaked = K⁺?
The more ECGs you read, the faster this becomes automatic — patterns jump out before you even start counting. Practice on every ECG you encounter, normal or not.
Give me accurate image s
Finding Sources
Finding Sources
Finding Sources
Finding Sources
Finding Sources
Reading File
Reading File
Finding Sources
Finding Sources
Reading File
Reading File
Your credits are exhausted. Your daily credits reset tomorrow, or you can purchase a top-up for more.
This is a shared conversation. Sign in to Orris to start your own chat.