Here are complete answers to all questions in your BPT Semester I exam paper:
SECTION B - Short Answer Questions
ANATOMY [2 marks]
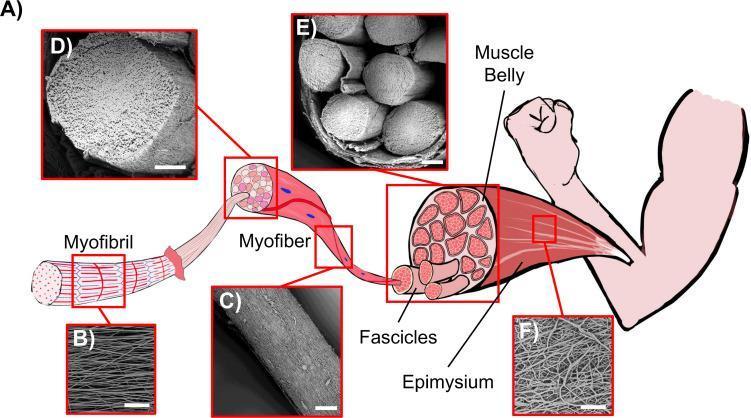
Q1. Draw a well-labeled diagram of skeletal muscle
Skeletal Muscle - Structural Hierarchy:
MUSCLE (whole organ)
│
├── Epimysium - dense CT sheath surrounding entire muscle
│
├── Fascicle (bundle of fibers)
│   └── Perimysium - surrounds each fascicle
│
└── Muscle Fiber (single cell)
    └── Endomysium - surrounds each fiber
        │
        └── MYOFIBRIL
            │
            ├── I-band (light) - actin only
            ├── A-band (dark) - actin + myosin overlap
            ├── H-zone - myosin only
            ├── Z-line - anchors actin, defines sarcomere
            └── M-line - center of H-zone
Diagram:
Epimysium
 ┌──────────────────────────────┐
 │  Perimysium                  │
 │  ┌─────────────┐             │
 │  │ Fascicle    │  ← Fascicle │
 │  │ ┌──────┐   │             │
 │  │ │Fiber │   │  ← Muscle   │
 │  │ │  ↑   │   │    Fiber    │
 │  │ │ Endo │   │             │
 │  │ │ mysm │   │             │
 │  │ └──────┘   │             │
 │  └─────────────┘             │
 └──────────────────────────────┘

Sarcomere (one unit):
Z────I────A────H────A────I────Z
     actin  myosin  actin
The key proteins are actin (thin filaments, ~6 nm) and myosin (thick filaments, ~10 nm). Contraction occurs by the sliding filament mechanism - myosin heads pull actin toward the center, shortening the sarcomere.
BIOCHEMISTRY [6 marks]
Q2. Synthesis and Importance of Melanin
Melanin is the pigment responsible for skin, hair, and eye color. It is synthesized in melanocytes (derived from neural crest cells) within specialized organelles called melanosomes.
Synthesis Pathway:
Phenylalanine
     ↓ (Phenylalanine hydroxylase)
L-Tyrosine
     ↓ (Tyrosinase - rate-limiting, copper-dependent)
DOPA (3,4-dihydroxyphenylalanine)
     ↓ (Tyrosinase)
Dopaquinone
     ↓
     ├──→ Eumelanin (brown/black) - via cyclization & polymerization
     └──→ Pheomelanin (red/yellow) - via cysteine addition
Types:
- Eumelanin - brown/black pigment; predominant in darker skin
- Pheomelanin - red/yellow pigment; predominant in fair/red-haired individuals
Importance of Melanin:
- Photoprotection - absorbs and scatters UV radiation, protecting DNA from UV-induced mutations
- Skin color - determines racial/ethnic skin pigmentation
- Antioxidant - scavenges free radicals
- Eye protection - in choroid and retinal pigment epithelium, reduces light scatter
- Neurological role - neuromelanin in dopaminergic neurons of substantia nigra (its loss is seen in Parkinson's disease)
Clinical correlation: Albinism results from a deficiency/absence of functional tyrosinase, leading to absent melanin, hypopigmentation, photosensitivity, and increased risk of skin cancer.
Q3. Biochemical Basis of Organophosphate Poisoning
Organophosphates (e.g., malathion, parathion, nerve agents) inhibit the enzyme acetylcholinesterase (AChE).
Normal mechanism:
Acetylcholine (ACh) → AChE → Choline + Acetate (inactivation)
In organophosphate poisoning:
Organophosphate + AChE → Phosphorylated AChE (irreversible inhibition)
                            ↓
            ACh accumulates at synapses
Consequences of ACh accumulation:
| Receptor Type | Location | Effect (SLUDGE) |
|---|
| Muscarinic (M) | Glands, smooth muscle, heart | Salivation, Lacrimation, Urination, Defecation, GI cramps, Emesis; bradycardia, miosis, bronchospasm |
| Nicotinic (N) | NMJ, autonomic ganglia | Muscle fasciculations, weakness, paralysis |
| CNS | Brain | Seizures, coma, respiratory depression |
Key biochemical point: The phosphorylated AChE undergoes "aging" - the phosphate bond becomes even more irreversible over time. Oximes (e.g., pralidoxime/2-PAM) can regenerate AChE if given early, before aging occurs.
Q4. Define and Classify Carbohydrates with Examples
Definition: Carbohydrates are polyhydroxy aldehydes or ketones (or compounds that yield these on hydrolysis). General formula: (CH₂O)n.
Classification:
I. Monosaccharides (cannot be hydrolyzed further)
- Based on carbon number: Trioses (C₃), Tetroses (C₄), Pentoses (C₅), Hexoses (C₆)
- Based on carbonyl group: Aldoses (aldehyde - e.g., glucose) / Ketoses (ketone - e.g., fructose)
- Examples: Glucose (C₆ aldose), Fructose (C₆ ketose), Galactose, Ribose (C₅)
II. Disaccharides (2 monosaccharides joined by glycosidic bond)
| Disaccharide | Components | Bond |
|---|
| Sucrose (table sugar) | Glucose + Fructose | α1→β2 |
| Lactose (milk sugar) | Galactose + Glucose | β1→4 |
| Maltose (malt sugar) | Glucose + Glucose | α1→4 |
III. Oligosaccharides (3-10 monosaccharide units)
- Examples: Raffinose, Stachyose (in legumes)
IV. Polysaccharides (>10 units)
- Homopolysaccharides (one type of sugar):
- Starch (storage in plants) - amylose + amylopectin
- Glycogen (storage in animals - liver, muscle)
- Cellulose (structural in plants)
- Heteropolysaccharides (different types of sugars):
- Hyaluronic acid, Heparin (anticoagulant), Chondroitin sulfate (cartilage)
MICROBIOLOGY [6 marks]
Q5. Explain Bacteria Growth Curve
The bacterial growth curve represents the growth of a bacterial population in a closed (batch) culture system over time. It has 4 phases:
        Log of
        number
        of cells
           |                         ___
           |                       /    \
           |            _________/      \____
           |           /  Stationary
           |   _______/  Exponential
           |  / Lag
           |/_________________________
                        Time →
1. Lag Phase
- No increase in cell number
- Cells are metabolically active - synthesizing enzymes, RNA, adapting to new medium
- Duration depends on medium composition and inoculum size
2. Log (Exponential) Phase
- Cells divide at maximum rate by binary fission
- Cell number doubles every generation time (doubling time)
- Most metabolically active; most sensitive to antibiotics
- Formula: N = N₀ × 2ⁿ (where n = number of generations)
3. Stationary Phase
- Growth rate = Death rate (net zero growth)
- Nutrients depleted, toxic metabolites accumulate
- Spore formation occurs in this phase (e.g., Bacillus, Clostridium)
4. Decline (Death) Phase
- Death rate > Growth rate
- Bacteria die due to nutrient exhaustion and toxic waste
- Some cells may persist (viable but non-culturable state)
Clinical relevance: Antibiotics that target cell wall synthesis (penicillin, cephalosporins) are most effective during the log phase when bacteria are actively dividing.
Q6. Classify Viruses with Examples
Classification of Viruses:
A. Based on Nucleic Acid:
| Type | Examples |
|---|
| DNA viruses | Herpes simplex (HSV), Hepatitis B, Adenovirus, Poxvirus, HPV |
| RNA viruses | HIV, Influenza, Poliovirus, Rabies, SARS-CoV-2, Hepatitis C |
B. Based on Symmetry of Capsid:
- Icosahedral - Adenovirus, Poliovirus, Rhinovirus
- Helical - Tobacco mosaic virus, Rabies
- Complex - Poxvirus, Bacteriophages
C. Based on Envelope:
- Enveloped (lipid bilayer): HIV, HSV, Influenza, Hepatitis C, Rabies
- Non-enveloped (Naked): Poliovirus, Adenovirus, Rotavirus, HPV
D. Based on Host:
- Animal viruses (pathogenic to humans)
- Bacteriophages (infect bacteria)
- Plant viruses
E. Baltimore Classification (replication strategy):
- Class I: dsDNA (Herpesvirus, Adenovirus)
- Class II: ssDNA (Parvovirus)
- Class III: dsRNA (Reovirus)
- Class IV: (+) ssRNA (Poliovirus, Hepatitis A)
- Class V: (−) ssRNA (Influenza, Rabies)
- Class VI: ssRNA-RT (HIV - Retroviruses)
- Class VII: dsDNA-RT (Hepatitis B)
Q7. Different Modes of Transmission of Disease with Examples
| Mode | Description | Examples |
|---|
| Direct contact | Physical contact between source and host | STIs (Gonorrhea, Syphilis), Scabies, Ringworm |
| Droplet | Large droplets (>5 µm), travel <1 m | Influenza, Common cold, COVID-19, Mumps, Measles |
| Airborne | Droplet nuclei (<5 µm), remain suspended | TB (M. tuberculosis), Measles, Chickenpox |
| Fecal-oral | Ingestion of contaminated food/water | Cholera, Typhoid, Polio, Hepatitis A, Rotavirus |
| Vector-borne | - Biological vector (pathogen multiplies): Malaria (Anopheles mosquito), Dengue (Aedes), Plague (fleas) - Mechanical vector (no multiplication): Housefly (typhoid) | |
| Fomite (Indirect) | Contaminated inanimate objects | Conjunctivitis (towels), Hepatitis B (needles) |
| Zoonosis | Animal-to-human transmission | Rabies (dog bite), Brucellosis (cattle), Anthrax |
| Vertical (Mother to child) | Transplacental, during birth, breastfeeding | HIV, Rubella, Toxoplasmosis, Hepatitis B |
| Parenteral/Blood-borne | Contact with infected blood/body fluids | HIV, Hepatitis B, Hepatitis C |
PATHOLOGY [6 marks]
Q8 (circled 5). Cellular Adaptations with Examples
Cellular adaptations are reversible changes in cell size, number, phenotype, or function in response to stress.
| Adaptation | Definition | Example |
|---|
| Hypertrophy | Increase in cell size (not number); no cell division | Cardiac hypertrophy in hypertension; skeletal muscle in weight training |
| Hyperplasia | Increase in cell number by mitosis | Endometrial hyperplasia (estrogen excess); compensatory liver hyperplasia |
| Atrophy | Decrease in cell size (and sometimes number) | Muscle wasting in disuse; brain atrophy in Alzheimer's |
| Metaplasia | Reversible change of one differentiated cell type to another | Barrett's esophagus (squamous → columnar); smoker's bronchi (columnar → squamous) |
| Dysplasia | Disordered cell growth - abnormal size, shape, organization | Cervical dysplasia (CIN) - precancerous |
| Aplasia | Failure of an organ to develop | Aplastic anemia (bone marrow fails to produce cells) |
Q9 (circled 6). Pathophysiology of Edema
Edema = abnormal accumulation of fluid in the interstitial space.
Normal fluid balance (Starling forces):
Capillary filtration OUT = Capillary hydrostatic pressure (Pc) - Plasma oncotic pressure (πp)
Fluid return IN = Interstitial oncotic pressure (πi) - Interstitial hydrostatic pressure (Pi)
Mechanisms leading to edema:
1. Increased Capillary Hydrostatic Pressure
- Venous obstruction, heart failure, portal hypertension
- Fluid pushed out of capillaries into interstitium
- Example: Ankle edema in right heart failure
2. Decreased Plasma Oncotic Pressure (↓ Albumin)
- Nephrotic syndrome (protein loss in urine), liver cirrhosis (↓ albumin synthesis), malnutrition (kwashiorkor)
- Less fluid drawn back into capillaries
3. Increased Vascular Permeability
- Inflammation, allergy, histamine, bradykinin
- Protein leaks out → raises interstitial oncotic pressure
- Example: Angioedema, insect bites
4. Lymphatic Obstruction (Lymphedema)
- Failure of lymphatics to drain interstitial fluid
- Example: Filariasis (elephantiasis), post-mastectomy arm edema
5. Sodium and Water Retention
- Renal failure, hyperaldosteronism
- Increases intravascular volume → increases Pc
Q10 (circled 7). Tuberculoid vs. Lepromatous Leprosy
| Feature | Tuberculoid Leprosy (TT) | Lepromatous Leprosy (LL) |
|---|
| Immune response | Strong CMI (cell-mediated) | Weak CMI; strong humoral |
| Lepromin test | Positive | Negative |
| Bacillary load | Paucibacillary (few bacilli) | Multibacillary (many bacilli) |
| Skin lesions | Few (1-5), well-defined, hypopigmented, raised edges, dry | Numerous, ill-defined, diffuse; leonine facies, madarosis (loss of eyebrows) |
| Sensation | Markedly reduced/absent (anesthesia) | Mildly reduced/preserved initially |
| Nerves | Few, enlarged, palpable, asymmetric | Multiple, symmetrically involved, less enlarged |
| Nasal involvement | Absent | Saddle nose deformity (nasal septum collapse) |
| Bacteriology (slit-skin smear) | Negative (AFB absent) | Positive (abundant AFB - globi) |
| Histology | Epithelioid granulomas with lymphocytes; no bacilli | Foamy (Virchow) macrophages full of bacilli; no granulomas |
| Prognosis | Self-limiting; good prognosis | Progressive; needs prolonged treatment |
| Treatment | 6-month MDT (Rifampicin + Dapsone) | 12-month MDT (Rifampicin + Dapsone + Clofazimine) |
PHARMACOLOGY [8 marks]
Q11 (Q8 in paper). Management of Organophosphorus Poisoning
Emergency management - follow ABCs:
1. Stabilization
- Secure airway (risk of bronchospasm + secretions)
- Oxygen supplementation / mechanical ventilation if needed
- Remove contaminated clothing; copious skin/eye washing (decontamination)
2. Specific Antidotes:
A. Atropine (Antimuscarinic)
- Blocks muscarinic receptors - counteracts SLUDGE effects
- Initial dose: 2-4 mg IV (adults); repeat every 5-10 minutes
- Titration endpoint: drying of secretions (not heart rate)
- May need very large doses (up to 100+ mg in severe cases)
B. Pralidoxime (2-PAM, Oxime)
- Reactivates phosphorylated AChE before "aging"
- Dose: 1-2 g IV over 15-30 minutes, then infusion
- Must be given early (within 24-48 hours); ineffective after aging
- Addresses nicotinic effects (muscle weakness, paralysis) that atropine cannot
C. Benzodiazepines
- For seizure control (diazepam 5-10 mg IV)
3. Supportive care:
- Treat bronchospasm with atropine (not beta-agonists)
- Monitor cardiac rhythm (QTc prolongation risk)
- Correct electrolyte imbalances
- Gastric lavage if oral ingestion within 1 hour
Q12 (Q9 in paper). Beta-Blockers: Therapeutic Uses and Adverse Effects
Beta-blockers competitively block β-adrenergic receptors (β₁, β₂, β₃).
Types:
- Non-selective: Propranolol, Carvedilol (also α-blocker), Labetalol
- Cardioselective (β₁ selective): Metoprolol, Atenolol, Bisoprolol, Esmolol
- With ISA (intrinsic sympathomimetic activity): Pindolol
Therapeutic Uses:
| Indication | Mechanism |
|---|
| Hypertension | ↓ Cardiac output, ↓ Renin release |
| Angina pectoris | ↓ Heart rate and contractility → ↓ O₂ demand |
| Post-MI (secondary prevention) | Cardioprotection, antiarrhythmic |
| Heart failure (chronic stable) | Metoprolol, bisoprolol, carvedilol - reduce mortality |
| Arrhythmias (SVT, AF rate control) | ↓ AV node conduction |
| Glaucoma | Timolol eye drops - ↓ aqueous humor production |
| Hyperthyroidism (thyrotoxicosis) | ↓ Sympathetic symptoms (tremor, palpitation) |
| Migraine prophylaxis | Propranolol |
| Anxiety/performance anxiety | Propranolol (blocks peripheral tremor, palpitations) |
| Pheochromocytoma | Used with alpha-blocker first |
| Esophageal varices | Propranolol - ↓ portal pressure |
Adverse Effects:
| System | Effect |
|---|
| Cardiovascular | Bradycardia, hypotension, heart block, worsening heart failure (acute) |
| Respiratory | Bronchospasm (dangerous in asthma/COPD - avoid non-selective) |
| CNS | Fatigue, sleep disturbances, nightmares, depression |
| Metabolic | Hyperglycemia masking (blunts hypoglycemia warning signs in diabetics); dyslipidemia |
| Sexual | Erectile dysfunction |
| Rebound | Rebound hypertension/angina if stopped abruptly |
Contraindications: Asthma, COPD (non-selective), acute decompensated heart failure, 2nd/3rd degree heart block, bradycardia.
Q13 (Q10 in paper). Receptors: Definition and Types
Definition: Receptors are specific macromolecular structures (usually proteins) located on the cell surface or intracellularly that bind with a drug/ligand with high specificity and affinity to produce a biological response.
Types of Receptors:
1. Ligand-Gated Ion Channels (Ionotropic)
- Binding opens/closes ion channels directly
- Fast response (milliseconds)
- Examples: Nicotinic ACh receptor (Na⁺/K⁺), GABA-A receptor (Cl⁻), Glutamate (NMDA) receptor
2. G-Protein Coupled Receptors (GPCRs) / Metabotropic
- 7-transmembrane domain receptors
- Linked to Gα, Gβγ subunits → activate second messengers
- Moderate response (seconds-minutes)
- Subtypes:
- Gs → ↑ adenylyl cyclase → ↑ cAMP (β-adrenergic, D1)
- Gi → ↓ cAMP (α₂-adrenergic, D2, M2)
- Gq → ↑ phospholipase C → IP₃ + DAG (M1, M3, α₁, H1)
- Examples: Adrenergic, Muscarinic, Dopamine, Histamine receptors
3. Enzyme-Linked Receptors (Kinase-Linked)
- Single transmembrane; intracellular domain has enzymatic activity
- Mostly tyrosine kinase activity
- Slow response (hours-days)
- Examples: Insulin receptor, Growth hormone receptor, EGF receptor, IGF receptor
4. Nuclear/Intracellular Receptors
- Located in cytoplasm or nucleus
- Bind lipid-soluble ligands that cross cell membrane
- Regulate gene transcription
- Slowest response (hours-days)
- Examples: Steroid receptors (glucocorticoids, sex hormones), Thyroid hormone receptor, Vitamin D receptor
Q14 (Q11 in paper). Bioavailability: Definition and Factors Affecting It
Definition: Bioavailability (F) is the fraction (or percentage) of an administered drug dose that reaches the systemic circulation in unchanged (active) form and the rate at which it does so.
- For IV drugs: Bioavailability = 100% (by definition)
- For oral drugs: F = AUC_oral / AUC_IV × 100%
Factors Affecting Bioavailability:
1. Pharmaceutical factors (drug formulation):
- Tablet disintegration and dissolution rate
- Particle size (smaller = better absorption)
- Polymorphic forms of drug
- Excipients used in formulation
2. Drug-related factors:
- Lipid solubility - lipophilic drugs cross membranes better
- Molecular size - small molecules absorbed better
- pKa and pH - affects ionization; unionized forms are absorbed
- Chemical stability in GI tract (e.g., penicillin G destroyed by acid)
3. First-pass metabolism (hepatic/gut wall):
- Most important factor reducing oral bioavailability
- Drugs absorbed from gut → portal vein → liver → extensively metabolized before reaching systemic circulation
- Examples of high first-pass drugs: Morphine, Propranolol, Lignocaine, GTN, Labetalol
4. Route of administration:
- IV > IM > SC > Sublingual > Oral > Rectal > Topical (generally)
- Sublingual/buccal bypass first-pass (e.g., GTN, buprenorphine)
5. GI factors:
- Gastric emptying rate (faster = faster absorption)
- GI motility, pH, surface area
- Food-drug interactions (food may ↓ or ↑ bioavailability)
- P-glycoprotein (efflux pump) - reduces absorption
6. Drug interactions:
- Enzyme inducers (e.g., rifampicin) → ↓ F
- Enzyme inhibitors (e.g., ketoconazole) → ↑ F
- Chelation (tetracycline + calcium/antacids → ↓ F)
PHYSIOLOGY [2 marks]
Q15 (Q12 in paper). Saltatory Conduction for Transmission of Action Potential
Saltatory conduction (from Latin saltare = to jump) is the mechanism by which action potentials propagate along myelinated nerve fibers by "jumping" from one node of Ranvier to the next.
Structural basis:
- Myelinated fibers are covered by Schwann cells (PNS) or oligodendrocytes (CNS) forming a myelin sheath
- Myelin is electrically insulating - prevents ion flow through the membrane
- Nodes of Ranvier are gaps (~1 µm) between adjacent myelin segments where voltage-gated Na⁺ channels are densely concentrated
- The distance between nodes is approximately 1-2 mm (internodal segment)
Mechanism:
Action potential at Node 1
        ↓
Local current flows through axoplasm
(ions cannot cross myelinated segment)
        ↓
Current reaches Node 2 (threshold reached)
        ↓
Na⁺ channels open → Action potential at Node 2
        ↓
Repeats → AP "jumps" to Node 3, 4, 5...
Advantages of saltatory conduction:
- Faster conduction velocity - up to 120 m/s in myelinated A-α fibers (vs. 0.5-2 m/s in unmyelinated C-fibers)
- Energy efficient - Na⁺/K⁺ ATPase only needs to restore ionic gradients at nodes, not along entire axon length
- Conserves axonal space - allows fast conduction in small diameter fibers
Clinical relevance: In multiple sclerosis (MS), demyelination destroys the myelin sheath, abolishing saltatory conduction and slowing/blocking nerve transmission, causing weakness, sensory loss, and visual disturbances.
SECTION B - Clinical Based Questions
ANATOMY [10 marks]
Q16. Clinical Scenario: 18-year-old girl, short stature, broad chest, webbed neck, underdeveloped genitalia, small uterus, fatty ovaries, primary amenorrhea
a. Probable Diagnosis [1 mark]
Turner Syndrome (45,XO / Gonadal Dysgenesis)
This is the classic presentation: short stature + webbed neck + broad chest + primary amenorrhea + sexual infantilism + streak gonads (fatty ovaries on CT). The karyotype is 45,X (monosomy X).
The handwritten annotations on the paper (Down's, Klinefelter's, Patau's, Edwards, Edward's syndrome) are other chromosomal disorders - but the clinical picture here is definitively Turner syndrome.
b. Other Numerical Chromosomal Disorders with Examples [4 marks]
Numerical chromosomal disorders = Aneuploidy - abnormal number of chromosomes due to non-disjunction during meiosis.
| Disorder | Karyotype | Features |
|---|
| Down Syndrome (Trisomy 21) | 47,XX or XY +21 | Intellectual disability, flat facies, upslanting palpebral fissures, simian crease, Brushfield spots, congenital heart defects (ASD, VSD), hypotonia, Alzheimer's risk in adulthood. Most common viable autosomal trisomy. |
| Edwards Syndrome (Trisomy 18) | 47,XX or XY +18 | IUGR, overlapping fingers (index over middle), rocker-bottom feet, micrognathia, congenital heart defects, kidney malformations. Usually fatal within first year. |
| Patau Syndrome (Trisomy 13) | 47,XX or XY +13 | Holoprosencephaly, cyclopia, cleft lip/palate, polydactyly, microphthalmia. Usually fatal within weeks. |
| Klinefelter Syndrome | 47,XXY | Males only: small testes (hypogonadism), infertility, gynaecomastia, tall stature, learning difficulties. Most common sex chromosome disorder in males. |
| Turner Syndrome | 45,XO | (As above - the case question) |
| Triple X Syndrome | 47,XXX | Females: usually tall, fertile, often asymptomatic or mild learning difficulties |
| XYY Syndrome | 47,XYY | Males: tall stature, fertile, increased impulsivity; usually no major abnormalities |
Mechanism of non-disjunction:
- Non-disjunction in Meiosis I - both homologous chromosomes go to same cell
- Non-disjunction in Meiosis II - sister chromatids fail to separate
- Risk increases with advancing maternal age (especially for trisomy 21)
Q17. Clinical Scenario: 25-year-old man, swelling of upper limb, road accident 2 months ago, nonunion of fracture humerus, mobility at upper and lower ends of humerus
a. Cause of Pain of Bone [1 mark]
The pain in bone (especially in nonunion) is caused by:
- Periosteum - the outer fibrous covering of bone is richly supplied by sensory nerve fibers (mainly from somatic nerves). It is the most pain-sensitive structure of bone.
- In nonunion: abnormal mobility at the fracture site stimulates periosteal pain receptors
- Additionally: endosteum (inner lining), medullary vessels also carry nociceptive fibers
- Substance P and prostaglandins released at fracture site sensitize nociceptors
The periosteum is the primary source of bone pain.
b. Parts and Blood Supply of Humerus with Diagram [4 marks]
Parts of Humerus:
              HEAD (articulates with glenoid)
             /
    GREATER TUBERCLE (external rotation muscles: IST)
   /
  LESSER TUBERCLE (internal rotation: subscapularis)
  |
  BICIPITAL GROOVE (intertubercular sulcus - long head of biceps)
  |
  SURGICAL NECK ← common fracture site
  |
  SHAFT
  |      ← Radial groove (spiral groove) on posterior surface
  |         (contains radial nerve + profunda brachii artery)
  |
  LOWER END:
  ├── CAPITULUM (lateral) - articulates with radius
  ├── TROCHLEA (medial) - articulates with ulna
  ├── MEDIAL EPICONDYLE (ulnar nerve runs behind it)
  ├── LATERAL EPICONDYLE
  ├── CORONOID FOSSA (anterior, accommodates coronoid process)
  ├── OLECRANON FOSSA (posterior, accommodates olecranon)
  └── RADIAL FOSSA (above capitulum)
Blood Supply of Humerus:
| Artery | Region Supplied |
|---|
| Anterior circumflex humeral artery (branch of axillary) | Head of humerus (main supply to humeral head) |
| Posterior circumflex humeral artery (branch of axillary) | Head and surgical neck |
| Profunda brachii (deep brachial) artery (branch of brachial) | Shaft - runs in the radial/spiral groove |
| Nutrient artery (branch of brachial or its branches) | Medullary cavity of shaft |
| Anastomoses around elbow (radial recurrent, ulnar recurrent, interosseous recurrent) | Lower end of humerus |
Clinical relevance to the case:
- Nonunion of fracture can result from disrupted blood supply, inadequate immobilization, infection, or bone loss
- Fracture of surgical neck can damage axillary nerve and circumflex humeral vessels
- Fracture of shaft (especially mid-shaft) can injure the radial nerve in the spiral groove → wrist drop
- Supracondylar fracture (lower end) can injure the brachial artery → Volkmann's ischemic contracture
PHYSIOLOGY [10 marks]
Q18. Clinical Scenario: 25-year-old female, dizziness, profuse sweating, rapid pulse, fatigue after outdoor sports on hot day; decreased BP, dry mucous membranes, reduced skin turgor; hypovolemia (heat exhaustion)
a. Major Mechanisms for Dissipation of Heat from Body + Role of Anterior Hypothalamus in Thermoregulation [5 marks]
Mechanisms of Heat Dissipation:
1. Radiation (60% at rest)
- Transfer of heat as infrared electromagnetic waves from body surface to environment
- Does not require direct contact
- Works when environmental temperature < body temperature
2. Evaporation (20-25% at rest; up to 80% during exercise)
- Sweating: sweat evaporates from skin surface (1 g sweat evaporating removes ~0.58 kcal)
- Insensible water loss from lungs and skin
- The ONLY mechanism when environmental temp > body temp
- Crucial in this patient's case (profuse sweating on hot day)
3. Convection
- Transfer of heat to moving air or fluid molecules at skin surface
- Enhanced by wind/fans
- Hot, still day reduces convective cooling
4. Conduction
- Direct transfer of heat to cooler objects in contact with the body
- Least important in most situations
5. Thermogenesis reduction
- Decreasing metabolic heat production (reduced muscle activity)
- Vasodilation of cutaneous vessels to bring warm blood to surface
Role of Anterior Hypothalamus in Thermoregulation:
The hypothalamus is the thermostat of the body. The anterior hypothalamus-preoptic area (POAH) is the primary heat dissipation center.
                 ┌─────────────────────────────┐
THERMORECEPTORS  │   HYPOTHALAMUS              │
(skin + blood)   │                             │
     ↓           │  Anterior/Preoptic = COOLING │
Core temp > 37°C →→ CENTER                     │
                 │         ↓                   │
                 │  • Inhibits posterior        │
                 │    (heat conservation)       │
                 │         ↓                   │
                 └─────────────────────────────┘
                           ↓
              Heat Dissipation Responses:
              • ↑ Sweating (cholinergic innervation)
              • Cutaneous vasodilation (↑ blood flow to skin)
              • Behavioral responses (seek cool environment)
              • Inhibition of shivering
              • Tachycardia
              • Panting (in animals)
Fever mechanism: Pyrogens (IL-1, IL-6, TNF-α) → stimulate PGE₂ synthesis in POAH → raises the set-point of thermostat → body feels "cold" despite normal/elevated temperature → shivering, vasoconstriction until new set-point reached.
Posterior hypothalamus = heat conservation center (shivering, vasoconstriction).
In this patient: Heat exhaustion - the thermoregulatory mechanisms (sweating, vasodilation) failed to keep up with heat gain → hypovolemia from excessive sweating → ↓ BP, ↑ pulse.
Q19. Clinical Scenario: 50-year-old patient, MSA (multiple system atrophy), urinary incontinence, constipation, orthostatic hypotension; impaired bladder/bowel control
a. Fight or Flight Response in ANS [2 marks]
The Fight or Flight (Sympathoadrenal) response is a whole-body stress response mediated by the sympathetic nervous system and adrenal medulla, preparing the organism for immediate physical action.
Stimulus: Perceived threat/danger → processed by amygdala → activates hypothalamus
Mediators: Norepinephrine (sympathetic nerves) + Epinephrine/Adrenaline (adrenal medulla)
Physiological responses:
| System | Fight/Flight Response |
|---|
| Heart | ↑ Heart rate (β₁), ↑ Force of contraction → ↑ Cardiac output |
| Blood vessels | Vasoconstriction in skin/viscera (α₁); Vasodilation in skeletal muscle (β₂) → blood redirected to muscles |
| Lungs | Bronchodilation (β₂) → ↑ O₂ intake |
| Eyes | Pupil dilation (mydriasis) - α₁ → improved vision |
| Liver | Glycogenolysis (β₂) → ↑ blood glucose |
| Adipose | Lipolysis → ↑ free fatty acids (energy) |
| GI tract | ↓ Peristalsis, sphincter contraction (α₁) - digestion is non-essential |
| Bladder | Relaxation of detrusor (β₃); sphincter contraction (α₁) - urinary retention |
| Sweat glands | Sweating (cholinergic sympathetic) |
| Adrenal medulla | Releases epinephrine and norepinephrine (amplifies the response) |
Neurotransmitter: Preganglionic = ACh; Postganglionic = Norepinephrine (except sweat glands = ACh)
b. Effects of Parasympathetic Stimulation on Heart, Eye, and Urinary Bladder [3 marks]
Parasympathetic = "Rest and Digest" - mediated by ACh acting on muscarinic receptors
1. Heart (M₂ receptors):
- ↓ Heart rate (negative chronotropy) - via hyperpolarization of SA node (↑ K⁺ conductance)
- ↓ AV node conduction velocity (negative dromotropy) - can cause AV block in excess
- ↓ Atrial contractility (minor effect on ventricles)
- Net effect: Bradycardia and ↓ Blood pressure
2. Eye:
- Sphincter pupillae contraction → Miosis (pupil constriction) - mediated by M₃
- Ciliary muscle contraction → lens becomes more convex → Accommodation for near vision (M₃)
- ↑ Aqueous humor drainage (minor)
- Note: Parasympathomimetics (pilocarpine) are used in glaucoma to reduce intraocular pressure
3. Urinary Bladder (M₂, M₃ receptors):
- Detrusor muscle contraction (M₃) → contracts the bladder wall → promotes micturition
- Internal urethral sphincter relaxation (M₃) → allows urine flow
- Net effect: Promotes urination (micturition)
Relevance to the case: In MSA, degeneration of autonomic preganglionic neurons impairs both sympathetic and parasympathetic control → urinary incontinence (lost sphincter control), constipation (lost GI parasympathetic tone), and orthostatic hypotension (lost sympathetic vasomotor control).
Summary of all questions answered:
- Q1-4: Anatomy & Biochemistry (skeletal muscle diagram, melanin, organophosphate biochemistry, carbohydrates)
- Q5-7: Microbiology (bacterial growth curve, virus classification, disease transmission modes)
- Q8-11: Pathology & Pharmacology (cellular adaptations, edema, TB vs. lepromatous leprosy, organophosphate management)
- Q12-15: Pharmacology & Physiology (beta-blockers, receptors, bioavailability, saltatory conduction)
- Q16-17: Clinical Anatomy (Turner syndrome, chromosomal disorders, humerus anatomy/blood supply)
- Q18-19: Clinical Physiology (heat dissipation/thermoregulation, fight-or-flight, parasympathetic effects)