using this diagram explain the steps of follicular development.
stages of follicular development primordial primary preantral antral preovulatory ovulation corpus luteum corpus albicans
Follicular Development (Ovarian Cycle) — Step by Step
Key labeled structures in the diagram
| Structure | Role |
|---|---|
| Zona pellucida | Glycoprotein shell around the oocyte, appears from primary follicle stage onward |
| Theca | Steroid-producing/support layer recruited around preantral follicles |
| Antrum | Fluid-filled cavity that defines antral-stage follicles |
| Granulosa cells | Nourish the oocyte, secrete follicular fluid/estrogen, later luteinize |
| Corona radiata | Granulosa cells that stay attached to the ovum at ovulation |

using this diagram explain the steps of follicular development.
Oogenesis and Follicle Development (Figure 82-3, Guyton and Hall)
Left track: Oogenesis (the oocyte itself)
- Primordial germ cell - originates outside the ovary and undergoes repeated cell divisions before birth.
- Migrates to the ovarian cortex and becomes an oogonium (primordial ovum).
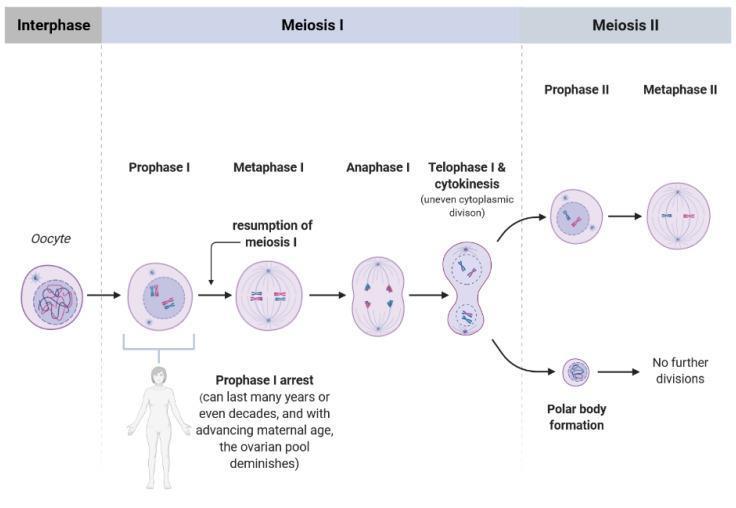
- Primary oocyte - by birth, ~1-2 million of these exist, each arrested in prophase I of meiosis. They stay frozen at this stage for years to decades.
- Meiosis I resumes each month from puberty to menopause (triggered by the LH surge), producing:
- a secondary oocyte, now arrested in metaphase II, and
- a first polar body, a tiny cell that discards half the chromosomes and simply degenerates.
- Ovulation - the secondary oocyte is released from the ovary as the ovulated secondary oocyte.
- Fertilization - if a sperm penetrates the oocyte, this triggers completion of meiosis II (this step only happens if fertilization occurs; otherwise the oocyte degenerates unfertilized).
- Meiosis II completion yields:
- a second polar body (again, discarded, degenerates), and
- the ovum (zygote) - the final fertilized egg with a complete diploid chromosome set restored.
Right track: Follicle development (the surrounding structure)
- Granulosa cells associate with the oogonium/oocyte, forming the primordial follicle (a single layer of granulosa cells around the oocyte) - this is the resting pool present from birth.
- Primary follicle - the granulosa cells proliferate into multiple layers around the oocyte.
- Preovulatory (mature) follicle - the follicle enlarges greatly, forms a fluid-filled antrum, and the oocyte with its granulosa "cumulus" sits inside it, ready for release (this stage corresponds to the earlier diagram's antral → Graafian follicle sequence, compressed here into one label).
- Ovulation - the follicle ruptures and releases the oocyte along with its adherent granulosa cell layer (drawn here as the frond-like structure feeding into the "ovulated secondary oocyte").
- Corpus luteum - the emptied follicle's remaining granulosa and theca cells transform into this yellow, hormone-secreting structure, which produces progesterone and estrogen to support the endometrium in case pregnancy occurs (and if fertilization/implantation happens, it's sustained further; if not, it degenerates as shown in the previous diagram's corpus albicans stage).
How the two tracks connect
what the hormones involved in follicular development
hormones involved in follicular development FSH LH estrogen GnRH AMH inhibin
Hormones Involved in Follicular Development
1. GnRH (Gonadotropin-Releasing Hormone) - hypothalamus
2. FSH (Follicle-Stimulating Hormone) - anterior pituitary
- Acts on granulosa cells only (FSH receptors are confined there).
- Stimulates granulosa cell proliferation, moving primordial → primary → preantral follicles.
- Induces aromatase in granulosa cells, converting theca-derived androgens into estrogen.
- Increases its own receptor number on granulosa cells (estrogen amplifies this - a positive feedback loop), which is how the dominant follicle "wins" over the other recruited follicles each month.
- FSH rises early in the cycle, peaks, then falls as the dominant follicle's rising estradiol and inhibin B suppress it - this decline is what causes the other, less FSH-sensitive follicles to become atretic.
3. LH (Luteinizing Hormone) - anterior pituitary
- Acts on theca cells (LH receptors restricted there early on), stimulating them to produce androgens (androstenedione/testosterone) as substrate for estrogen synthesis - this is the two-cell, two-gonadotropin theory: LH drives thecal androgen production, FSH drives granulosa aromatization of that androgen into estrogen.
- As the follicle matures, granulosa cells also acquire LH receptors (induced by FSH + estrogen), making the dominant follicle LH-responsive too.
- The midcycle LH surge (triggered by sustained high estradiol from the dominant follicle providing positive feedback) is the trigger for final oocyte maturation (completion of meiosis I), follicular wall rupture, and ovulation. It also luteinizes the residual granulosa/theca cells into the corpus luteum.
4. Estrogen (estradiol) - produced by follicle (granulosa cells, via theca-derived androgen substrate)
- Locally increases FSH receptor density on granulosa cells (positive feedback that favors dominant follicle selection).
- Induces LH receptors on granulosa cells.
- Systemically: low-to-moderate levels exert negative feedback on the hypothalamus/pituitary during most of the follicular phase; but once estradiol from the dominant follicle stays high (>200 pg/mL) for about 48 hours, feedback flips to positive, triggering the LH surge.
5. Inhibin (mainly inhibin B, from granulosa cells)
6. Anti-Müllerian Hormone (AMH) - from granulosa cells of preantral and small antral follicles
7. Androgens (androstenedione, testosterone) - from theca interna cells
8. Progesterone - after ovulation, from the corpus luteum
Summary flow
- Guyton and Hall, Textbook of Medical Physiology, "Ovarian Follicle Growth - The Follicular Phase of the Ovarian Cycle," p. 976-977
- Berek & Novak's Gynecology, "Two-Cell, Two-Gonadotropin Theory" and "Preovulatory Follicle" sections
- Harrison's Principles of Internal Medicine 22E, "Ovarian Steroids" (two-cell model)
- Ganong's Review of Medical Physiology, 26th ed., "Feedback Effects"
images of reproductive physiology
ovarian follicle development stages diagram
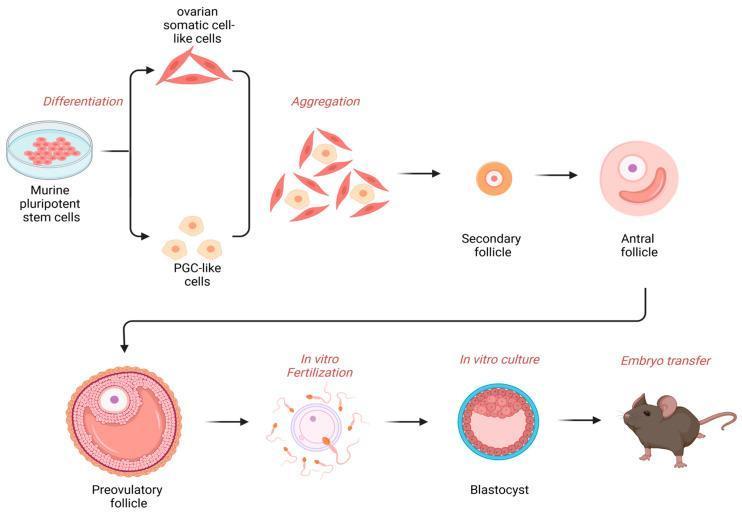
This medical diagram illustrates the experimental process for the in vitro production of functional oocytes and subsequent offspring using a murine pluripotent stem cell model. The pathway begins with the differentiation of murine pluripotent stem cells in a culture dish into two distinct lineages: spindle-shaped 'ovarian somatic cell-like cells' and rounded 'PGC-like cells' (primordial germ cell-like cells). These cells undergo 'Aggregation' to form reconstituted ovarian structures. The diagram then depicts follicle development through three morphological stages: the Secondary follicle, Antral follicle (showing a developing cavity), and the mature Preovulatory follicle (Graafian follicle) with visible granulosa layers, antrum, and oocyte. The process concludes with 'In vitro Fertilization' (IVF) by sperm, 'In vitro culture' of the resulting zygote until it reaches the Blastocyst stage, and finally 'Embryo transfer' into a surrogate mouse. This flowchart summarizes key milestones in reproductive biotechnology and developmental biology, highlighting the potential for generating gametes from stem cells.
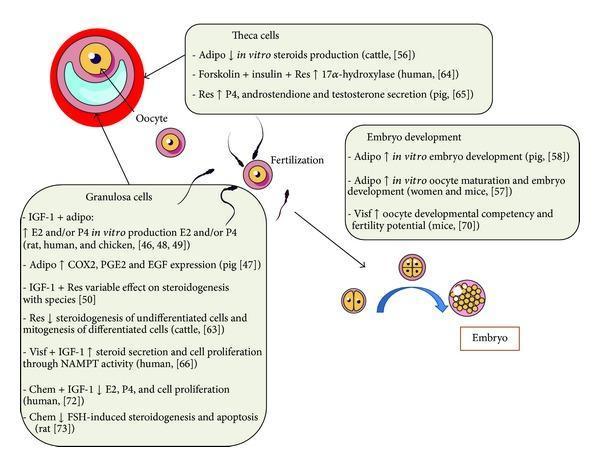
An educational medical diagram illustrating the endocrine effects of adipokines (adiponectin, resistin, visfatin, and chemerin) on ovarian cell function and early embryo development. The central visual components include an oocyte within a follicle, showing specialized interactions with surrounding theca and granulosa cells. Text boxes detail signaling pathways: adiponectin (Adipo) and resistin (Res) influence steroidogenesis (E2, P4) and enzyme activity (17α-hydroxylase) in theca and granulosa cells across multiple species, including humans. A dynamic sequence depicts fertilization by sperm, followed by early cleavage stages (2-cell and 4-cell stages) leading to a multicellular embryo. The 'Embryo Development' section notes that Adipo and visfatin (Visf) enhance in vitro oocyte maturation and developmental competency. This pathophysiology diagram highlights the integration of metabolic signals (adipokines) with reproductive physiology, specifically targeting hormone secretion, cell proliferation (via IGF-1 interactions), and early embryogenesis.
menstrual cycle hormone levels FSH LH estrogen progesterone graph
hypothalamic pituitary gonadal axis diagram
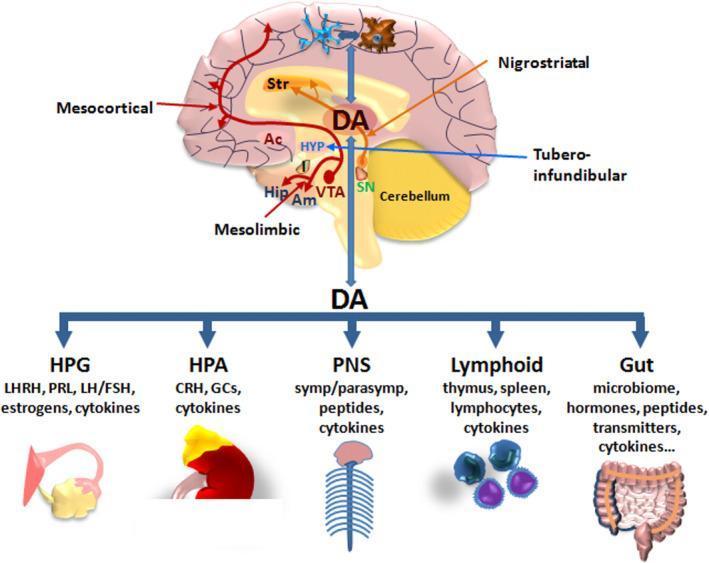
A pathophysiology diagram illustrating dopamine (DA) as a neuroendocrine-immunomodulator across central and peripheral systems. The top section presents a sagittal schematic of the human brain highlighting four major dopaminergic pathways: 1) Nigrostriatal (Substantia Nigra to Striatum), 2) Mesocortical (Ventral Tegmental Area to Prefrontal Cortex), 3) Mesolimbic (VTA to Nucleus Accumbens, Amygdala, and Hippocampus), and 4) Tuberoinfundibular (Hypothalamus). The diagram also shows bidirectional crosstalk between central DA and glial cells (astrocytes and microglia). The bottom section depicts DA's systemic influence on five key axes: the Hypothalamic-Pituitary-Gonadal (HPG) axis, the Hypothalamic-Pituitary-Adrenal (HPA) axis, the Peripheral Nervous System (PNS), the Lymphoid system (thymus, spleen, lymphocytes), and the Gut (microbiome and brain-gut axis). Each axis is accompanied by relevant mediators such as hormones (LHRH, PRL, GCs), neuropeptides, and cytokines, emphasizing the integrated role of dopamine in regulating autonomic, endocrine, and immune functions.
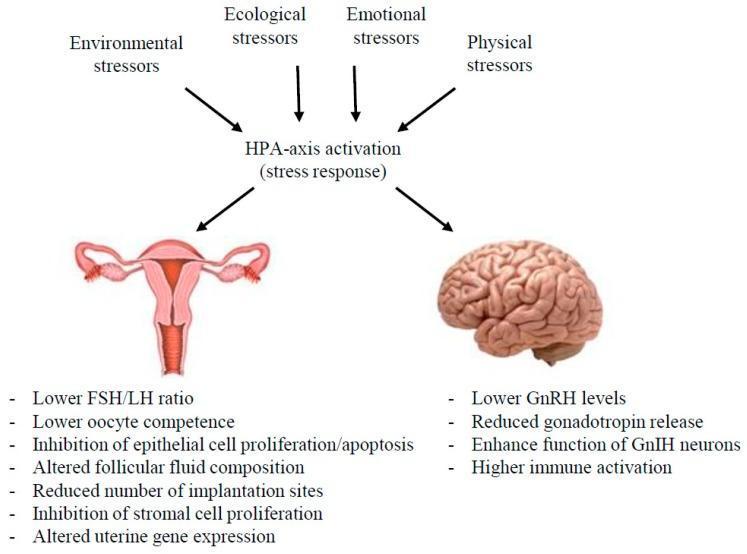
This pathophysiology diagram illustrates the systemic impact of the hypothalamic-pituitary-adrenal (HPA) axis activation on the reproductive system and neuroendocrine function. The flowchart identifies four primary categories of inputs: environmental, ecological, emotional, and physical stressors. These inputs trigger an HPA-axis stress response that negatively influences two anatomical targets: the uterus (female reproductive tract) and the brain. In the uterus, the listed consequences include physiological and cellular disruptions such as a lower FSH/LH ratio, decreased oocyte competence, inhibition of epithelial and stromal cell proliferation, altered follicular fluid composition, and reduced implantation sites. In the brain, the diagram details neuroendocrine alterations including decreased GnRH levels and gonadotropin release, enhanced function of gonadotropin-inhibitory hormone (GnIH) neurons, and elevated immune activation. The diagram highlights the clinical relevance of stress-induced hormonal dysregulation in reproductive health and fertility, emphasizing the interplay between the stress response and the hypothalamic-pituitary-gonadal (HPG) axis.
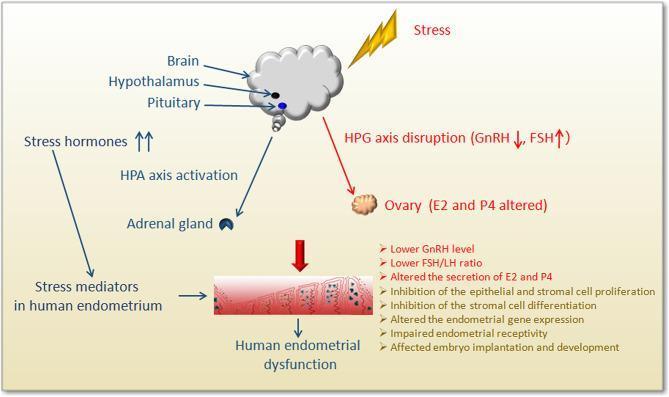
This medical pathophysiology diagram illustrates the systemic impact of stress on the female reproductive system, specifically focusing on the hypothalamic-pituitary-gonadal (HPG) and hypothalamic-pituitary-adrenal (HPA) axes and their effects on the human endometrium. The schematic shows 'Stress' triggering the brain (Hypothalamus and Pituitary), leading to HPA axis activation and adrenal gland involvement, which increases circulating stress hormones. Concurrently, HPG axis disruption occurs, characterized by decreased GnRH and increased FSH levels. These systemic changes affect the ovary, altering estradiol (E2) and progesterone (P4) secretion. The convergence of stress hormones and altered ovarian steroids leads to human endometrial dysfunction. Visible manifestations of this dysfunction include lower GnRH levels, a lower FSH/LH ratio, inhibited epithelial and stromal cell proliferation and differentiation, altered gene expression, and impaired endometrial receptivity. The diagram emphasizes how these stress-induced mechanisms collectively impair embryo implantation and development, highlighting the clinical link between psychological stress and female infertility or reproductive failure.
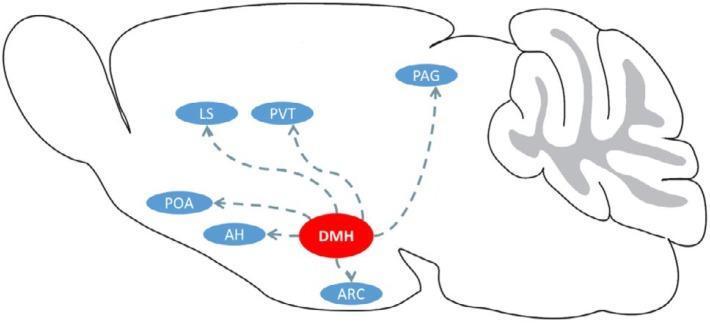
Anatomical diagram and neural pathway schematic showing the central role of the Dorsomedial Hypothalamic nucleus (DMH) in mammalian brain circuitry. The image features a simplified sagittal outline of a mammalian brain, including a detailed representation of the cerebellar folia. The DMH is highlighted as a red central hub, with dashed blue arrows indicating axonal projections or signaling pathways to several key neuroanatomical regions labeled in blue ovals. These regions include the preoptic area (POA), lateral septum (LS), paraventricular nucleus of the thalamus (PVT), periaqueductal gray (PAG), arcuate nucleus (ARC), and the anterior hypothalamus (AH). This infographic illustrates the neuroanatomical connectivity of RF-amide-related peptide (RFRP) neurons, focusing on their potential influence on reproductive regulation and the hypothalamic-pituitary-gonadal (HPG) axis. The diagram is designed for educational purposes in neurobiology and endocrinology to visualize the integrative function of the DMH in modulating physiological processes across various brain centers.
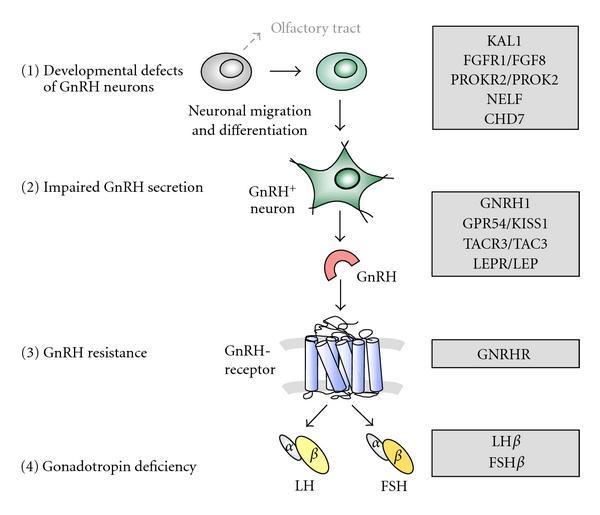
A pathophysiology diagram illustrating the four levels of genetic control and clinical defects in the hypothalamic-pituitary-gonadal axis related to pubertal development. (1) Developmental defects of GnRH neurons: depicts neuronal migration and differentiation from precursors towards the olfactory tract; associated genes include KAL1, FGFR1/FGF8, PROKR2, NELF, and CHD7. (2) Impaired GnRH secretion: shows a mature GnRH+ neuron releasing the GnRH peptide ligand; associated genes include GNRH1, GPR54 (KISS1R), TACR3, and LEPR. (3) GnRH resistance: illustrates the GnRH ligand binding to a heptahelical G protein-coupled receptor (GnRHR) embedded in the pituitary cell membrane; associated with GNRHR gene mutations. (4) Gonadotropin deficiency: shows the resulting secretion of Luteinizing Hormone (LH) and Follicle-Stimulating Hormone (FSH), each depicted as heterodimers with alpha and beta subunits; associated with LH̢̢β and FSHβ gene defects. The diagram serves as an educational tool for understanding the molecular etiology of idiopathic hypogonadotropic hypogonadism (IHH) and Kallmann syndrome.
spermatogenesis diagram seminiferous tubule
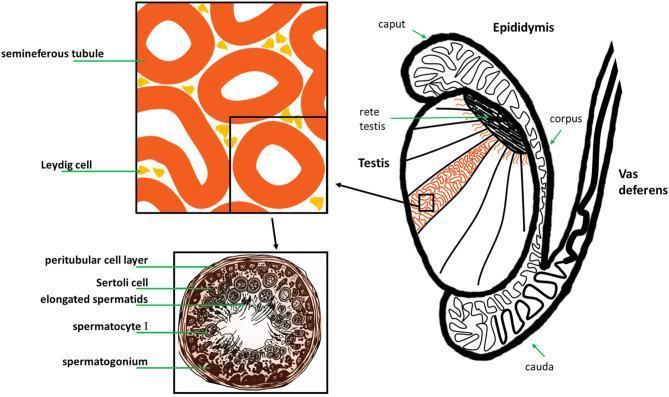
This medical illustration depicts the gross anatomy and histology of the human male reproductive system, specifically the testis and its associated ducts. The main diagram shows a sagittal-like section of the testis, highlighting internal lobules containing seminiferous tubules that converge at the rete testis. The epididymis is shown as a coiled ductal system attached to the posterior testis, divided into the caput (head), corpus (body), and cauda (tail), which then continues as the vas deferens. A magnified histological inset focuses on the interstitial space, showing Leydig cells clustered between cross-sections of seminiferous tubules. A second, high-magnification cross-section of a single seminiferous tubule illustrates the stages of spermatogenesis. Labeled structures include the peritubular cell layer (basal lamina), Sertoli cells for structural support, and germ cells in various stages of maturation: spermatogonia at the periphery, followed by spermatocytes I, and elongated spermatids positioned near the central lumen. This diagram serves as an educational tool for understanding the relationship between macroscopic anatomy and microscopic gametogenesis.

A multi-panel medical infographic illustrating the sequential stages of male reproductive function and the pharmacological impact of small molecule medications. The diagram is divided into four annotated sections linked by arrows: (A) Testicular weight, featuring a schematic of the male reproductive tract including the testes and vas deferens; (B) Testicular microenvironment, showing a cross-sectional view of a seminiferous tubule with various germ cell layers and a central lumen containing spermatozoa; (C) Spermatogenesis, a branching lineage diagram depicting the differentiation from spermatogonia through meiosis to mature spermatozoa; and (D) Sperm capacitation & Fertilization, illustrating sperm cell activation and interaction with an oocyte (egg). Each section includes an icon of a medication bottle and pills, symbolizing the points at which clinical drugs (e.g., SSRIs, antihypertensives, analgesics) can exert positive or negative effects. Panel D specifically includes a red upward arrow, signifying enhanced sperm motility or activity. This educational graphic serves as a summary of drug-induced changes in male fertility, from organ morphology to gamete function.