
ECG MBBS Level full
Reading File
The user wants a full MBBS-level ECG guide. This is a broad, visual medical topic. Let me search the library for ECG content in parallel across headings and paragraphs.
Finding Sources
Finding Sources
Good, I can see cardiology books are available. Let me search specifically in cardiology books for ECG content and also search for specific ECG topics.
Finding Sources
Finding Sources
Finding Sources
Good. Now let me read the key ECG sections from Braunwald's Heart Disease (the most authoritative cardiology textbook for MBBS level) and also get the detailed ECG content from Miller's Anesthesia and Fuster's Heart.
Reading File
Reading File
Finding Sources
Excellent! I found ECG content in Guyton & Hall (physiology), Goldman-Cecil Medicine, and Costanzo Physiology. Let me now read from the most comprehensive sources simultaneously.
Reading File
Reading File
Reading File
Excellent content! Now let me read more from Costanzo (continues QRS, ST, T) and Goldman-Cecil (intervals, axis, arrhythmias), plus fetch the ECG diagram images.
Reading File
Reading File
Loading Image
I have the beautiful ECG diagram. Now let me read the Goldman-Cecil content on intervals, leads, axis, and arrhythmias, plus Guyton's arrhythmia section.
Reading File
Reading File
Now I have very rich ECG content. Let me continue reading the Goldman-Cecil for leads, axis, hypertrophy, ischemia, and arrhythmias, plus Guyton for arrhythmias.
Reading File
Reading File
I now have all the core content needed. Let me fetch the normal 12-lead ECG image from Guyton and the leads diagram, then compile the full comprehensive answer.
Loading Image
Loading Image
I now have all the key images and content. Let me read the Goldman-Cecil content on interpretation (hypertrophy, ischemia, arrhythmias) and Guyton's arrhythmia ECG section.
Reading File
Reading File
I have excellent content from Goldman-Cecil and Guyton. Now I have enough to compile a comprehensive MBBS-level ECG guide. Let me write the full response.
ECG (Electrocardiogram) - Full MBBS Level Guide
Sources: Guyton & Hall Medical Physiology | Goldman-Cecil Medicine | Costanzo Physiology | Miller's Anesthesia | Braunwald's Heart Disease
1. What is an ECG?
The electrocardiogram (ECG or EKG) is a recording of the electrical potentials generated by the heart, detected by electrodes placed on the body surface. When a cardiac impulse passes through the heart, electrical current spreads into adjacent tissues and to the body surface. By placing electrodes at specific points, these potential differences can be amplified and recorded on calibrated paper.
- Standard recording speed: 25 mm/sec
- Each small box (1 mm) = 0.04 sec horizontally, 0.1 mV vertically
- Each large box (5 mm) = 0.2 sec horizontally, 0.5 mV vertically
- Standard paper runs for 10 seconds total
2. ECG Waveforms and What They Represent
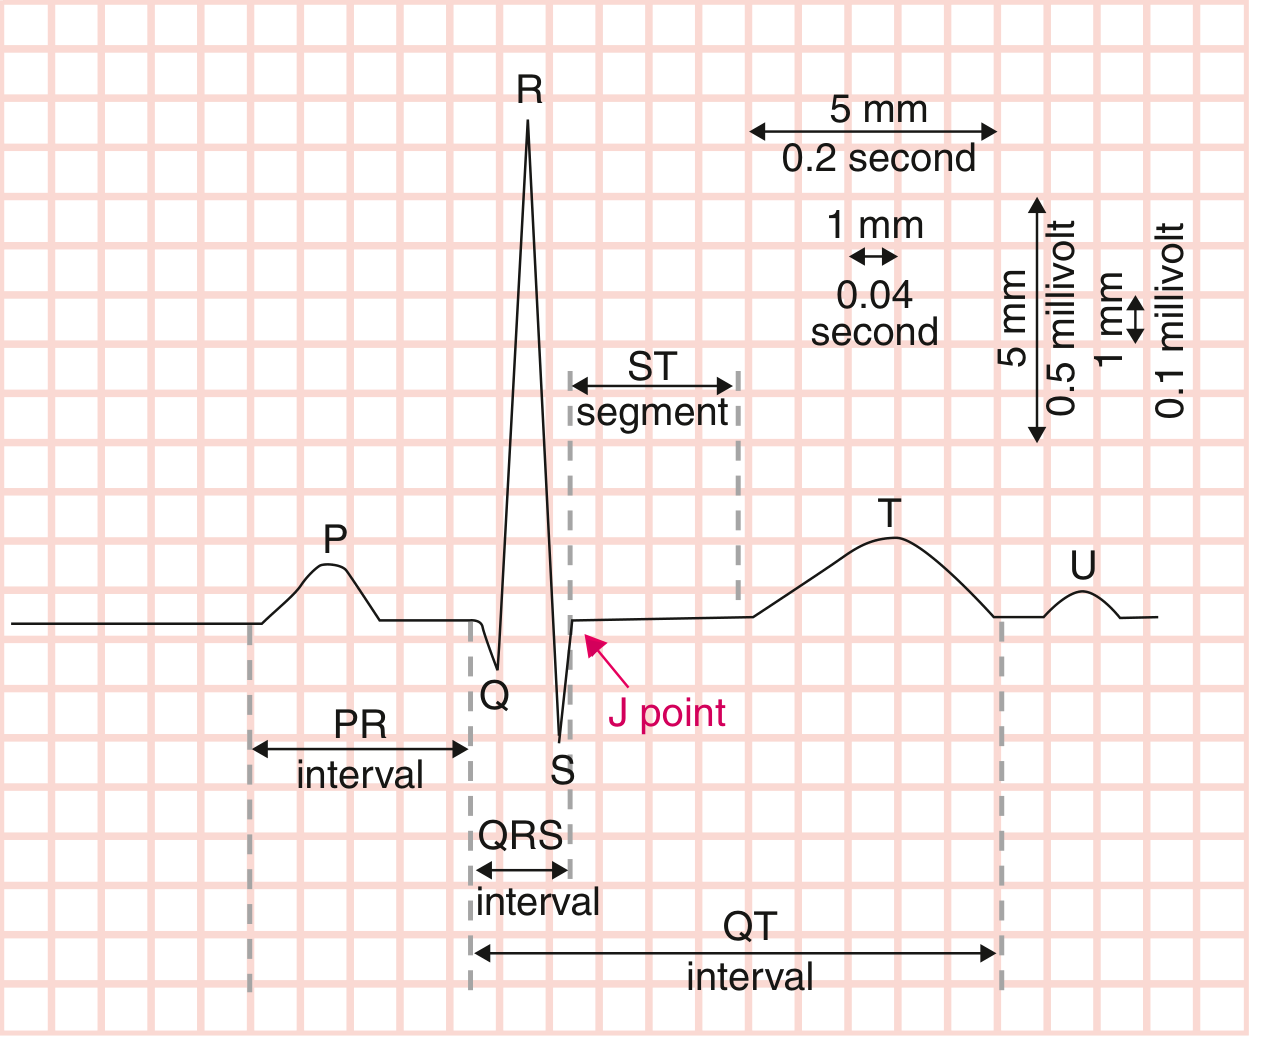
Normal ECG showing all waves and intervals - Goldman-Cecil Medicine, Fig. 42-2

ECG from Lead II - Costanzo Physiology, Fig. 4.17
The Waveforms
| Wave/Interval | Represents | Normal Duration |
|---|---|---|
| P wave | Atrial depolarization (SA node -> atria) | < 0.12 sec (120 ms) |
| PR interval | Onset of atrial depol. to onset of ventricular depol. (includes AV nodal delay) | 0.09 - 0.20 sec (90-200 ms) |
| QRS complex | Ventricular depolarization | 0.075 - 0.11 sec (75-110 ms) |
| ST segment | Isoelectric plateau of ventricular action potential (between depol. and repol.) | Isoelectric (flat) |
| T wave | Ventricular repolarization | - |
| QT interval | From start of ventricular depol. to end of repol. | QTc: males ≤ 450 ms; females ≤ 460 ms |
| U wave | Occasionally seen; thought to represent repolarization of Purkinje fibers | After T wave |
| J point | Junction of end of QRS and start of ST segment | Isoelectric |
Key rule: Intervals include the waves; segments do not. The QT interval includes QRS + ST segment + T wave. The PR interval includes the P wave + the flat PR segment.
Why is atrial repolarization not seen?
Atrial repolarization occurs during the QRS complex and is completely buried by the much larger ventricular depolarization signal. This is because ventricular mass far exceeds atrial mass. - Goldman-Cecil Medicine
QRS complex nomenclature
- Capital letters (Q, R, S) = large deflections ≥ 5 mm (0.5 mV)
- Lowercase letters (q, r, s) = small deflections < 5 mm
- Q/q waves = initial negative deflection
- R/r = positive deflection
- S/s = negative deflection following an R wave
- QS complex = entirely negative complex (no R wave at all)
3. Normal ECG Intervals (Table)
| Parameter | Normal Range |
|---|---|
| Heart rate | 50-100 beats/min |
| P wave duration | < 120 ms (< 3 small boxes) |
| PR interval | 90-200 ms |
| QRS duration | 75-110 ms |
| QTc | Males: 390-450 ms; Females: 390-460 ms |
| QRS axis | -30° to +90° |
Table 42-1, Goldman-Cecil Medicine
4. Heart Rate Calculation
Method 1 (regular rhythm): HR = 60,000 / RR interval (in ms)
Method 2 (large box method - quick memorization):
- 1 large box between R waves = 300 bpm
- 2 large boxes = 150 bpm
- 3 large boxes = 100 bpm
- 4 large boxes = 75 bpm
- 5 large boxes = 60 bpm
- 6 large boxes = 50 bpm
Method 3 (10-second strip): Count QRS complexes in 10-second ECG strip x 6 = HR/min
5. The 12 ECG Leads
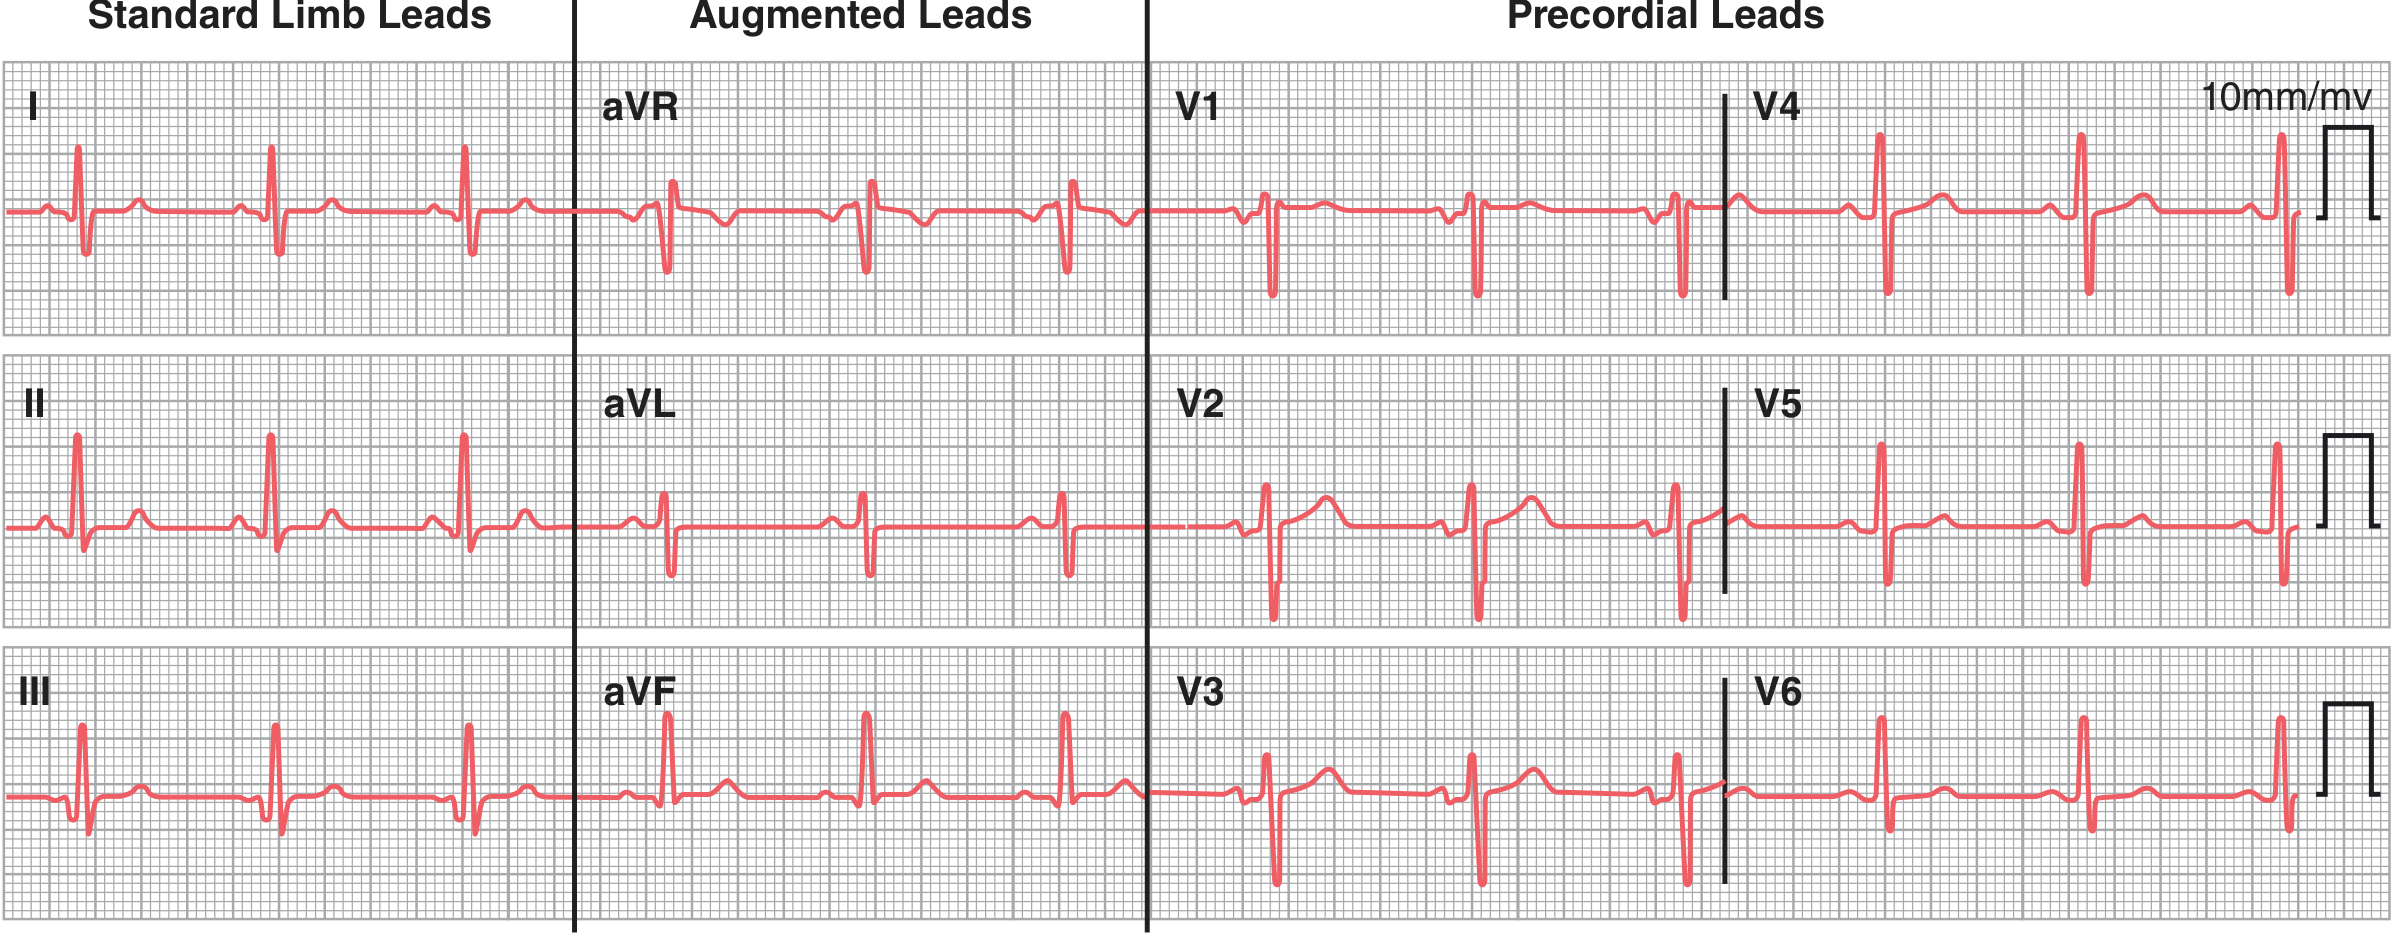
Normal 12-lead ECG - Guyton & Hall Physiology, Fig. 11.11
Bipolar Limb Leads (Standard Leads)
- Lead I: Right arm (-) vs Left arm (+). Records lateral heart wall.
- Lead II: Right arm (-) vs Left leg (+). Parallel to the long axis of the heart; best for rhythm assessment.
- Lead III: Left arm (-) vs Left leg (+).
These three form Einthoven's Triangle around the heart.
Einthoven's Law: Lead II = Lead I + Lead III (at any instant in time)
Augmented Unipolar Limb Leads
These compare one limb electrode against an average of the other two:
- aVR (augmented Voltage Right arm): P and QRS are normally negative (inverted) - looks at the heart from the right shoulder
- aVL (augmented Voltage Left arm): P wave upright; QRS may be upright or inverted
- aVF (augmented Voltage Left Foot): P wave and QRS normally positive (upright)
Precordial (Chest) Leads V1-V6
These unipolar leads use the Wilson central terminal as reference (combines RA + LA + LL). They view the heart in the horizontal/transverse plane.
| Lead | Position | Normal QRS appearance |
|---|---|---|
| V1 | 4th ICS, right sternal border | rS (small r, deep S) |
| V2 | 4th ICS, left sternal border | rS or RS |
| V3 | Between V2 and V4 | Transition zone |
| V4 | 5th ICS, midclavicular line | Transition zone (R = S) |
| V5 | Anterior axillary line | qRs (dominant R) |
| V6 | Midaxillary line | qRs (dominant R) |
R wave progression: V1 has a small r (septal activation); this R grows progressively from V1 to V5/V6 as LV depolarization dominates. Transition (where R = S) normally occurs at V3 or V4.
- Poor R wave progression (transition at V4 or later) = may suggest anterior MI or clockwise rotation.
6. Electrical Axis
The frontal plane axis describes the mean direction of ventricular depolarization in the frontal plane (range: -180° to +180°).
Normal axis: -30° to +90°
| Axis | Degree Range | Causes |
|---|---|---|
| Normal | -30° to +90° | Normal heart |
| Left axis deviation (LAD) | -30° to -90° | LBBB, LVH, left anterior fascicular block, inferior MI |
| Right axis deviation (RAD) | +90° to +180° | RVH, RBBB, lateral MI, left posterior fascicular block, dextrocardia, normal variant in children |
| Extreme/Northwest axis | -90° to -180° | Ventricular tachycardia, severe LVH |
Quick axis estimation:
- If QRS is positive in both Lead I and Lead II = normal axis
- If QRS is positive in I, negative in aVF = LAD
- If QRS is negative in I, positive in aVF = RAD
- Find the lead where QRS is most isoelectric; axis is perpendicular to that lead
7. Stepwise Approach to ECG Interpretation
A systematic MBBS-level approach (always use the same order):
- Rate - count the heart rate (regular or irregular)
- Rhythm - is it sinus rhythm? (P before every QRS, P upright in I and II)
- Axis - calculate frontal plane axis
- Intervals - measure PR, QRS, QT
- P wave - morphology, duration, axis
- QRS complex - amplitude, duration, Q waves, bundle branch blocks
- ST segment - elevation or depression
- T wave - morphology (upright/inverted/peaked)
- U wave - present or absent
- Overall interpretation - put it all together
8. Common ECG Abnormalities (MBBS Core Topics)
A. Sinus Rhythms and Rate Abnormalities
| Condition | ECG Features |
|---|---|
| Sinus tachycardia | Rate > 100/min, normal P-QRS, regular |
| Sinus bradycardia | Rate < 60/min, normal P-QRS, regular |
| Sinus arrhythmia | Irregular R-R intervals that vary with respiration; normal morphology |
B. P Wave Abnormalities
| Condition | ECG Features |
|---|---|
| Right atrial enlargement (P pulmonale) | Tall, peaked P waves in II > 2.5 mm; upright in V1 |
| Left atrial enlargement (P mitrale) | Broad, notched P waves in II > 120 ms; deep negative terminal in V1 |
| Biatrial enlargement | Combination of above |
C. PR Interval Abnormalities - AV Blocks
| Block | PR Interval | Key Feature |
|---|---|---|
| 1st degree AV block | > 200 ms (> 5 small boxes) | Every P is followed by a QRS; just prolonged PR |
| 2nd degree - Mobitz I (Wenckebach) | Progressively lengthens | Until a P wave is not conducted; then resets |
| 2nd degree - Mobitz II | Fixed, then suddenly blocked | P not followed by QRS; PR constant before dropped beat |
| 3rd degree (Complete AV block) | P and QRS completely dissociated | P waves and QRS complexes are independent; escape rhythm present |
Memory tip: 1st degree = PR prolonged but all Ps conducted. Wenckebach (Mobitz I) = "longer, longer, longer, drop" (Wenckebach's rhyme). Mobitz II = sudden drop without warning = more dangerous.
D. QRS Abnormalities - Bundle Branch Blocks
In bundle branch blocks, the QRS is ≥ 120 ms (≥ 3 small boxes = complete BBB) or 110-119 ms (incomplete BBB).
Right Bundle Branch Block (RBBB):
- Broad QRS ≥ 120 ms
- rSR' pattern ("M" pattern) in V1 (rabbit ears)
- Wide, slurred S wave in leads I and V6
- Secondary ST-T changes (ST depression, T wave inversion in V1-V3)
- Mnemonic: MaRRoW (M-shaped in V1, W-shaped in V6 for RBBB)
Left Bundle Branch Block (LBBB):
- Broad QRS ≥ 120 ms
- Broad, notched R wave ("M"-shaped) in V5, V6, I, aVL
- No septal q waves in I, V5, V6 (loss of normal septal q)
- WiLLiaM pattern: W in V1, M in V6 for LBBB
- ST elevation in V1-V3 is normal in LBBB (do not diagnose STEMI without using Sgarbossa criteria)
E. QRS Voltage Abnormalities - Hypertrophy
Left Ventricular Hypertrophy (LVH):
- Sokolow-Lyon criteria: S in V1 + R in V5 or V6 > 35 mm
- R in aVL > 11 mm
- Often with "strain pattern" = ST depression + T wave inversion in I, aVL, V5, V6
Right Ventricular Hypertrophy (RVH):
- R > S in V1 (dominant R in V1)
- Right axis deviation
- "Strain" ST depression in V1-V3
- Causes: pulmonary hypertension, mitral stenosis, cor pulmonale
Low voltage:
- QRS amplitude < 5 mm in all limb leads AND < 10 mm in all precordial leads
- Causes: pericardial effusion, obesity, emphysema, hypothyroidism, anasarca
F. Q Waves - Ischemia and Infarction
Pathological Q waves indicate myocardial infarction (necrosis/electrical silence):
- Width ≥ 0.04 sec (1 small box)
- Depth ≥ 1/4 of the R wave amplitude
| Territory | Leads with Q waves | Artery |
|---|---|---|
| Inferior MI | II, III, aVF | RCA (right coronary artery) |
| Anterior MI | V1-V4 | LAD (left anterior descending) |
| Lateral MI | I, aVL, V5, V6 | LCx (left circumflex) |
| Posterior MI | Tall R in V1 (mirror image) | RCA or LCx |
G. ST Segment Changes
ST Elevation (STEMI or pericarditis):
| Cause | Pattern |
|---|---|
| STEMI | Convex upward (tombstone) in territory; reciprocal ST depression in opposite leads |
| Pericarditis | Concave (saddle-shaped) ST elevation in ALL leads; PR depression is diagnostic |
| Early repolarization | J point elevation, mostly in young males; benign |
| LBBB | ST elevation in V1-V3 is expected (discordant) |
| Brugada syndrome | Coved or saddle-back ST elevation in V1-V2; RBBB-like pattern |
ST Depression:
| Cause | Pattern |
|---|---|
| NSTEMI/unstable angina | Horizontal or downsloping ST depression |
| Digoxin toxicity | "Reverse tick" / scooped ST depression; not necessarily toxicity |
| LVH strain | Downsloping in V5, V6, I, aVL |
| Reciprocal change | In leads opposite to STEMI territory |
H. T Wave Abnormalities
| Finding | Causes |
|---|---|
| Tall peaked T waves | Hyperkalemia (earliest sign), STEMI (hyperacute T waves) |
| T wave inversion | Ischemia, RVOT, NSTEMI, PE (V1-V4), RVH strain, LVH strain, LBBB (V1-V3), normal in aVR |
| Flat T waves | Hypokalemia, ischemia |
| Biphasic T waves | LAD ischemia (Wellens syndrome - critical LAD stenosis) |
I. QT Interval Abnormalities
Corrected QT (QTc) = QT / √(RR interval in seconds) [Bazett's formula]
-
Prolonged QTc (> 450 ms men, > 460 ms women):
- Causes: drugs (antiarrhythmics, antipsychotics, antibiotics - azithromycin, fluoroquinolones), hypokalemia, hypomagnesemia, hypocalcemia, congenital long QT syndrome, hypothermia
- Risk: Torsades de pointes (polymorphic VT that can degenerate to VF)
-
Short QTc (< 340 ms): hypercalcemia, digoxin, short QT syndrome
J. Arrhythmias
Supraventricular Arrhythmias:
| Arrhythmia | Key ECG Features |
|---|---|
| PAC (Premature Atrial Complex) | Early P wave of different morphology, followed by normal QRS |
| Paroxysmal Atrial Tachycardia (PAT) | Heart rate 150-250/min; inverted or abnormal P waves; regular; sudden onset and offset |
| Atrial Flutter | "Sawtooth" F waves at 300/min in II, III, aVF; regular QRS (2:1, 3:1, 4:1 block) |
| Atrial Fibrillation | Irregularly irregular RR intervals; absent distinct P waves; chaotic baseline (f waves); normal QRS |
| AVNRT | Narrow QRS tachycardia ~150-220/min; P waves usually hidden in QRS or just after it |
| WPW (Wolf-Parkinson-White) | Short PR < 120 ms + delta wave (slurred QRS upstroke) + wide QRS = ventricular preexcitation |
Ventricular Arrhythmias:
| Arrhythmia | Key ECG Features |
|---|---|
| PVC (Premature Ventricular Complex) | Wide, bizarre QRS (> 120 ms), no preceding P wave, compensatory pause |
| Ventricular Tachycardia (VT) | Wide QRS (> 120 ms), rate 100-250/min; AV dissociation; fusion beats; capture beats |
| Ventricular Fibrillation (VF) | Chaotic, irregular, no recognizable QRS complexes; lethal without defibrillation |
| Torsades de pointes | Polymorphic VT with twisting QRS axis; associated with prolonged QT |
Distinguishing VT from SVT with aberrancy:
- AV dissociation = VT
- Fusion beats or capture beats = VT
- Extreme right axis deviation = VT
- Concordance (all QRS deflections same direction in V1-V6) = VT
- QRS > 160 ms = more likely VT
- "If in doubt, treat as VT" - it is safer
Heart blocks (summary):
From the Goldman-Cecil Medicine section on PR intervals: 1st degree = PR > 200 ms, all conducted. 2nd degree Mobitz I (Wenckebach) = progressive PR lengthening until drop. 2nd degree Mobitz II = fixed PR with sudden dropped beats. 3rd degree = complete dissociation; if junctional escape rate 40-60/min; if ventricular escape rate 20-40/min.
9. Electrolyte Effects on ECG
| Electrolyte | ECG Changes |
|---|---|
| Hyperkalemia | Peaked T waves (earliest) -> wide QRS -> PR prolongation -> loss of P waves -> sine wave -> VF |
| Hypokalemia | Flat T waves -> U waves prominent -> ST depression -> QT prolongation -> arrhythmias |
| Hypercalcemia | Short QT interval |
| Hypocalcemia | Long QT interval (prolonged ST segment) |
| Hypermagnesemia | PR prolongation, AV block |
| Hypomagnesemia | Torsades de pointes (acts like hypokalemia) |
10. Special ECG Patterns (High Yield for MBBS)
| Pattern | Description | Significance |
|---|---|---|
| Osborn (J) wave | Positive deflection at J point | Hypothermia, hypercalcemia |
| Delta wave | Slurred upstroke of QRS | WPW syndrome (accessory pathway) |
| Epsilon wave | Small wave after QRS in V1-V3 | Arrhythmogenic right ventricular cardiomyopathy (ARVC) |
| Wellens syndrome | Biphasic or deep symmetric T inversion in V2-V3 | Critical proximal LAD stenosis |
| de Winter T waves | Upsloping ST depression + tall T waves V1-V6 | LAD occlusion (STEMI equivalent) |
| Brugada pattern | Coved ST elevation in V1-V2 + RBBB-like | Risk of sudden cardiac death |
| Sgarbossa criteria | For STEMI diagnosis in LBBB | Concordant ST elevation ≥ 1mm or ST elevation ≥ 5 mm discordant |
11. ECG in Specific Clinical Conditions
| Condition | ECG Finding |
|---|---|
| Pulmonary embolism (PE) | S1Q3T3 (S in I, Q in III, T inversion in III); sinus tachycardia is most common; RBBB; T inversion V1-V4 |
| Pericarditis | Saddle-shaped ST elevation all leads + PR depression |
| Pericardial effusion/cardiac tamponade | Low voltage + electrical alternans (alternating QRS amplitude/axis) |
| Hypothyroidism | Sinus bradycardia, low voltage, prolonged QT, flat T waves |
| Hypothermia | Bradycardia, Osborn J waves, prolonged PR/QRS/QT, shivering artifact |
| Digoxin effect | "Reverse tick" ST depression (not toxicity); PR prolongation; toxicity: AV blocks, PAT with block |
| Hypertrophic cardiomyopathy (HCM) | Deep, narrow Q waves in lateral leads (II, III, aVF, V5, V6); LVH |
| Acute STEMI | Hyperacute T -> ST elevation -> Q wave formation -> T inversion -> Q persists |
| Dextrocardia | Lead I = inverted P, QRS, T; no precordial R wave progression (V1 to V6 all negative) |
12. ECG Progression in Acute MI
The ECG evolves over time in acute MI:
- Hyperacute phase (minutes-hours): Tall, peaked (hyperacute) T waves - first change
- Acute phase (hours): ST elevation; Q waves may begin
- Evolving phase (hours-days): Q waves deepen, ST elevation begins to resolve, T wave inversion appears
- Chronic/old phase (days-weeks): Q waves persist (permanent scar), ST normalizes, T waves may normalize
13. Ambulatory ECG Monitoring
- Holter monitor: Continuous 24-48 hour recording; for palpitations, syncope, presyncope
- Event recorder: Weeks to months; patient-activated; for infrequent episodes
- Implantable loop recorder: Up to 3 years; subcutaneous implant; auto-triggered; for very rare unexplained syncope
- Mobile cardiac telemetry: Real-time transmission to a monitoring center
Quick Reference Summary Table
| Topic | Key Value/Feature |
|---|---|
| Normal HR | 50-100/min |
| Normal P wave | < 120 ms, < 2.5 mm, upright in I, II |
| Normal PR | 90-200 ms |
| Normal QRS | 75-110 ms |
| Normal QTc | ≤ 450 ms (M), ≤ 460 ms (F) |
| Normal axis | -30° to +90° |
| Positive in aVR | Abnormal (normally everything inverted) |
| Rate calculation | 300/number of large boxes |
| STEMI | Convex ST elevation + reciprocal depression |
| LBBB | WiLLiaM mnemonic (W in V1, M in V6) |
| RBBB | MaRRoW mnemonic (M in V1, W in V6) |
| VF on ECG | Chaotic, no QRS - defibrillate immediately |
| Hyperkalemia first sign | Peaked T waves |
| Hypokalemia ECG | U waves, flat T, ST depression |
Sources: Guyton & Hall Textbook of Medical Physiology, pp. 142-171 | Goldman-Cecil Medicine, Chapter 42, pp. 420-430 | Costanzo Physiology 7e, pp. 148-150 | Miller's Anesthesia 10e, p. 1364 | Braunwald's Heart Disease, p. 690
Gimme an examples of heart rate calcu.ation
Here are worked examples of all three heart rate calculation methods used in ECG:
Method 1: The Large Box Method (Quickest - use this in exams)
Rule: HR = 300 ÷ number of large boxes between two consecutive R waves
Example A
You count 4 large boxes between R waves:
HR = 300 ÷ 4 = 75 bpm ✓ Normal
Example B
You count 2 large boxes between R waves:
HR = 300 ÷ 2 = 150 bpm ✓ Tachycardia (e.g., atrial flutter with 2:1 block)
Example C
You count 6 large boxes between R waves:
HR = 300 ÷ 6 = 50 bpm ✓ Bradycardia
Memory Sequence (memorize this row):
| Large boxes | 1 | 2 | 3 | 4 | 5 | 6 |
|---|---|---|---|---|---|---|
| Heart rate | 300 | 150 | 100 | 75 | 60 | 50 |
Mnemonic: "300, 150, 100, 75, 60, 50" - just count the boxes and pick the number.
Method 2: RR Interval Formula (Most Accurate)
Rule: HR = 60,000 ÷ RR interval (in milliseconds)
Or equivalently: HR = 60 ÷ RR interval (in seconds)
Example A - Normal rhythm
RR interval = 800 ms (0.8 seconds)
HR = 60,000 ÷ 800 = 75 bpm
Cross-check with Method 1: 800 ms ÷ 200 ms (per large box) = 4 large boxes → 300 ÷ 4 = 75 ✓
Example B - Tachycardia
RR interval = 400 ms (0.4 seconds)
HR = 60,000 ÷ 400 = 150 bpm
Example C - Bradycardia
RR interval = 1200 ms (1.2 seconds)
HR = 60,000 ÷ 1200 = 50 bpm
How to measure RR in ms from paper:
- Count small boxes between two R peaks
- Multiply by 40 ms (since each small box = 0.04 sec = 40 ms)
- Example: 20 small boxes × 40 ms = 800 ms → HR = 75 bpm
Method 3: 10-Second Strip Count (Best for Irregular Rhythms - e.g., AF)
Rule: Count all QRS complexes in the 10-second strip × 6
Example A - Atrial Fibrillation
You count 11 QRS complexes in the 10-second strip:
HR = 11 × 6 = 66 bpm (controlled AF)
Example B - Irregular but fast
You count 18 QRS complexes in the strip:
HR = 18 × 6 = 108 bpm (uncontrolled AF / tachycardia)
Side-by-Side Comparison
| Scenario | RR (large boxes) | Method 1 | Method 2 (ms) | Interpretation |
|---|---|---|---|---|
| Case 1 | 3 boxes | 300÷3 = 100 | 600 ms → 100 | Upper limit normal |
| Case 2 | 4 boxes | 300÷4 = 75 | 800 ms → 75 | Normal |
| Case 3 | 5 boxes | 300÷5 = 60 | 1000 ms → 60 | Low normal |
| Case 4 | 2 boxes | 300÷2 = 150 | 400 ms → 150 | Tachycardia |
| Case 5 | 7.5 boxes | 300÷7.5 = 40 | 1500 ms → 40 | Severe bradycardia |
Exam Tip
- For regular rhythms - use the large box method (fastest)
- For irregular rhythms (atrial fibrillation) - always use the 10-second count method
- For precise calculation (e.g., checking QTc) - use the ms formula
- The RR interval in seconds is also what you plug into Bazett's formula for corrected QT: QTc = QT ÷ √(RR in seconds)
How tocountthehr and calculate the frontal plane axis
The frontal plane axis tells you the mean direction of ventricular depolarization. It's one of the most commonly tested ECG topics at MBBS level.
Searching sources...
Finding Sources
Finding Sources
Reading File
Reading File
Now let me fetch the axis diagram image from Goldman-Cecil and also get the Guyton leads diagram:
Loading Image
Loading Image
I have everything needed. Here is the full, worked guide:
Heart Rate Counting + Frontal Plane Axis Calculation
PART 1 - How to Count the Heart Rate
Step 1: Is the rhythm regular or irregular?
- Look at the R-R intervals across the strip - are they evenly spaced?
- Regular → use large box or RR formula
- Irregular (like AF) → use the 10-second count method
Method A - Large Box Method (Fastest, for regular rhythms)
Rule: HR = 300 ÷ large boxes between 2 R waves
Count large boxes (5 mm each) between the peaks of two consecutive R waves.
| Large boxes | Calculation | HR |
|---|---|---|
| 1 | 300 ÷ 1 | 300 bpm |
| 2 | 300 ÷ 2 | 150 bpm |
| 3 | 300 ÷ 3 | 100 bpm |
| 4 | 300 ÷ 4 | 75 bpm |
| 5 | 300 ÷ 5 | 60 bpm |
| 6 | 300 ÷ 6 | 50 bpm |
Memorize: "300, 150, 100, 75, 60, 50" - one number per finger on your hand, starting from 1 large box.
Worked example: R wave falls on a thick line. Next R wave is 3.5 large boxes away.
- Between 3 boxes (100 bpm) and 4 boxes (75 bpm)
- Estimate: ~85 bpm ← you can interpolate for fractional boxes
Method B - RR Interval Formula (Most precise)
HR = 60,000 ÷ RR interval in milliseconds
How to measure RR in ms:
- Count small boxes between two R peaks
- × 40 ms (each small box = 0.04 sec = 40 ms)
Worked examples:
| Small boxes (RR) | RR in ms | HR |
|---|---|---|
| 15 small boxes | 15 × 40 = 600 ms | 60,000 ÷ 600 = 100 bpm |
| 20 small boxes | 20 × 40 = 800 ms | 60,000 ÷ 800 = 75 bpm |
| 25 small boxes | 25 × 40 = 1000 ms | 60,000 ÷ 1000 = 60 bpm |
| 10 small boxes | 10 × 40 = 400 ms | 60,000 ÷ 400 = 150 bpm |
Method C - 10-Second Strip Count (For irregular rhythms)
HR = Number of QRS complexes in 10-second strip × 6
Worked example:
- You count 14 QRS complexes across the whole 10-second ECG strip
- HR = 14 × 6 = 84 bpm
Always use this method for atrial fibrillation because the RR intervals vary beat to beat - no single RR is representative.
PART 2 - How to Calculate the Frontal Plane Axis
What is the frontal plane axis?
It is the mean direction of ventricular depolarization (the QRS vector) in the frontal plane, measured in degrees. It tells you whether the electrical current through the heart is travelling in a normal direction.
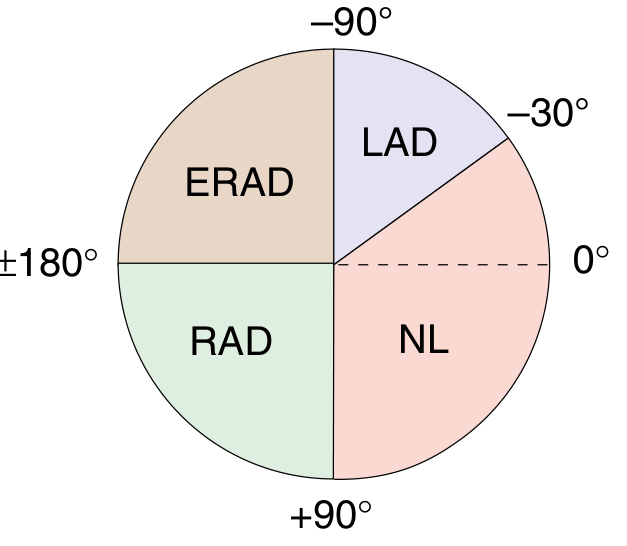
Axis quadrant diagram - Goldman-Cecil Medicine
| Zone | Degrees | Meaning |
|---|---|---|
| Normal (NL) | -30° to +90° | Normal |
| LAD (Left Axis Deviation) | -30° to -90° | Abnormal leftward |
| RAD (Right Axis Deviation) | +90° to ±180° | Abnormal rightward |
| ERAD (Extreme RAD / "No Man's Land") | -90° to ±180° | Very abnormal |
The 6 Frontal Plane Leads and Their Positions
You only use the 6 limb leads (I, II, III, aVR, aVL, aVF) for axis. Precordial leads (V1-V6) are NOT used for frontal axis.
         aVR (-150°)    -90°    aVL (-30°)
              \           |           /
               \          |          /
                \         |         /
    ±180° ------+-------- + --------+------ 0° (Lead I)
                /         |         \
               /          |          \
              /           |           \
           III (+120°)   +90°       II (+60°)
                          |
                         aVF (+90°)
Think of it as a clock face or a hexaxial reference system. Lead I points to 0°, aVF points to +90°.
Step-by-Step Axis Calculation
Quick Method (Leads I and aVF only - use in exams)
Look at the QRS complex in Lead I and Lead aVF:
| Lead I QRS | Lead aVF QRS | Axis |
|---|---|---|
| Positive (upright) | Positive (upright) | NORMAL (-30° to +90°) |
| Positive (upright) | Negative (inverted) | LAD (more negative than -30°) |
| Negative (inverted) | Positive (upright) | RAD (more positive than +90°) |
| Negative (inverted) | Negative (inverted) | ERAD / Extreme deviation |
Worked Example 1:
- Lead I: tall upright R wave (positive QRS)
- Lead aVF: upright R wave (positive QRS)
- → Normal axis ✓
Worked Example 2:
- Lead I: positive QRS
- Lead aVF: negative QRS (deep S wave dominates)
- → Left axis deviation (LAD)
Worked Example 3:
- Lead I: negative (S > R)
- Lead aVF: positive (R > S)
- → Right axis deviation (RAD)
Precise Method (using the isoelectric lead)
This gives you the exact axis in degrees:
Step 1: Find the limb lead where the QRS is most isoelectric (R wave = S wave, or the net deflection is closest to zero).
Step 2: The axis is perpendicular (90°) to that isoelectric lead.
Step 3: Look at a neighboring lead to decide which of the two perpendicular directions (180° apart) is correct - the axis points toward the lead where QRS is most positive.
Perpendicular pairs to memorize:
| Isoelectric in... | Axis is perpendicular at... |
|---|---|
| Lead I (0°) | +90° or -90° (check aVF) |
| Lead II (+60°) | -30° or +150° (check Lead I) |
| Lead III (+120°) | +30° or -150° (check Lead I) |
| aVF (+90°) | 0° or ±180° (check Lead I) |
| aVR (-150°) | -60° or +120° |
| aVL (-30°) | +60° or -120° |
Worked Example - Precise method:
Suppose:
- Lead aVF is isoelectric (R ≈ S, net = 0)
- Lead I is strongly positive
Step 1: aVF is isoelectric → axis is perpendicular to aVF = either 0° or ±180°
Step 2: Lead I is positive → axis points toward Lead I = 0°
Result: Axis = 0° (normal)
Another example:
- Lead II is isoelectric
- Lead I is deeply negative (S dominant)
Step 1: Lead II isoelectric → perpendicular = -30° or +150°
Step 2: Lead I is negative → axis points away from Lead I → axis = +150° = RAD
Causes of Axis Deviation (High Yield)
| Deviation | Common Causes |
|---|---|
| LAD | Left anterior fascicular block (most common cause of LAD), LVH, inferior MI, LBBB, WPW (type B), hyperkalaemia |
| RAD | RVH, RBBB, lateral MI, left posterior fascicular block, PE, dextrocardia, normal variant in children/thin adults |
| ERAD | Ventricular tachycardia, severe RVH, ventricular pacing, misplaced leads |
Summary Cheat Sheet
STEP 1 - Count HR:
  Regular rhythm   → 300 ÷ large boxes (or 60,000 ÷ RR ms)
  Irregular rhythm → Count QRS in 10 sec × 6

STEP 2 - Axis (quick):
  I+ aVF+ = Normal
  I+ aVF- = LAD
  I- aVF+ = RAD
  I- aVF- = Extreme RAD (no man's land)

STEP 3 - Axis (precise):
  Find isoelectric limb lead
  Axis = perpendicular to it
  Confirm direction using most positive lead
This is a shared conversation. Sign in to Orris to start your own chat.