
Describe the formation, course, relations, and clinical importance of the External Jugular Vein
external jugular vein anatomy formation course relations
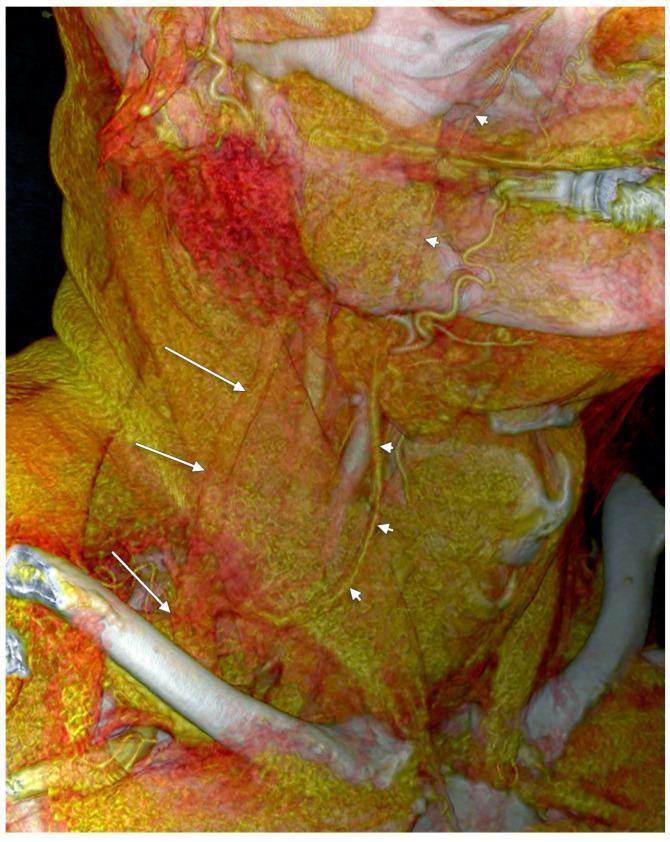
This diagnostic image is a 3D volume-rendered (3D-VR) reconstruction of a right antero-lateral view of the human neck, highlighting a vascular anatomical variant. The visualization depicts the superficial venous system in relation to the sternocleidomastoid muscle (SCM). The external jugular vein (EJV), indicated by thin white arrows, is shown descending obliquely across the surface of the SCM. A prominent facial vein, marked by white arrowheads, courses anteriorly and inferiorly across the neck. Rather than following a standard drainage pattern into the internal jugular vein, the facial vein is seen terminating as a major tributary into the lower segment of the EJV within the supraclavicular triangle. This specific configuration is classified as a 'false duplication' of the external jugular vein, as the two vessels run parallel before merging, superficially resembling a bifurcated system. The image serves as an educational resource for identifying anatomical variations in cervical venous anatomy, which is critical for surgical planning, central venous catheterization, and avoiding complications during neck dissections.
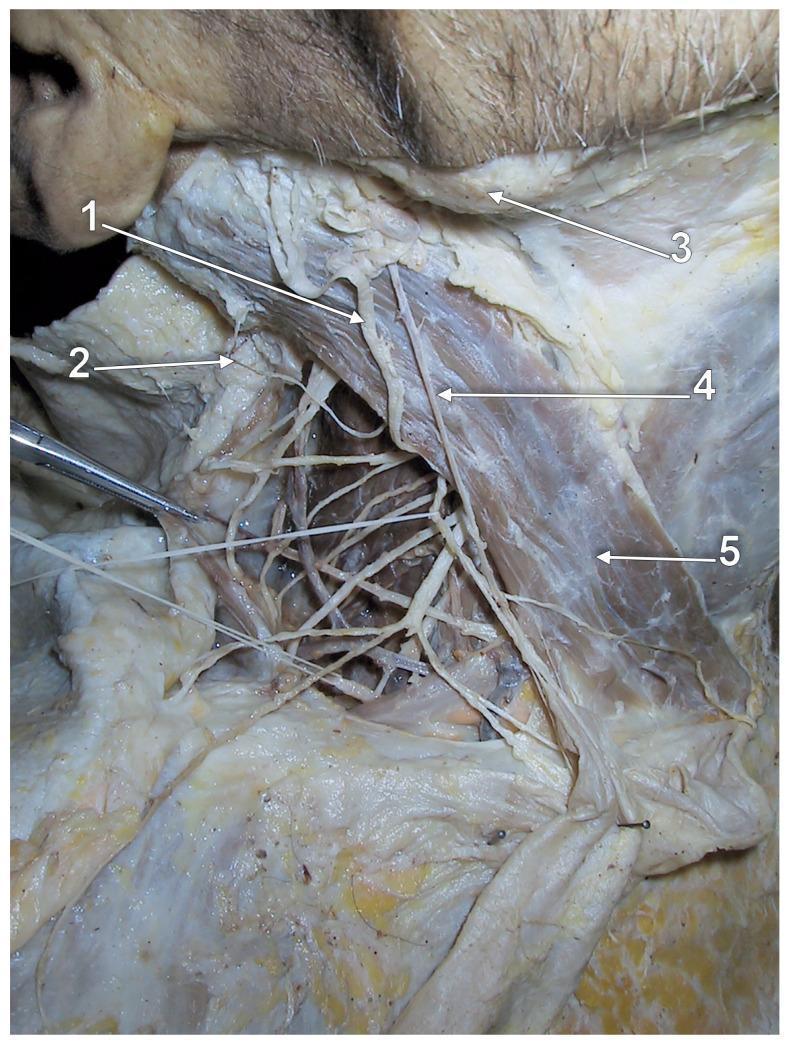
This clinical photograph displays a right-sided lateral view cadaver dissection focusing on the anatomical variations of the neck's vascular and nervous systems. The primary focus is a hypoplastic external jugular vein (labeled 4), which is characterized by a significantly reduced caliber as it courses superficially over the anterior surface of the sternocleidomastoid muscle (5). The dissection clearly illustrates the spatial relationships between this venous variant and adjacent cutaneous nerves: the greater auricular nerve (1) is seen in close proximity to the upper segment of the vein, and the lesser occipital nerve (2) is located superiorly. The angle of the mandible (3) serves as a superior anatomical landmark. This image demonstrates a common morphological variation where normal external jugular vein formation occurs with hypoplastic development, potentially requiring compensatory drainage through anastomotic vessels. This material is suitable for advanced medical education in gross anatomy, surgical planning, and radiology to recognize vascular anomalies.
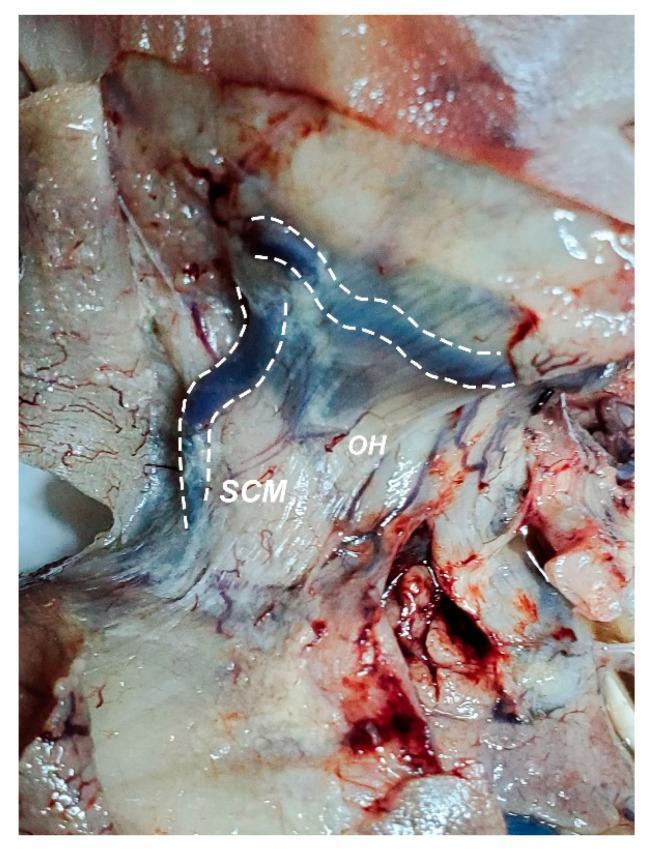
This clinical photograph shows a gross dissection of the right side of the neck in a fetal or neonatal specimen, highlighting venous abnormalities. The skin has been removed to reveal the underlying anatomy through the semi-transparent platysma muscle. Two prominent, dilated venous structures are outlined with dashed white lines: the linguo-facial trunk (vein), which follows a horizontal, sinuous course toward the mandible, and the external jugular vein, which descends vertically. Key muscular landmarks are labeled, including the sternocleidomastoid muscle (SCM) positioned laterally and the omohyoid muscle (OH) located medially. A distinct bluish coloration in the carotid triangle area indicates significant dilation of the underlying internal jugular vein. The educational focus is on the clinical presentation of cervical venous distension and its relationship to neighboring muscular structures. This specimen demonstrates a case where the linguo-facial and external jugular veins are markedly increased in caliber, reflecting potential systemic vascular congestion or congenital anomalies.
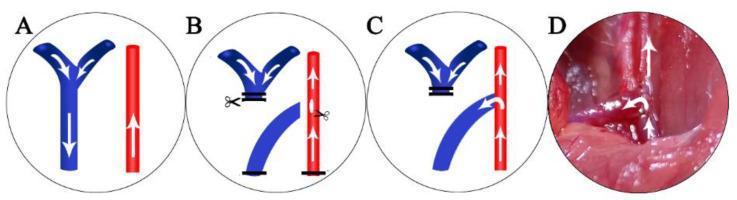
This composite image illustrates the surgical creation of an autologous arteriovenous fistula (AVF), specifically an end-of-vein to side-of-artery anastomosis. Panels A-C are schematic diagrams showing the external jugular vein (blue) and common carotid artery (red) with white arrows indicating blood flow direction. Panel A displays the initial anatomy with parallel vessels. Panel B illustrates the surgical manipulation, including the ligation and transection of the distal vein and a longitudinal arteriotomy. Panel C demonstrates the completed anastomosis with the proximal vein end sutured to the lateral wall of the artery, showing redirected arterial blood flow into the venous system. Panel D is a corresponding clinical photograph of the microsurgical procedure in a rat model, showing the moist, reddish-pink surgical site with the completed vascular connection and integrated arrows indicating post-anastomosis patency. This figure serves as an educational tool for understanding vascular surgery techniques and hemodynamics in AVF formation for hemodialysis research.
External Jugular Vein (EJV) - Complete Anatomical and Clinical Description
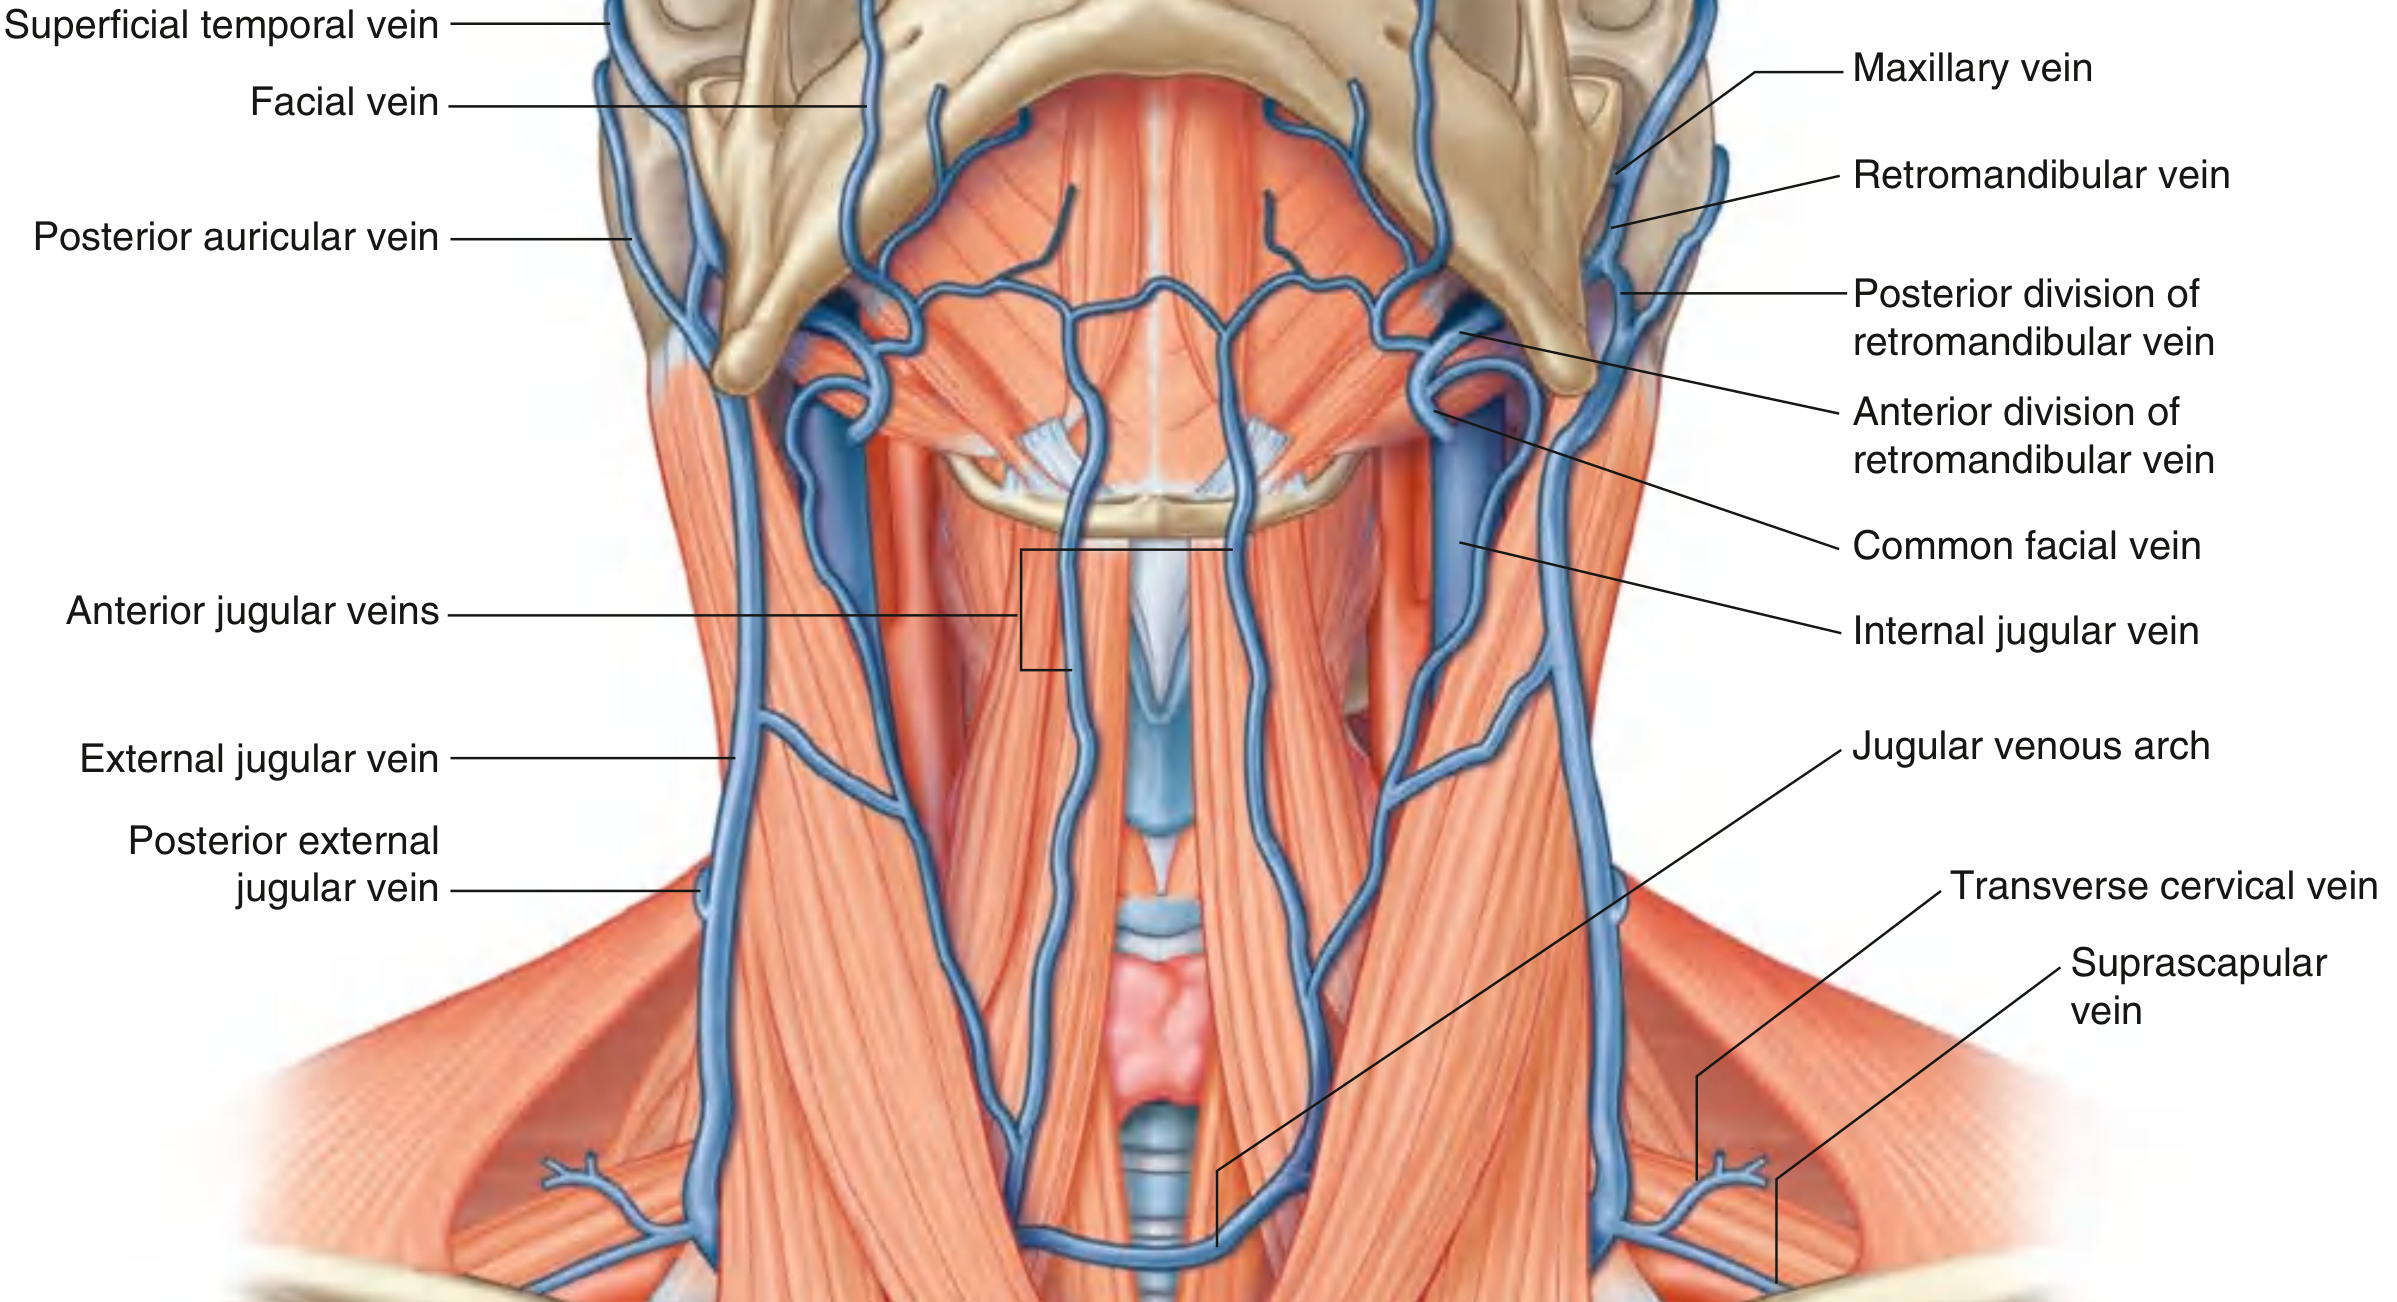
Formation
- Posterior auricular vein - drains the scalp behind and above the ear.
- Posterior division of the retromandibular vein - the retromandibular vein is itself formed within the substance of the parotid gland by the union of the superficial temporal and maxillary veins. At the angle of the mandible, the retromandibular vein divides into two divisions:
- The posterior division joins the posterior auricular vein to form the EJV.
- The anterior division joins the facial vein to form the common facial vein, which drains into the internal jugular vein.
Course
- It runs straight down the neck in the superficial fascia (subcutaneous tissue), lying superficial to the sternocleidomastoid (SCM) muscle throughout its entire course.
- It crosses the SCM diagonally (obliquely) as it descends - running from the angle of the mandible toward the middle of the clavicle.
- After crossing the SCM, it enters the posterior triangle of the neck and continues its vertical descent.
- In the lower part of the neck, just superior to the clavicle and immediately posterior to the SCM, it pierces the investing layer of the deep cervical fascia (the same fascial layer it had been lying superficial to throughout its course).
- It passes deep to the clavicle and drains into the subclavian vein (occasionally into the internal jugular vein or the junction between the two).
Relations
Superficial
- Covered by skin, subcutaneous fat, and the platysma muscle.
Deep
- Lies directly on the surface of the sternocleidomastoid muscle throughout most of its course.
- In the lower neck, as it enters the posterior triangle, it lies on the floor formed by the scalene muscles.
Lateral/Adjacent Structures
- The great auricular nerve (C2, C3) runs parallel and close to the EJV in the upper part of its course on the SCM - this nerve is at risk during EJV cannulation or neck surgery.
- The lesser occipital nerve is located superiorly near its formation.
- The accessory nerve (CN XI) crosses the posterior triangle in the vicinity of the lower part of the EJV's course.
Fascia
- It is enclosed in a fascial sheath derived from the investing layer of the deep cervical fascia. This is clinically important - when the vein is cut or torn in the lower neck where it pierces the deep fascia, the fascial attachments hold the vein walls open, creating a risk of air embolism (the vein cannot collapse).
Tributaries
| Tributary | Drainage Area |
|---|---|
| Posterior external jugular vein | Superficial areas of the back of the neck |
| Transverse cervical vein | Posterior scapular region |
| Suprascapular vein | Posterior scapular region |
| Anterior jugular vein (occasionally) | Anterior neck - usually joins subclavian directly, but may join EJV just before it enters the subclavian |
- Gray's Anatomy for Students, p. 1143-1144
Valves
Clinical Importance
1. Jugular Venous Distension (JVD) / JVP Assessment
- Right heart failure
- Cardiac tamponade (part of Beck's triad)
- Superior vena cava (SVC) obstruction - causes marked bilateral EJV engorgement plus facial edema and engorgement of the upper extremities. A JVP of 14 cm H₂O with engorged EJV and facial/upper-extremity edema is classic for SVC syndrome.
- Harrison's Principles of Internal Medicine 22e, p. 1904
2. Peripheral IV Cannulation
- Place the patient in Trendelenburg position to fill the vein.
- Rotate the head to the opposite side.
- Compress the vein just above the clavicle with a free finger to act as a tourniquet.
- Insert the cannula pointing toward the ipsilateral shoulder, midway between the angle of the jaw and the midclavicular line.
- Roberts and Hedges' Clinical Procedures in Emergency Medicine, p. 2134
3. Central Venous Catheterization (CVC)
- Converting an EJV cannula into a central line requires advancing a guidewire into the thorax, which is often technically difficult.
- The angulation of the EJV as it joins the subclavian vein makes wire advancement challenging - a small-radius J-tipped wire and exaggerated head tilt help.
- Overall, it is time-consuming and frequently fails in emergencies.
- Roberts and Hedges' Clinical Procedures in Emergency Medicine, p. 3350
4. Air Embolism Risk
- Neck surgeries (thyroid, parathyroid, neck dissection)
- Traumatic neck wounds
- Central line placement complications
5. Surgical Landmark
- Bailey and Love's Short Practice of Surgery 28th Edition; Scott-Brown's Otorhinolaryngology Head & Neck Surgery
6. Indicator of Volume Status and Cardiorespiratory Function
- Distension above the clavicle in the sitting position is always abnormal (the distance from the clavicle to the right atrium is at least 10 cm, so any visible filling at that level reflects raised central venous pressure).
- Combined with pulsus paradoxus, it helps diagnose cardiac tamponade and constrictive pericarditis.
- Prominent a waves in the venous waveform indicate reduced right ventricular compliance.
- Absence of the a wave is characteristic of atrial fibrillation.
Summary Table
| Feature | Detail |
|---|---|
| Formation | Posterior to angle of mandible; posterior auricular vein + posterior division of retromandibular vein |
| Lies in | Superficial fascia, superficial to SCM |
| Course direction | Obliquely down the neck from angle of mandible to mid-clavicle |
| Terminates | Into subclavian vein (occasionally IJV) |
| Fascia pierced | Investing layer of deep cervical fascia, near lower neck / clavicle |
| Key tributaries | Posterior external jugular, transverse cervical, suprascapular, anterior jugular (variable) |
| Valves | Two (at termination + 4 cm above clavicle); often incompetent |
| Clinical uses | JVD assessment, peripheral IV access, CVC (difficult), surgical landmark |
| Key risks | Air embolism (fascial attachments keep vein open when cut), inadvertent arterial puncture, great auricular nerve injury |
- Gray's Anatomy for Students (9780323934237), pp. 1143-1145
- Color Atlas of Human Anatomy Vol. 2 (9783132424487), p. 132
- Harrison's Principles of Internal Medicine 22e (9781265977061), p. 1904
- Roberts and Hedges' Clinical Procedures in Emergency Medicine (9780323354783), pp. 2134, 3350
- Scott-Brown's Otorhinolaryngology Head & Neck Surgery (9781138094642)
- Bailey and Love's Short Practice of Surgery 28th Edition (9780367548117)
Сегментс энд интервалс оф ИСЖ.
Segments and intervals of ECG
ECG waves segments intervals labeled diagram P wave QRS complex T wave
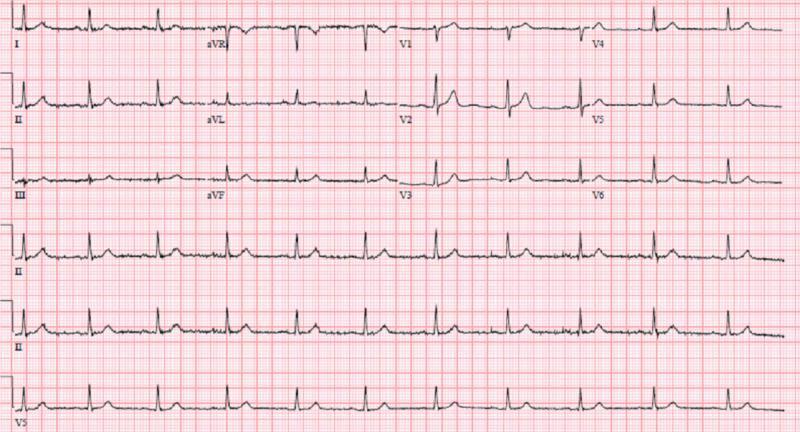
A standard 12-lead electrocardiogram (ECG) displayed on a traditional red grid background. The tracing shows a normal sinus rhythm with a regular rate and consistent R-R intervals. P waves are clearly visible preceding each QRS complex in the limb and precordial leads. The QRS complexes are of normal duration and morphology, with a standard R-wave progression observed from V1 through V6. The ST segments appear isoelectric without clear evidence of acute ST-elevation or depression in any lead. T waves are upright in most leads, with the exception of lead V1 and aVR, where inversion is a normal variant. This ECG represents a clinically stable cardiac state at the time of presentation, despite the patient's underlying severe coronary artery disease (CAD), including significant stenosis of the left anterior descending and left circumflex arteries. The absence of acute ischemic changes or pathological Q waves highlights that baseline ECGs can remain unremarkable even in the presence of severe structural heart disease.
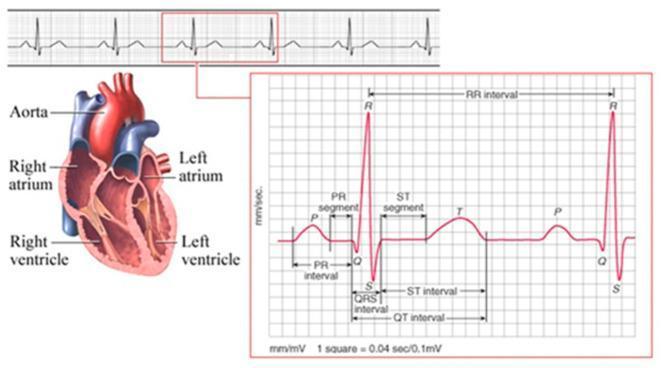
This composite educational illustration combines an anatomical diagram of the human heart with a diagnostic Electrocardiogram (ECG) tracing to demonstrate cardiac physiology. On the left, a coronal cross-section of the heart identifies the Aorta, Right Atrium, Left Atrium, Right Ventricle, and Left Ventricle. The right side features a detailed ECG waveform analysis set against a standard measurement grid (1 square = 0.04 sec / 0.1 mV). The tracing identifies key electrophysiological components: the P wave (atrial depolarization), QRS complex (ventricular depolarization), and T wave (ventricular repolarization). Critical diagnostic intervals and segments are explicitly labeled, including the PR interval, PR segment, QRS interval, ST segment, ST interval, QT interval, and the RR interval (representing the heart rate). This comparison chart and pathophysiology diagram serve as an introductory resource for understanding the correlation between cardiac anatomy and the electrical signals recorded during a cardiac cycle, suitable for basic to intermediate medical education.
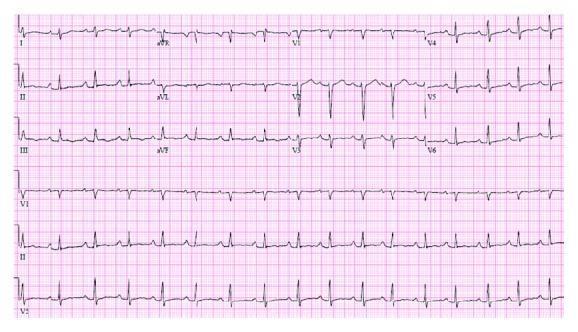
This diagnostic image is a standard 12-lead electrocardiogram (ECG) displayed on a pink grid background. The tracing demonstrates a normal sinus rhythm with a stable heart rate. Each QRS complex is preceded by a clearly visible, uniform P wave with a consistent and normal PR interval (approximately 180ms), indicating the resolution of a previously documented atrioventricular (AV) block following antibiotic treatment for Lyme carditis. The QRS complexes are narrow (<120ms), suggesting normal ventricular conduction. The ST segments are isoelectric without evidence of significant elevation or depression, and the T waves are upright and morphology-appropriate across the precordial and limb leads. The rhythm is regular with consistent R-R intervals. This ECG serves as a clinical example of cardiac conduction recovery and the return to baseline sinus rhythm after targeted therapy for infectious myocarditis or conduction system interference.
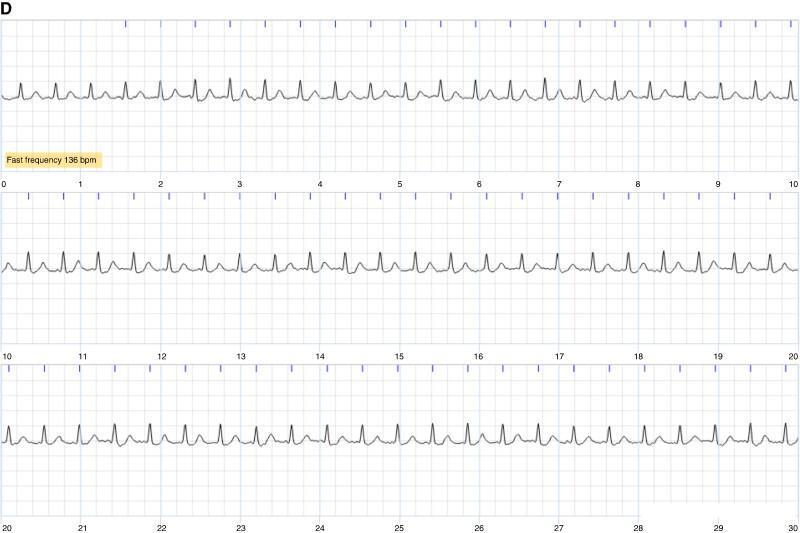
A diagnostic single-lead electrocardiogram (ECG) tracing spanning 30 seconds, organized into three 10-second strips. The tracing demonstrates a tachycardic rhythm with a labeled heart rate of 136 bpm. The QRS complexes are narrow and appear morphologically consistent throughout the recording. The R-R intervals exhibit a high degree of regularity, though subtle variations may exist. P waves are not clearly identifiable preceding each QRS complex, replaced by a baseline that suggests either atrial fibrillation (AF) or atrial tachycardia, as indicated by clinical context. The ST segments remain generally isoelectric, and the T waves follow each QRS complex with consistent polarity. This image serves as an educational tool for cardiology, illustrating the diagnostic challenge in differentiating between regular supraventricular tachycardias and atrial fibrillation when P waves are indistinct. It is suitable for medical students and clinicians focusing on cardiac electrophysiology and rhythm interpretation.
Segments and Intervals of the ECG
The ECG Waveform - Labeled Diagrams

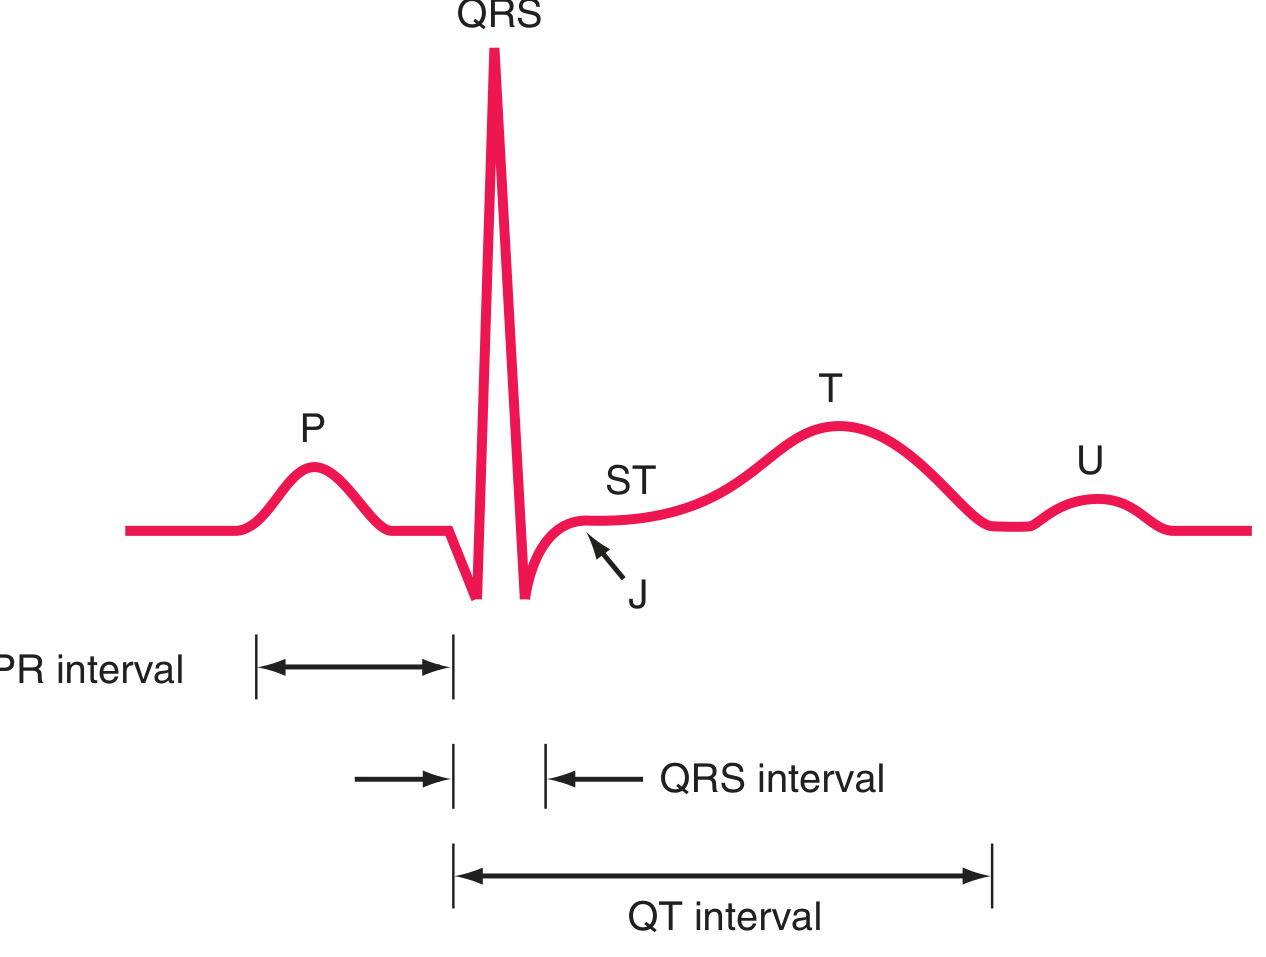
Waves - What Each Represents
| Wave | Represents | Notes |
|---|---|---|
| P wave | Atrial depolarization | Width reflects conduction time through atria. Atrial repolarization is "buried" in the QRS complex - not visible on normal ECG |
| Q wave | Initial ventricular depolarization (septal) | First negative deflection of QRS |
| R wave | Main ventricular depolarization | Largest positive deflection |
| S wave | Terminal ventricular depolarization | Negative deflection following R |
| T wave | Ventricular repolarization | Usually in same direction as QRS (concordant) |
| U wave | Late ventricular repolarization (Purkinje fibers) | Small, often absent; usually same polarity as T wave |
| J point | Junction between end of QRS and start of ST segment | Not a wave; a reference point |
SEGMENTS (flat lines between waves - do NOT include the waves)
1. PR Segment
- From: End of P wave → Beginning of QRS complex
- Represents: Conduction through the AV node (+ bundle of His)
- Normal: Isoelectric (flat on baseline)
- Duration: ~80 ms (the remainder of the PR interval after the P wave)
- Clinical use: Depressed in acute pericarditis (reciprocal to PR elevation in aVR)
2. ST Segment
- From: End of QRS complex (J point) → Beginning of T wave
- Represents: Plateau phase (phase 2) of ventricular action potential - all ventricular cells are depolarized, so no net current flows
- Normal: Isoelectric (at baseline)
- Duration: Variable (~80-120 ms at normal heart rates)
- Clinical use: The most important segment clinically:
- ST elevation → Acute MI (STEMI), pericarditis, Prinzmetal's angina, Brugada syndrome
- ST depression → Subendocardial ischemia, NSTEMI, digoxin effect, hypokalemia
INTERVALS (include the waves within them)
1. PR Interval
- From: Start of P wave → Start of QRS complex
- Includes: P wave + PR segment (AV nodal delay)
- Represents: Total time from atrial depolarization to ventricular depolarization
- Normal: 120-200 ms (3-5 small squares at 25 mm/s)
- Clinical use:
- Prolonged (>200 ms) → 1st degree AV block (parasympathetic excess, beta-blockers, calcium channel blockers, AV nodal disease)
- Short (<120 ms with delta wave) → Wolff-Parkinson-White (WPW) syndrome (pre-excitation via accessory pathway)
- Sympathetic stimulation shortens the PR interval; parasympathetic stimulation lengthens it
2. QRS Interval (QRS Duration)
- From: Start of Q wave → End of S wave
- Represents: Ventricular depolarization time; rapid spread through His-Purkinje system
- Normal: <120 ms (<3 small squares); some sources state 100-110 ms or less
- Clinical use:
- Wide QRS (>120 ms) → Bundle branch block (LBBB/RBBB), ventricular tachycardia, hyperkalemia, sodium channel blocking drugs (e.g., flecainide, tricyclics)
- Despite the larger mass of the ventricles vs. atria, QRS duration ≈ P wave duration because the His-Purkinje conduction velocity is far faster than atrial conduction
3. QT Interval
- From: Start of QRS → End of T wave
- Includes: QRS complex + ST segment + T wave
- Represents: Total duration of ventricular depolarization AND repolarization (ventricular action potential duration)
- Normal: Rate-dependent - generally <450 ms in men, <460 ms in women at normal heart rates
- Rate correction (QTc): Bazett's formula: QTc = QT ÷ √RR (in seconds). Framingham formula: QTc = QT + 0.154(1000 - RR) in ms
- Clinical use:
- Prolonged QT → Risk of Torsades de Pointes (TdP) and sudden cardiac death
- Causes: hypokalemia, hypomagnesemia, hypocalcemia, amiodarone, antipsychotics, congenital long QT syndrome
- Short QT → Hypercalcemia, digoxin effect, hereditary short QT syndrome (risk of VF)
- Prolonged QT → Risk of Torsades de Pointes (TdP) and sudden cardiac death
4. RR Interval
- From: One R wave peak → Next R wave peak
- Represents: Duration of one complete cardiac cycle
- Used to calculate heart rate: Heart rate (bpm) = 1500 ÷ (RR in mm) at 25 mm/s, or 300 ÷ (number of large squares between R waves)
Summary Table
| Feature | From → To | Includes Waves? | Represents | Normal Duration |
|---|---|---|---|---|
| PR segment | End P → Start QRS | No | AV nodal + His conduction | ~80 ms |
| ST segment | End QRS (J pt) → Start T | No | Ventricular plateau (phase 2 AP) | ~80-120 ms |
| PR interval | Start P → Start QRS | Yes (P wave) | Atrial depol + AV delay | 120-200 ms |
| QRS interval | Start Q → End S | Yes (Q, R, S) | Ventricular depolarization | <120 ms |
| QT interval | Start Q → End T | Yes (QRS + ST + T) | Ventricular depol + repol | <450 ms (men) |
| RR interval | R peak → R peak | Yes (full cycle) | One cardiac cycle | Heart rate dependent |
Relationship to Action Potential Phases
| ECG Feature | Action Potential Phase |
|---|---|
| QRS onset | Phase 0 (rapid depolarization, Na⁺ influx) |
| ST segment | Phase 2 (plateau, Ca²⁺ influx) |
| T wave | Phase 3 (rapid repolarization, K⁺ efflux) |
| Baseline after T | Phase 4 (resting potential) |
- Costanzo Physiology 7th Edition (9780323793339), p. 149
- Harrison's Principles of Internal Medicine 22e (9781265977061), p. 1912
- Medical Physiology - Boron & Boulpaep (9780323319737), p. 733