
Liquifactive necrosis
liquefactive necrosis histology brain abscess
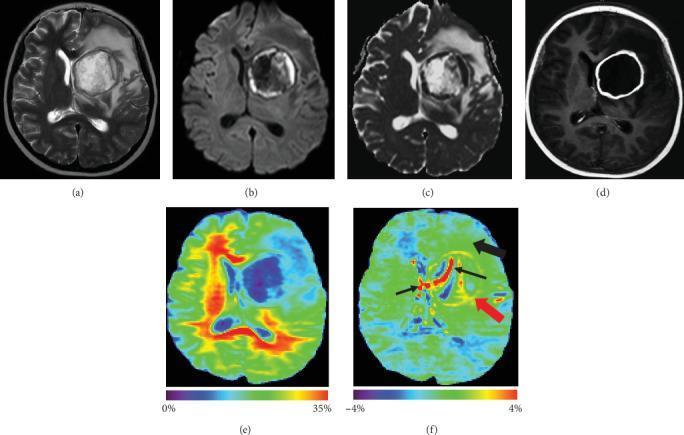
This composite of six brain MRI images demonstrates a pyogenic brain abscess in the left basal ganglia. (a) Axial T2-weighted image shows a well-defined hyperintense round lesion with significant surrounding vasogenic edema. (b) DWI and (c) ADC map illustrate restricted diffusion within the abscess cavity, characteristic of purulent material. (d) Post-contrast T1-weighted image reveals classic smooth, thin rim enhancement surrounding a non-enhancing necrotic center. (e) Magnetization Transfer Ratio (MTR) map shows low signal intensity within the enhancing rim and edematous areas. (f) Amide Proton Transfer-weighted (APTw) imaging displays a distinctive high signal (red arrow) at the gadolinium-enhancing rim, contrasting with the lower signal in the perifocal edema (black arrow). The internal liquefactive necrosis and ventricles exhibit an alternating hyper- and hypointense APTw pattern (thin black arrows). This series illustrates how advanced molecular MRI techniques like APTw can complement conventional imaging in characterizing the inflammatory environment and protein content of infectious intracranial lesions.
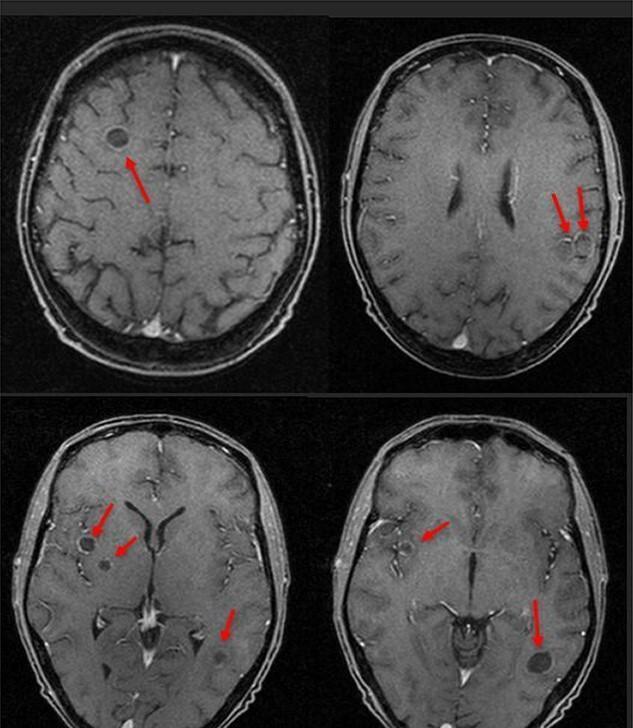
This diagnostic image displays four axial slices of a T1-weighted contrast-enhanced MRI of the brain, demonstrating multifocal intracranial lesions consistent with brain abscesses. The lesions, highlighted by red arrows, are characterized by well-circumscribed, ring-enhancing morphology with hypointense central cores, suggesting liquefactive necrosis or purulent material. The distribution is widespread and asymmetric across both hemispheres, involving the right frontal lobe, right para-ganglionic region, and bilateral temporal lobes. The presence of multiple lesions in different vascular territories is clinically significant for hematogenous dissemination, often secondary to an extracranial source of infection such as a hepatic abscess or bacteremia (e.g., Streptococcus intermedius). This image serves as a teaching tool for recognizing the radiologic presentation of septic emboli and intracranial suppuration in the context of systemic infection and new-onset seizures.
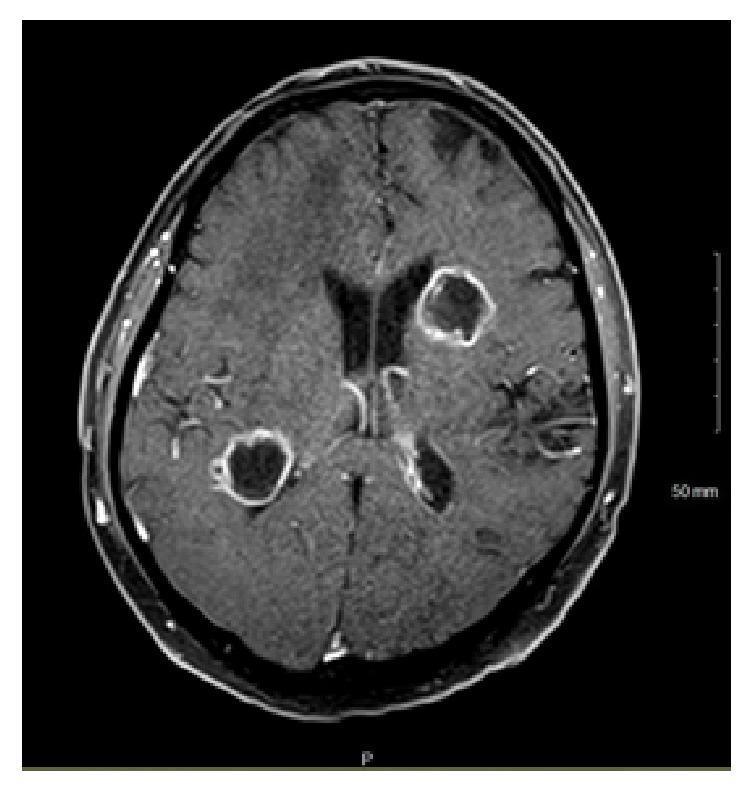
This diagnostic image is an axial T1-weighted magnetic resonance imaging (MRI) of the brain with intravenous contrast. The scan demonstrates multiple well-defined, circular to ovoid lesions within the brain parenchyma. Specifically, one prominent lesion is located in the left corona radiata, and another is visible in the right peritrigonal white matter. Both lesions exhibit characteristic peripheral ring enhancement (rim enhancement) with relatively smooth, uniform borders and central hypointensity, suggestive of liquefactive necrosis or abscess formation. There is evidence of mild perilesional edema around the enhancing margins. These findings are clinically significant in the context of opportunistic infections, such as cerebral aspergillosis or other fungal abscesses, especially in immunocompromised patients. The image serves as a teaching example of differential diagnoses for ring-enhancing intracranial lesions, which include abscesses, metastases, and glioblastoma.
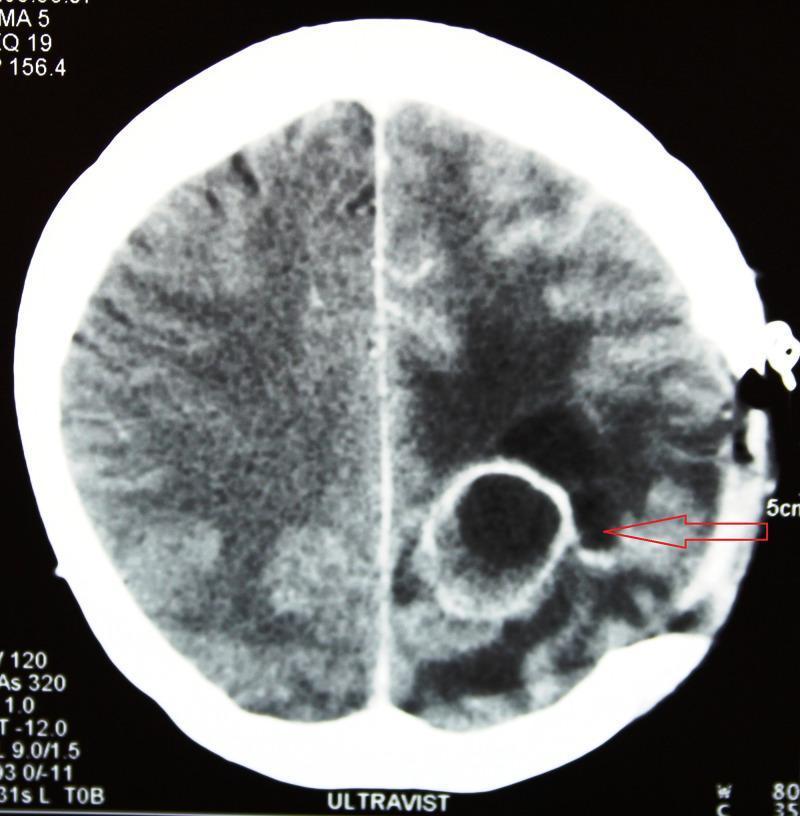
This diagnostic axial CT scan of the brain demonstrates a postoperative view of the left parieto-occipital region. The primary finding is a well-defined, ring-enhancing encapsulated lesion (indicated by a red arrow), characteristic of a recurrent or new brain abscess. The lesion features a central core of marked hypodensity, representing purulent material or liquefactive necrosis, surrounded by a dense, hyperattenuating fibrous capsule. Significant vasogenic perifocal edema is visible as an extensive, ill-defined area of low attenuation in the adjacent white matter, which results in the effacement of regional cortical sulci. Evidence of a prior craniotomy is visible on the left side of the skull vault. This image is an educational example of the radiological progression of actinomycosis or similar bacterial infections in the central nervous system, highlighting the stages of abscess encapsulation and the associated mass effect on the surrounding parenchyma.
liquefactive necrosis pathology mechanism
liquefactive necrosis brain infarct histopathology microscopy
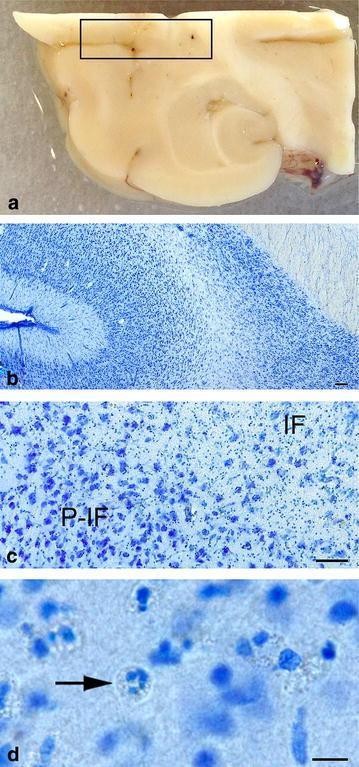
This composite figure provides a topographic and histopathological overview of an ischemic brain infarct. Panel (a) is a macroscopic clinical photograph of a brain slab (coronal section) prepared for vibratome processing; a boxed area highlights the cortical region containing the infarct and adjacent neuroparenchyma, where subtle petechial hemorrhages and dusky discoloration are visible. Panels (b-d) are light microscopy images of the boxed region stained with toluidine blue (TB) at increasing magnifications. Panel (b) shows a low-power overview of the lesion. Panel (c) distinguishes between the infarct (IF) core and the peri-infarct (P-IF) area; the IF core exhibits significant loss of neurons and glial cells with evidence of liquefactive necrosis, while the P-IF zone shows more preserved but reactive tissue. Panel (d) is a high-magnification image (10 µm scale) pinpointing a neutrophil granulocyte (arrow), identifiable by its characteristic multi-lobed nuclear morphology, infiltrating the necrotic tissue. This sequence illustrates the transition from gross pathology to cellular inflammatory response in the acute stage of cerebral ischemia.
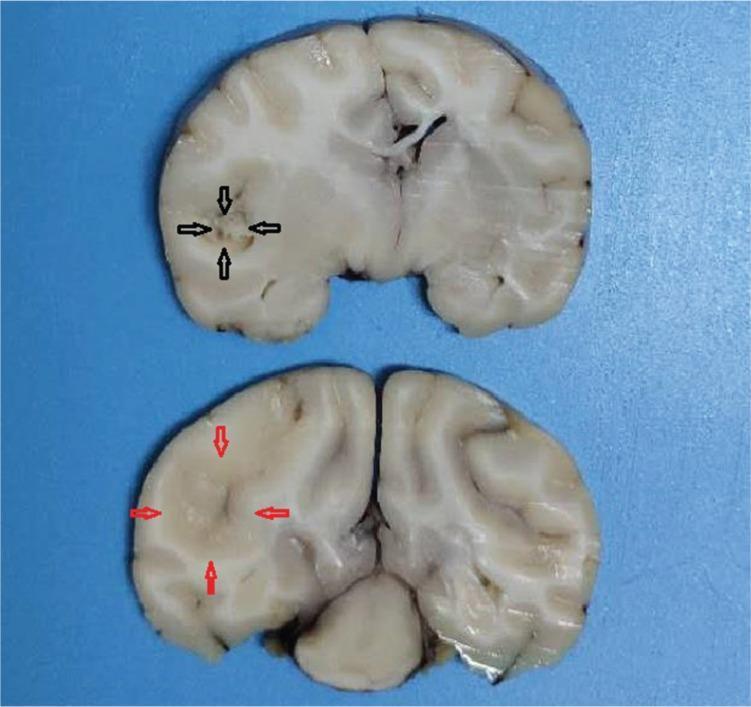
This clinical photograph displays two coronal gross pathology sections of a brain specimen, illustrating the morphological changes associated with a cerebral infarction. The sections demonstrate an area of ischemic damage localized to the territory of the middle cerebral artery (MCA). In the bottom section, red arrows delineate the boundary of the infarct lesion, which appears as a paler, fainter region with lost structural definition compared to the surrounding viable cortical and subcortical tissue. In the top section, black arrows highlight the center of the lesion, where there is clear evidence of liquefactive necrosis. This necrotic core is characterized by a more friable, darker, and fragmented texture, signifying a loss of tissue integrity. These visual markers—pallor at the boundary and central necrosis—are characteristic gross findings of subacute cerebral infarction. The specimen serves as a pathological correlation for neuroimaging findings such as high signal intensity on DWI/T2 sequences, representing the progression from initial ischemia to cellular death and structural breakdown within the brain parenchyma.
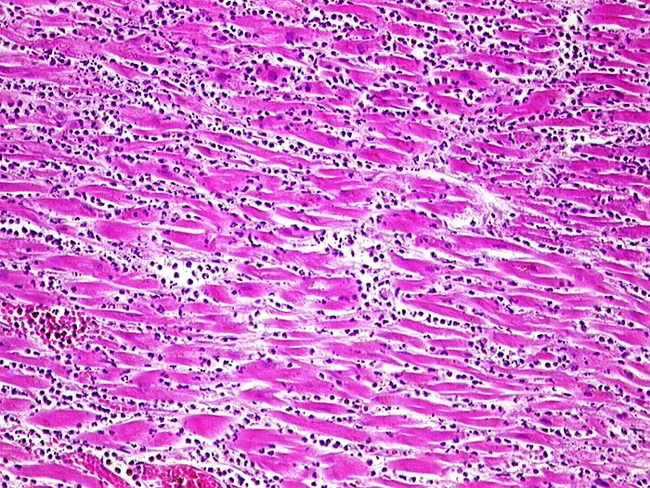
Imaging modality: Light microscopy of Hematoxylin and Eosin stained myocardial tissue from the left ventricle. This histopathology slide shows acute myocardial infarction with a pronounced inflammatory response at approximately 3-4 days age. Necrotic cardiomyocytes appear with eosinophilic, homogeneous cytoplasm and loss of nuclei, set within a pink, edematous interstitium. Surrounding the necrotic fibers is a dense neutrophilic infiltrate; small dark neutrophils with segmented nuclei are dispersed between intact fibers and around necrotic zones. Early macrophage recruitment may be evident at the infarct border as inflammation persists. Overall architecture shows patchy zones of myocyte loss, with preserved but stressed neighboring myocardium. No organized scar or fibrosis is yet apparent. The staining highlights cellular morphology and tissue organization: striated muscle fibers, cross-striations partially disrupted, and interstitial edema. Clinically, this constellation supports an infarct age of several days, with active inflammation and a high risk of mechanical complications if the infarct is transmural. The image is relevant to teaching, diagnostic pathology, and research on post-infarct healing, inflammation, and ballooning necrosis; it also aids correlation with electrocardiographic changes and serum biomarkers (troponin, CK-MB). This micrograph exemplifies stage-specific histology of myocardial infarction and underscores the importance of timing in diagnosis, prognosis, and therapy planning strategies.
Liquefactive Necrosis
Definition and Mechanism
- Hydrolytic enzymes released from lysosomes of dying cells and infiltrating leukocytes
- Recruited neutrophils and macrophages pour out proteases, lipases, and DNases that dissolve cellular constituents
- The result: tissue is converted from a solid to a semi-liquid or liquid consistency
Two Major Causes
| Context | Cause | Key Feature |
|---|---|---|
| Bacterial/fungal infections | Microbial stimulation of leukocyte accumulation | Pus formation; abscess |
| CNS ischemia (brain infarct) | Unknown / intrinsic high enzyme content of neurons | Cystic cavitation |
- Microbes stimulate massive influx of leukocytes
- Leukocyte-derived enzymes "liquefy" the tissue
- The resultant creamy yellow material is called pus (due to leukocytes + debris)
- A walled-off collection of pus = abscess
- Classic example: staphylococcal skin abscess, lung abscess, brain abscess
- Hypoxic/ischemic injury to neurons leads to liquefactive necrosis - for reasons not fully understood
- The brain is rich in phospholipids and has relatively little structural connective tissue; it has abundant hydrolytic enzymes
- The necrotic area dissolves into a fluid-filled cyst (encephalomalacia)
- This is why brain infarcts - unlike myocardial infarcts - heal as cystic cavities, not scars
Gross and Microscopic Appearance
- Soft, mushy or fluid consistency
- Bacterial: creamy yellow ("pus"), with surrounding hyperemia
- Brain: gray-yellow liquefied area that eventually becomes a fluid-filled cyst (gliotic walled cavity)
- Loss of cell outlines - cellular architecture completely obliterated
- Amorphous granular debris with no identifiable cell ghosts
- Dense neutrophilic infiltrate (in bacterial infections)
- Macrophages with foamy cytoplasm (phagocytosing lipid debris, especially in CNS)
- Fibrous capsule may form around abscess over time
Comparison with Other Necrosis Patterns
| Feature | Liquefactive | Coagulative | Caseous | Fat |
|---|---|---|---|---|
| Architecture | Destroyed | Preserved (days) | Obliterated | Partial |
| Consistency | Liquid/viscous | Firm | Friable, cheesy | Chalky/soft |
| Cause | Bacteria, CNS ischemia | Ischemia (most organs) | TB/fungi (granuloma) | Trauma, pancreatitis |
| Microscopy | No cell outlines, pus/debris | Cell ghosts, eosinophilic | Granular pink debris + granuloma | Shadowy fat cell outlines + Ca deposits |
| Leukocytes | Abundant (neutrophils) | Present later | Macrophages dominant | Macrophages + giant cells |
Clinical Examples
- Brain abscess - pyogenic bacteria (e.g., Streptococcus, Staphylococcus); ring-enhancing lesion on MRI with central liquefactive necrotic core (restricted diffusion on DWI)
- Stroke/cerebral infarction - MCA territory infarct evolves over weeks into a cystic cavity
- Lung abscess - anaerobes; cavitating lesion on CXR/CT
- Skin/subcutaneous abscess - fluctuant, pointing lesion
- Wet gangrene - secondary bacterial infection of dry gangrene converts it to liquefactive pattern
- Amoebic liver abscess - Entamoeba histolytica causes liquefactive necrosis with little inflammatory infiltrate ("anchovy sauce" pus)
- Keratomalacia - vitamin A deficiency causes liquefactive (sterile) corneal melting
Why the Brain Is an Exception to Coagulative Necrosis
- High lipid content - neurons are rich in phospholipids, susceptible to lipid peroxidation
- High enzyme content - abundant hydrolytic and phospholipid-degrading enzymes
- Low structural protein/connective tissue - less "scaffolding" to preserve architecture
- Active autolysis - rapid autolytic processes dominate
Images