
Relative risk and attributable riskpsm mbbs
relative risk attributable risk epidemiology cohort study table
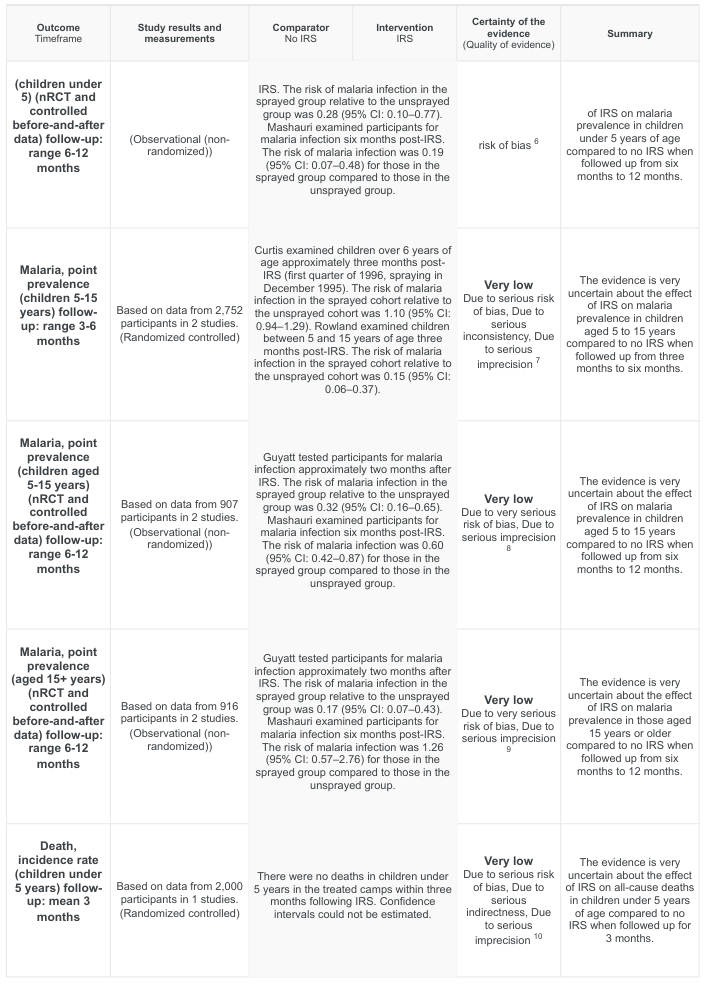
<table><thead><tr><th>Outcome Timeframe</th><th>Study results and measurements</th><th>Comparator No IRS</th><th>Intervention IRS</th><th>Certainty of the evidence (Quality of evidence)</th><th>Summary</th></tr></thead><tbody><tr><td>(children under 5) (nRCT and controlled before-and-after data) follow-up: range 6-12 months</td><td>(Observational (non-randomized))</td><td>IRS. The risk of malaria infection in the sprayed group relative to the unsprayed group was 0.28 (95% CI: 0.10–0.77). Mashauri examined participants for malaria infection six months post-IRS. The risk of malaria infection was 0.19 (95% CI: 0.07–0.48) for those in the sprayed group compared to those in the unsprayed group.</td><td></td><td>risk of bias 6</td><td>of IRS on malaria prevalence in children under 5 years of age compared to no IRS when followed up from six months to 12 months.</td></tr><tr><td>Malaria, point prevalence (children 5-15 years) follow-up: range 3-6 months</td><td>Based on data from 2,752 participants in 2 studies. (Randomized controlled)</td><td>Curtis examined children over 6 years of age approximately three months post-IRS (first quarter of 1996, spraying in December 1995). The risk of malaria infection in the sprayed cohort relative to the unsprayed cohort was 1.10 (95% CI: 0.94–1.29). Rowland examined children between 5 and 15 years of age three months post-IRS. The risk of malaria infection in the sprayed cohort relative to the unsprayed cohort was 0.15 (95% CI: 0.06–0.37).</td><td></td><td>Very low Due to serious risk of bias, Due to serious inconsistency, Due to serious imprecision 7</td><td>The evidence is very uncertain about the effect of IRS on malaria prevalence in children aged 5 to 15 years compared to no IRS when followed up from three months to six months.</td></tr><tr><td>Malaria, point prevalence (children aged 5-15 years) (nRCT and controlled before-and-after data) follow-up: range 6-12 months</td><td>Based on data from 907 participants in 2 studies. (Observational (non-randomized))</td><td>Guyatt tested participants for malaria infection approximately two months after IRS. The risk of malaria infection in the sprayed group relative to the unsprayed group was 0.32 (95% CI: 0.19–0.55). Mashauri examined participants for malaria infection six months post-IRS. The risk of malaria infection was 0.60 (95% CI: 0.42–0.87) for those in the sprayed group compared to those in the unsprayed group.</td><td></td><td>Very low Due to very serious risk of bias, Due to serious imprecision 8</td><td>The evidence is very uncertain about the effect of IRS on malaria prevalence in children aged 5 to 15 years compared to no IRS when followed up from six months to 12 months.</td></tr><tr><td>Malaria, point prevalence (aged 15+ years) (nRCT and controlled before-and-after data) follow-up: range 6-12 months</td><td>Based on data from 916 participants in 2 studies. (Observational (non-randomized))</td><td>Guyatt tested participants for malaria infection approximately two months after IRS. The risk of malaria infection in the unsprayed group relative to the unsprayed group was 0.17 (95% CI: 0.07–0.43). Mashauri examined participants for malaria infection six months post-IRS. The risk of malaria infection was 1.26 (95% CI: 0.57–2.76) for those in the sprayed group compared to those in the unsprayed group.</td><td></td><td>Very low Due to very serious risk of bias, Due to serious imprecision 9</td><td>The evidence is very uncertain about the effect of IRS on malaria prevalence in those aged 15 years or older compared to no IRS when followed up from six months to 12 months.</td></tr><tr><td>Death, incidence rate (children under 5 years) follow-up: mean 3 months</td><td>Based on data from 2,000 participants in 1 studies. (Randomized controlled)</td><td>There were no deaths in children under 5 years in the treated camps within three months following IRS. Confidence intervals could not be estimated.</td><td></td><td>Very low Due to serious risk of bias, Due to serious indirectness, Due to serious imprecision 10</td><td>The evidence is very uncertain about the effect of IRS on all-cause deaths in children under 5 years of age compared to no IRS when followed up for 3 months.</td></tr></tbody></table>
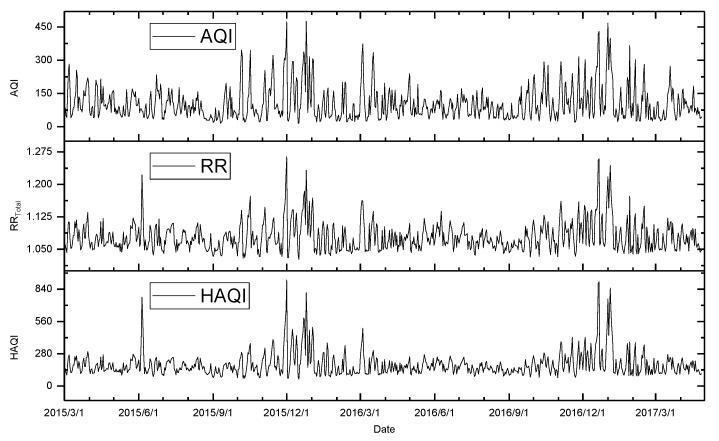
This Comparison Chart consists of three vertically aligned line graphs illustrating the relationship between air quality and human health risk over a study period from March 2015 to April 2017. The top panel displays the Air Quality Index (AQI), with values ranging from 0 to 450. The middle panel shows the Total Relative Risk (RRTotal), a clinical epidemiological measure of health hazard, fluctuating between 1.050 and 1.275. The bottom panel presents the Health-based Air Quality Index (HAQI), scaled from 0 to 840. Visually, all three curves demonstrate high synchronicity, exhibiting marked seasonal fluctuations characterized by peaks in winter months (notably December 2015 and December 2016) and valleys during summer months. The graph serves as a public health visualization tool to demonstrate how air pollution levels (AQI/HAQI) correlate with short-term clinical health risks (RRTotal). This content is relevant to environmental health, respiratory medicine, and medical epidemiology, illustrating the impact of environmental factors on population health outcomes.
![Evidentiary Table. (continued)
<table><thead><tr><th>Author & Year Published</th><th>Class of Evidence</th><th>Setting & Study Design</th><th>Methods & Outcome Measures</th><th>Results</th><th>Limitations & Comments</th></tr></thead><tbody><tr><td>Kerber et al<sup>82</sup> (2015)</td><td>III for Q4</td><td>Prospective cohort study at 1 center in Michigan; the target population was patients presenting for acute dizziness without an obvious cause who also had examination findings (ie, nystagmus [spontaneous or gaze-evoked] or imbalance when walking) that could be attributable to neurologic dysfunction</td><td>Evaluated the ability of the combination of bedside predictors of stroke—including both the ABCD2 score and the specialized OM examination-to stratify stroke risk using an MRI-based industry standard; study examinations were performed before the MRI whenever possible or blinded to the results of the MRI; OM examination was performed including a nystagmus assessment, assessment of skew deviation, and the head impulse test; primary outcome was an imaging-based definition of stroke, specifically any acute infarction or ICH on MRI as determined by a neuroradiologist</td><td>N=320 patients; stroke rate 11% in multivariable logistic regression models, ABCD2 OR 1.74 (95% CI 1.20 to 2.5); HINTS positive OR 2.82 (95% CI 0.96 to 8.30); false-negative frequency (ie, frequency of stroke in the lowest-risk categories) was as follows: ABCD2 <4, 5.1% (8/157); OM assessment, 5.9% (9/152) (4.9% [4/82], for HINTS peripheral findings); other CNS features, 7.8% (17/219); and prior stroke, 10.8% (28/260); the OM assessment was positive for a central lesion in 20 of the 29 stroke patients (69%); of the 9 stroke patients who did not have the central OM findings, 7 patients were in the no-nystagmus category (5) and/or had an acute infarction that was possibly incidental (3)</td><td>15% did not receive MRI within 14 d; physical examination was performed in a structured fashion by a study investigator, either a neurologist fellowship trained in neuro-otology or vascular neurology, or an emergency medicine physician fellowship trained in vascular neurology—not generalizable to the general EM professional population</td></tr></tbody></table>](https://cdn.orris.care/cdss_images/GLGCA_2776078_1766815823346_1d50c421-3c87-476d-89be-f19f647bce8c_13663d0f-3a66-414e-a571-18d29b8fb1f7.png)
Evidentiary Table. (continued) <table><thead><tr><th>Author & Year Published</th><th>Class of Evidence</th><th>Setting & Study Design</th><th>Methods & Outcome Measures</th><th>Results</th><th>Limitations & Comments</th></tr></thead><tbody><tr><td>Kerber et al<sup>82</sup> (2015)</td><td>III for Q4</td><td>Prospective cohort study at 1 center in Michigan; the target population was patients presenting for acute dizziness without an obvious cause who also had examination findings (ie, nystagmus [spontaneous or gaze-evoked] or imbalance when walking) that could be attributable to neurologic dysfunction</td><td>Evaluated the ability of the combination of bedside predictors of stroke—including both the ABCD2 score and the specialized OM examination-to stratify stroke risk using an MRI-based industry standard; study examinations were performed before the MRI whenever possible or blinded to the results of the MRI; OM examination was performed including a nystagmus assessment, assessment of skew deviation, and the head impulse test; primary outcome was an imaging-based definition of stroke, specifically any acute infarction or ICH on MRI as determined by a neuroradiologist</td><td>N=320 patients; stroke rate 11% in multivariable logistic regression models, ABCD2 OR 1.74 (95% CI 1.20 to 2.5); HINTS positive OR 2.82 (95% CI 0.96 to 8.30); false-negative frequency (ie, frequency of stroke in the lowest-risk categories) was as follows: ABCD2 <4, 5.1% (8/157); OM assessment, 5.9% (9/152) (4.9% [4/82], for HINTS peripheral findings); other CNS features, 7.8% (17/219); and prior stroke, 10.8% (28/260); the OM assessment was positive for a central lesion in 20 of the 29 stroke patients (69%); of the 9 stroke patients who did not have the central OM findings, 7 patients were in the no-nystagmus category (5) and/or had an acute infarction that was possibly incidental (3)</td><td>15% did not receive MRI within 14 d; physical examination was performed in a structured fashion by a study investigator, either a neurologist fellowship trained in neuro-otology or vascular neurology, or an emergency medicine physician fellowship trained in vascular neurology—not generalizable to the general EM professional population</td></tr></tbody></table>
Relative Risk and Attributable Risk
(Park's PSM - Cohort Study / Epidemiology)
Context: Where These Measures Come From
- Exposed group (e.g., smokers)
- Non-exposed group (e.g., non-smokers)
1. RELATIVE RISK (RR)
- Incidence among smokers = 10/1000
- Incidence among non-smokers = 1/1000
- RR = 10/1 = 10
Interpretation of RR:
| RR Value | Meaning |
|---|---|
| RR = 1 | No association |
| RR > 1 | Positive association (risk factor) |
| RR < 1 | Negative association (protective factor) |
| RR = 2 | 100% increase in risk among exposed |
| RR = 0.25 | 75% reduction in risk among exposed |
2. ATTRIBUTABLE RISK (AR)
Attributable Risk Percent (AR%):
3. POPULATION ATTRIBUTABLE RISK (PAR)
| Group | Deaths per 100,000/year |
|---|---|
| Heavy smokers | 224 |
| Non-smokers | 10 |
| Total population | 74 |
- Individual RR = 224/10 = 22.4
- Population AR = (74 - 10)/74 = 86%
4. RELATIVE RISK vs. ATTRIBUTABLE RISK - Key Distinction
| Feature | Relative Risk | Attributable Risk |
|---|---|---|
| Definition | Ratio of incidences | Difference of incidences |
| Purpose | Measures strength of association | Measures public health impact |
| Best used for | Aetiological research (cause-finding) | Preventive/public health programmes |
| Not affected by baseline prevalence | Yes | No - depends on background rate |
Classic Example (Oral Contraceptives & CVS Complications - Table 20):
| Age Group | Relative Risk | Attributable Risk |
|---|---|---|
| 30-39 years | 2.8 | 3.5 per 100,000 |
| 40-44 years | 2.8 | 20.0 per 100,000 |
- RR is the same across age groups - same strength of association.
- AR is 5x higher in older women - far greater absolute burden.
- This is why OCP use is not recommended in women aged 35+ - the AR (public health impact) is much higher, even though RR is the same.
Second Classic Example (Smoking - Table 21):
| Cause of Death | Smokers | Non-smokers | RR | AR% |
|---|---|---|---|---|
| Lung cancer | 0.90/1000 | 0.07/1000 | 12.86 | 92.2% |
| Coronary Heart Disease | 4.87/1000 | 4.22/1000 | 1.15 | 13.3% |
- Smoking has a very high RR for lung cancer (strong causal link).
- But for CHD, both RR and AR are low - smoking doesn't explain much of the CHD burden.
5. QUICK MEMORY AID
- RR = Ratio → tells you "How strong is the link?" → used in aetiology
- AR = Difference → tells you "How much disease can be prevented?" → used in public health
- PAR = same idea but for the whole population
Summary Formula Box (Exam Ready)
Blindness programe psm mbbs
National Programme for Control of Blindness (NPCB)
PSM - MBBS | Park's Textbook
DEFINITIONS
MAGNITUDE OF BLINDNESS IN INDIA
| Survey | Prevalence of Blindness |
|---|---|
| 1976 (at programme launch) | 1.4% |
| Rapid National Survey (2006-07) | 1.0% |
| Current National Survey (2015-19) | 0.36% |
CAUSES OF BLINDNESS IN INDIA
(National Survey on Blindness 2015-19)
| Cause | Percentage |
|---|---|
| Cataract (untreated) | 66.2% - LEADING CAUSE |
| Cataract surgical complications | 7.2% |
| Non-trachomatous corneal opacity | 7.4% |
| Other posterior segment disease | 5.9% |
| Glaucoma | 5.5% |
| Aphakia uncorrected | 1.7% |
| Diabetic retinopathy | 1.2% |
| Phthisis | 2.8% |
| Trachomatous corneal opacity | 0.8% |
| ARMD | 0.7% |
| Refractive error | 0.1% |
Exam point: Cataract is the single most important cause of blindness in India (~66%). It occurs a decade earlier in India compared to Europe/America. Avoidable blindness (preventable + curable) accounts for the vast majority of cases.
EPIDEMIOLOGICAL DETERMINANTS
| Factor | Details |
|---|---|
| Age | ~30% lose sight before age 20; Vit A deficiency, trachoma in children; cataract, glaucoma in elderly |
| Sex | Higher prevalence in females (more trachoma, conjunctivitis, cataract) |
| Malnutrition | Vitamin A deficiency → xerophthalmia, keratomalacia (especially 6 months - 3 years of age) |
| Occupation | Factory/workshop workers - dust, radiation (UV, X-ray), welding flash → eye injuries, premature cataracts |
| Social class | Blindness twice as prevalent in poorer classes |
| Social factors | Quacks (meddlesome ophthalmology), ignorance, poverty, poor hygiene |
NATIONAL PROGRAMME FOR CONTROL OF BLINDNESS (NPCB)
Launch & History
- Launched: 1976 as a 100% centrally sponsored programme
- Incorporated: Earlier Trachoma Control Programme (started 1968, merged 1976)
- Renamed: "National Programme for Control of Blindness and Visual Impairment" (NPCB-VI)
Objectives (12th Five Year Plan)
-
Continue 3 "signature activities":
- Perform 66 lakh cataract operations/year
- School eye screening + distribute 9 lakh free spectacles/year to children with refractive errors
- Collect 50,000 donated eyes/year for keratoplasty
-
Reduce backlog of avoidable blindness by treatment at primary, secondary, tertiary levels
-
Develop "Eye Health for All" strategy - comprehensive universal eye care
-
Strengthen Regional Institutes of Ophthalmology (RIOs) as centres of excellence
-
Develop human resources for quality eye care in all districts
-
Enhance community awareness and preventive measures
-
Expand research in blindness prevention
-
Involve voluntary organisations and private practitioners
STRATEGIES / SALIENT FEATURES
- Free cataract surgery through health system + NGOs + private practitioners
- Comprehensive eye care beyond cataract - diabetic retinopathy, glaucoma, corneal transplantation, childhood blindness
- Active screening of population above 50 years - organize eye camps, transport operable cases
- Refractive error screening in school children - free spectacles for poor
- Public-private partnership for underserved areas
- Capacity building of health personnel
- IEC (Information, Education, Communication) for community awareness
- Strengthen Regional Institutes of Ophthalmology and Medical Colleges
- Strengthen district hospitals - infra, equipment, ophthalmologists, PMOAs
- Vision Centres in all PHCs with Para-Medical Ophthalmic Assistants (PMOAs)
- Multipurpose District Mobile Ophthalmic Units for better rural coverage
ADMINISTRATIVE STRUCTURE
| Level | Body |
|---|---|
| Central | Ophthalmology Section, DGHS, Ministry of Health & Family Welfare, New Delhi |
| State | State Ophthalmic Cell / State Health Societies |
| District | District Blindness Control Society (merged with District Health Society under NRHM) |
SERVICE DELIVERY & REFERRAL SYSTEM
| Level | Facility |
|---|---|
| Tertiary | Regional Institutes of Ophthalmology, Centres of Excellence, Medical Colleges |
| Secondary | District Hospitals, NGO Eye Hospitals |
| Primary | Sub-district hospitals, CHCs, Mobile Ophthalmic Units, Upgraded PHCs |
- 80 central mobile units attached to medical colleges
- 341 district mobile units for eye camps in rural areas
METHODS OF INTERVENTION (Prevention of Blindness)
(a) Primary Eye Care
- Village health guides, MPWs trained to treat: acute conjunctivitis, ophthalmia neonatorum, trachoma, superficial foreign bodies, xerophthalmia
- Given essential drugs: topical tetracycline, Vitamin A capsules, eye bandages
- Refer difficult cases to PHC/district hospital
- Based on primary health care principles (Alma Ata Declaration, 1978)
(b) Secondary Care
- Definitive management: cataract, trichiasis, entropion, ocular trauma, glaucoma
- Provided at PHCs and district hospitals
- Eye camp approach - highly successful for cataract in rural India
(c) Tertiary Care
- National/regional capitals, Medical Colleges
- Retinal detachment surgery, corneal grafting, complex management
- National Institute for the Blind - Dehradun (rehabilitation)
(d) Specific Programmes
- Trachoma Control - mass campaigns with topical tetracycline (merged with NPCB 1976)
- School Eye Health Services - screening for refractive errors, squint, amblyopia
- Vitamin A prophylaxis - prevention of nutritional blindness
SCHOOL EYE SCREENING PROGRAMME
- 6-7% of children aged 10-14 years have eye problems affecting learning
- First screened by trained teachers
- Suspected refractive error cases seen by ophthalmic assistants
- Free spectacles given to children below poverty line
EYE DONATION PROGRAMME
- Eye Donation Fortnight: 25th August to 8th September every year
- Hospital retrieval programme - motivate relatives of terminally ill/accident victims
- During 2018-19: 68,409 donated eyes collected for corneal implantation
- Leading states: Gujarat, Tamil Nadu, Maharashtra, Andhra Pradesh
- NGOs involved: Lions International, Rotary International, NSPB India
VISION 2020: THE RIGHT TO SIGHT
- Global initiative to eliminate avoidable blindness by year 2020
- India is a committed partner
| Tier | Number |
|---|---|
| Centres of Excellence | 20 |
| Training Centres | 200 |
| Service Centres | 2,000 |
| Vision Centres | 20,000 |
CHANGING CONCEPTS IN EYE HEALTH CARE
- Primary eye care - eye care component integrated into PHC system
- Epidemiological approach - population-level studies; local situation determines action
- Team concept - use of auxiliary health personnel (ophthalmic assistants, MPWs, village health workers) due to shortage of specialists
- National programmes - comprehensive programme replacing single-disease campaigns
QUICK EXAM SUMMARY
| Fact | Value |
|---|---|
| NPCB launched | 1976 |
| Programme type | 100% centrally sponsored |
| Leading cause of blindness in India | Cataract (66.2%) |
| Original target | Reduce prevalence from 1.4% to 0.3% |
| Current prevalence (2015-19) | 0.36% |
| Old definition of blindness (India) | <3/60 at 6 metres |
| New definition (WHO-aligned) | Cannot count fingers at 3 metres |
| Eye donation fortnight | 25 Aug - 8 Sep |
| Vision Centres | In all PHCs, with PMOA |
| Trachoma programme merged | 1976 (started 1968) |

Answers
Q.1 - Fill in the Blanks (6x1=06)
a) Life Expectancy is a ______ Indicator.
- Life expectancy at birth is a positive health indicator (as it measures long-term survival, not disease/death directly).
- It is also classified under mortality indicators (socio-economic development indicator).
- Park's PSM - accepted answer: Positive health indicator
b) The Scientist who discovered Small Pox vaccine is ______.
- Edward Jenner (1749-1823) of Great Britain discovered vaccination against smallpox in 1796.
- He noted that milkmaids who developed cowpox appeared immune to smallpox.
- (Park's PSM, "Birth of Preventive Medicine")
c) Total Osmolarity of WHO Reduced Osmolarity ORS is ______.
- WHO Reduced Osmolarity ORS (recommended 2002 onwards) = 245 mOsm/L
- Standard (old) WHO ORS = 311 mOsm/L
- The reduced osmolarity ORS is safer, effective, and reduces stool output and vomiting
d) Expected number of Eligible Couples per 1000 Population in India is ______.
- An "eligible couple" = currently married couple where wife is in reproductive age (15-45 years)
- There are at least 150 to 180 eligible couples per 1000 population in India (Park's PSM, Family Planning chapter)
e) ______ is the Government of India's initiative for improving the quality of care in labour rooms and maternity operation theatres.
- LaQshya (Labour Room Quality Improvement Initiative) was launched by MOHFW in 2017
- Full form: Labour room Quality improvement initiative
- Evidence-based approach to improve quality of maternal and newborn care and provide respectful care in labour rooms and maternity OTs in public health facilities
f) In a normal distribution, approximately ____% of observations lie above +2 SD.
- In a normal distribution: ±2 SD covers 95% of all observations
- So 5% lie outside ±2 SD - 2.5% above +2 SD and 2.5% below -2 SD
- This is a standard statistical property of the Gaussian (normal) distribution
Q.2 - Answer the Following (4x1=04)
a) About Chicken-Pox, TRUE is:
- Varicella (chickenpox) is highly contagious with a secondary attack rate of approximately 85% (range 61-100%) in susceptible household contacts - this is closest to "approaches 90%"
- B is FALSE - Period of communicability is 1-2 days BEFORE to 4-5 days AFTER appearance of rash (not 6 days before to 6 days after - that is measles)
- C is FALSE - Incubation period of chickenpox is 14-16 days (range 10-21 days), NOT 6 days
- D is FALSE - In chickenpox, palms and soles are characteristically SPARED (unlike smallpox where palms and soles ARE affected)
Correct Answer: A
b) School girls aged 11-14 years in Rajasthan being vaccinated against HPV. Which mode of prevention is being practiced?
- Vaccination is a classic example of Specific Protection (Level 1 of Leavell & Clark's levels of prevention - Primary Prevention)
- Health Promotion = general measures (nutrition, hygiene, lifestyle)
- Specific Protection = vaccines, chemoprophylaxis, use of specific nutrients
- Early diagnosis and treatment = Secondary prevention
- Disability limitation and rehabilitation = Tertiary prevention
Correct Answer: B
c) Which of the following DOES NOT represent a Direct mode of transmission?
- Direct transmission = person-to-person contact with NO intermediate - includes transplacental, sexual intercourse, droplet spread, direct contact
- A (Transplacental) = Direct ✓
- B (Sexual intercourse) = Direct ✓
- C (Needle stick injury) = Direct (direct inoculation) ✓
- D (Contaminated water) = INDIRECT transmission (vehicle-borne) - water acts as an intermediate vehicle/fomite
Correct Answer: D
Quick Summary Table
| Q | Answer |
|---|---|
| 1a | Positive (health indicator) |
| 1b | Edward Jenner |
| 1c | 245 mOsm/L |
| 1d | 150-180 per 1000 population |
| 1e | LaQshya |
| 1f | 2.5% |
| 2a | A (SAR approaches 90%) |
| 2b | B (Specific protection) |
| 2c | D (Contaminated water = indirect) |

Answer
Q.2 (d) - Match the Following: Demographic Cycle
| Stage | Match | Explanation |
|---|---|---|
| a. High Stationary | II - High birth rate AND high death rate | Both high, cancel out, population stationary |
| b. Early Expanding | III - Birth rate starts declining, death rate declines further | Death rate falls first, birth rate unchanged/starts to fall |
| c. Late Expanding | IV - Birth rate remains unchanged, Death rate declines | Death rate declines, birth rate still high |
| d. Declining | I - Birth rate is lower than death rate | Population begins to decline |
Note on the options: Looking carefully at Park's PSM definitions:
- High Stationary = high birth + high death = II
- Early Expanding = death rate begins to decline, birth rate unchanged = IV
- Late Expanding = death rate declines further, birth rate tends to fall = III
- Declining = birth rate lower than death rate = I
This matches option B: a-II, b-IV, c-III, d-I (option D in paper also reads: a-II, b-IV, c-III, d-I)Correct Answer = B (a-II, b-III, c-IV, d-I) or D depending on how options are read. Most PSM exams: answer is B.
Q.3 - Clinical Case Study: Type 2 Diabetes Mellitus (15x1=15, 3 marks each)
a) Diagnostic Criteria for Diabetes Mellitus (WHO/ADA)
| Criteria | Value |
|---|---|
| Fasting Plasma Glucose (FPG) | ≥ 126 mg/dL (≥7.0 mmol/L) - fasting = no caloric intake for ≥8 hours |
| 2-hour Plasma Glucose (OGTT) | ≥ 200 mg/dL (≥11.1 mmol/L) during 75g oral glucose tolerance test |
| HbA1c | ≥ 6.5% (≥48 mmol/mol) |
| Random Plasma Glucose | ≥ 200 mg/dL (≥11.1 mmol/L) WITH classic symptoms (polyuria, polydipsia, unexplained weight loss) |
This patient's RBS = 238 mg/dL with symptoms → satisfies criterion 4 → Diabetes confirmed
b) Body Mass Index (BMI) - Calculation and Interpretation
| BMI | Classification |
|---|---|
| < 18.5 | Underweight |
| 18.5 - 22.9 | Normal (Asian cut-off) |
| 23.0 - 24.9 | Overweight (Asian) |
| ≥ 25.0 | Obese (Asian cut-off) |
BMI = 27.5 kg/m² → Overweight/Grade I Obesity (by Asian/Indian cut-offs) This is a modifiable risk factor for his Type 2 DM and should be targeted in management.
c) Three Complications in Non-Compliant Patient + Recommended Screening
| Complication | Screening Recommended |
|---|---|
| 1. Diabetic Retinopathy | Dilated fundus examination (DFE) annually by ophthalmologist; fundus photography |
| 2. Diabetic Nephropathy | Urine microalbumin (spot albumin:creatinine ratio) annually; serum creatinine and eGFR |
| 3. Diabetic Neuropathy | Annual foot examination - monofilament test (10g Semmes-Weinstein), vibration sense (128Hz tuning fork), ankle reflexes |
d) Non-Pharmacological Measures for This Patient
-
Dietary modification (Medical Nutrition Therapy)
- Caloric restriction: reduce total calorie intake to achieve weight loss (target BMI <23)
- Reduce refined carbohydrates and sugar; increase dietary fibre
- Low glycaemic index foods, portion control
- Limit saturated fats; avoid trans fats
-
Physical Activity
- At least 150 minutes/week of moderate-intensity aerobic exercise (brisk walking)
- Resistance training 2-3 days/week
- Reduce sedentary behaviour
-
Weight Reduction
- Target: 5-10% reduction in body weight (shown to significantly improve glycaemic control)
-
Lifestyle Modifications
- Smoking cessation (if applicable)
- Limit alcohol
- Stress management, adequate sleep
-
Self-monitoring
- Patient education on blood glucose monitoring, foot care, sick-day rules
-
Regular follow-up
- Monitoring HbA1c every 3 months, BP, lipid profile
e) Community-Based Screening Strategy for DM under NP-NCD Programme
- Family history of diabetes
- History of gestational diabetes
- Overweight/obesity (BMI ≥23)
- Hypertension
- Physical inactivity
- Age ≥45 years
| Level | Activity |
|---|---|
| Community (ASHA/ANM) | CBAC form, identify high-risk individuals, refer to HWC/PHC |
| Health and Wellness Centre (HWC/PHC) | Random Blood Sugar (RBS) testing; if RBS ≥140 mg/dL → refer to CHC |
| CHC/District Hospital | Fasting Plasma Glucose, OGTT (75g), HbA1c for confirmation and management |
- RBS < 140 mg/dL → normal, reassure
- RBS 140-200 mg/dL → repeat FBS/PPBS
- RBS ≥ 200 mg/dL with symptoms → Diabetes - refer for management
Q.4 - Short Notes (Any Five) (5x2=10)
a) Treatment of Plasmodium Falciparum Malaria in Rajasthan
- P. falciparum = Malignant Tertian/Falciparum Malaria - most dangerous; chloroquine-resistant
| Drug | Dose |
|---|---|
| Artemisinin-based Combination Therapy (ACT) | Artemether-Lumefantrine (AL): 6 doses over 3 days |
| Or Artesunate + Sulfadoxine-Pyrimethamine (AS+SP) in some states | |
| Primaquine (single dose) | 0.75 mg/kg on Day 3 as gametocidal agent (to prevent transmission) |
- In severe/complicated malaria: IV Artesunate (drug of choice) → switch to oral ACT when patient can tolerate
- Avoid chloroquine (resistant), quinine second line only
- Supportive: IV fluids, antipyretics, anti-convulsants (if seizures), dialysis (if renal failure)
b) Differentiate Isolation and Quarantine - Public Health Importance
| Feature | Isolation | Quarantine |
|---|---|---|
| Definition | Separation of sick/infected persons (confirmed disease) from healthy | Separation of exposed/susceptible persons (not yet sick) from community |
| Based on | Confirmed diagnosis | Exposure to infection (within incubation period) |
| Duration | Until no longer infectious | For the maximum incubation period of the disease |
| Person | Diseased patient | Healthy but exposed contact |
| Example | TB patient in hospital | Close contact of COVID-19 positive case |
- Both aim to break the chain of transmission
- Prevent spread from source to susceptible host
- Isolation reduces onward transmission from known cases
- Quarantine prevents undetected infectious persons from spreading disease
- Tools used in outbreaks, pandemics (COVID-19) and bioterrorism preparedness
c) Net Reproduction Rate (NRR)
- Definition: NRR is the number of daughters a newborn girl will bear during her lifetime, assuming fixed age-specific fertility and mortality rates
- NRR = 1: Each woman replaces herself → population is stable (zero population growth)
- NRR > 1: Population growing
- NRR < 1: Population declining
- India's demographic goal: Achieve NRR = 1 (attained in some states like Kerala, TN)
- NRR differs from Gross Reproduction Rate (GRR) in that it accounts for female mortality before completing reproductive life
- Significance: A key demographic indicator; CPR >60% needed to achieve NRR = 1 in India
d) Screening for Breast Cancer
| Method | Details |
|---|---|
| Mammography | Gold standard; recommended annually/biennially for women 40-74 years; reduces mortality by >40% |
| Clinical Breast Examination (CBE) | By trained health worker; part of NP-NCD at HWCs for women ≥30 years |
| Breast Self-Examination (BSE) | Monthly self-examination; primarily increases awareness |
| USG Breast | Adjunct to mammography; useful in dense breasts, young women |
| MRI Breast | High-risk women (BRCA mutation carriers) |
e) Case Fatality Rate (CFR)
- Also called Case Fatality Ratio
- Expressed as percentage
- Measures the severity/virulence of a disease
- Does NOT measure risk of dying in the general population (that is mortality rate)
- Rabies: CFR ~100%
- Ebola: CFR 25-90%
- COVID-19: CFR ~1-3%
- Cholera (untreated): CFR up to 50%; with treatment <1%
- Indicates lethality of a disease
- Useful in comparing severity across outbreaks
- Helps assess quality of medical care
- Used in epidemic management - higher CFR → urgent intervention needed
- Depends on completeness of case detection (mild cases missed = CFR overestimated)
- Varies with healthcare availability and treatment
f) 4 Rules of Home Treatment of Dehydration in Under-Five Child
| Rule | Action |
|---|---|
| Rule 1: Give extra fluids | Give ORS or home fluids (rice water, lassi, coconut water, plain water) more than usual after every loose stool. For <2 years: 50-100 mL after each stool. For ≥2 years: 100-200 mL after each stool |
| Rule 2: Give Zinc supplementation | Zinc 20 mg/day for 14 days (10 mg/day for infants <6 months). Reduces duration and severity of diarrhoea and prevents recurrence |
| Rule 3: Continue feeding | Continue breastfeeding; do NOT withhold food. Continue age-appropriate diet to prevent nutritional deterioration |
| Rule 4: Know when to return (Warning signs) | Return immediately if: child cannot drink/breastfeed, becomes sicker, develops fever, blood in stool, or if diarrhoea is not improving after 3 days |
Q.5 - Explain Briefly (Any Three) (3x5=15)
a) Criteria for a Screening Test
- Be an important health problem (significant burden, serious condition)
- Have a recognizable latent or early symptomatic stage
- Have an accepted treatment for cases discovered
- Have a known natural history (well understood)
- Be suitable for screening - treatment in early stage better than late
- High sensitivity (detects true positives - "rule out" disease)
- High specificity (avoids false positives - "rule in" disease)
- High Positive Predictive Value (PPV)
- Simple, cheap, reproducible
b) Prevention and Control of Hepatitis A and E Infection
Hepatitis A:
- Safe water supply and sanitation
- Personal hygiene - handwashing before eating, after defecation
- Proper food handling and cooking
- Vaccination: Hepatitis A vaccine (inactivated) - 2 doses; recommended for travellers to endemic areas, children in endemic regions, healthcare workers
- Passive immunization: Normal Human Immunoglobulin (within 2 weeks of exposure)
- Case notification and investigation
- Enteric precautions for case
- Disinfection of stools/articles
- Investigate source (water/food)
Hepatitis E:
- No licensed vaccine available (though one approved in China)
- Safe water supply is the most important control measure
- Improved sanitation, sewage disposal
- Avoid drinking untreated water, especially during floods/outbreaks
- Special precaution in pregnant women (CFR up to 20-25% in pregnancy - third trimester)
- Treatment is supportive; no specific antiviral
- Safe drinking water (chlorination, boiling)
- Proper sewage disposal
- Food hygiene
- Health education
c) Growth Chart in MCP (Mamta) Card - Other Uses
- Weight-for-age chart plotted monthly
- Shows child's growth from birth to 5 years
- Road-to-health concept: child should gain weight each month
- Green zone: Normal (>80% of reference weight) - well-nourished
- Yellow zone: Moderate malnutrition (60-80%) - at risk
- Red zone: Severe malnutrition (<60%) - SAM - needs urgent referral
- Monitor nutritional status of under-5 child longitudinally
- Early detection of malnutrition (Grade I-IV) before it becomes severe
- Evaluate effectiveness of supplementary feeding/intervention programmes
- Immunization record - vaccines given are noted in MCP card alongside growth chart
- Motivational tool for mothers - visual demonstration of child's progress
- Identify faltering growth - flat curve = growth faltering even if in normal range
- Research and programme evaluation - community nutrition surveillance
- Antenatal and postnatal record - MCP card also tracks ANC visits, maternal weight, delivery details
STRUCTURED ESSAY - TB Clinical Case
Expected Answers for TB Structured Essay:
Probable Diagnosis: Sputum Smear Positive Pulmonary Tuberculosis (Cat I / New Case)
- Cough >2 weeks (4 weeks) - cardinal symptom
- Evening rise of temperature (low-grade fever)
- Weight loss
- Sputum AFB positive = Bacteriologically confirmed TB
- CXR: Right upper lobe infiltrates (typical TB lesion)
Treatment under NTEP (National Tuberculosis Elimination Programme):
| Phase | Duration | Drugs | Doses |
|---|---|---|---|
| Intensive Phase | 2 months | Isoniazid (H) + Rifampicin (R) + Pyrazinamide (Z) + Ethambutol (E) | Daily |
| Continuation Phase | 4 months | Isoniazid (H) + Rifampicin (R) | Daily |
- All drugs given as Fixed Dose Combinations (FDCs)
- Weight-based dosing
- Under DOTS (Directly Observed Treatment Short-course) supervision
Contact Tracing (important for migrant worker):
- Screen all household contacts - especially children <5 years (TPT - TB Preventive Therapy with Isoniazid 6 months)
- Index case registration on Ni-kshay portal
Public Health Measures:
- Notification to health authorities (mandatory under law)
- Identify all contacts (contact investigation)
- Ensure treatment completion - prevent drug resistance
- Sputum smear follow-up at end of 2nd month, 5th month, 6th month
- Address social determinants: migrant status → ensure treatment continuation, link to DOTS at new location
- Adverse Drug Reactions (ADR) monitoring - especially hepatotoxicity (R,H,Z), optic neuritis (E)