
CT scan finding basics
I'll read the medical library skill first, then pull CT scan basics from the textbooks.
Reading File
Now let me search the library for CT scan basics - running parallel queries:
Finding Sources
Finding Sources
Good - found a radiology textbook and a dedicated CT section. Let me read the core CT basics sections in parallel:
Finding Sources
Reading File
Reading File
Excellent content found. Let me also pull the Grainger & Allison radiology textbook for CT basics and window/level settings:
Finding Sources
Finding Sources
Finding Sources
Finding Sources
Let me fetch the key CT basics section from Fishman's Pulmonary and the contrast phases section, plus grab the relevant CT image:
Reading File
Reading File
Loading Image
I now have excellent content from multiple authoritative textbooks. Let me compile the comprehensive answer.
CT Scan Findings - Basics
1. How CT Works
CT (Computed Tomography) is a digital cross-sectional imaging technique that uses a rotating X-ray source around the patient, coupled to diametrically positioned detectors in a circular configuration. As the gantry rotates, multiple projections are generated at different angles with different X-ray beam attenuations depending on which anatomy is traversed.
After acquisition, through filtered back projection (or more recently, iterative reconstruction), the sum of projections is transformed into an image in which the relative density of each small volume (voxel) is proportional to its X-ray absorption coefficient. - Fishman's Pulmonary Diseases and Disorders
2. Image Construction: Pixels and Voxels
| Term | Definition |
|---|---|
| Voxel | The actual tiny 3D volume of patient anatomy being sampled |
| Pixel | The 2D display unit on screen corresponding to a voxel |
| Gray scale | Each pixel displays in black/white shade based on the attenuation value of that voxel |
3. Hounsfield Units (HU) - The Core Scale
The Hounsfield Unit (HU) scale is the standard measure of X-ray attenuation in CT. The scale is normalized so that:
| Tissue / Substance | HU Value |
|---|---|
| Air | -1000 |
| Fat | -100 to -50 |
| Water | 0 |
| Soft tissue (muscle) | +20 to +80 |
| Blood (clot) | +50 to +70 |
| Bone | +400 to +1000 |
| Metal / dense calcification | >+1000 |
"A single CT image is divided into many tiny blocks of different shades of black and white called pixels. The actual gray scale of each pixel depends upon the amount of radiation absorbed at that point, which is termed an attenuation value." - Campbell-Walsh-Wein Urology
Key rule: Higher HU = brighter (whiter) on CT. Lower HU = darker (blacker).
4. CT Windows
Because the full HU range (-1000 to +1000) cannot be meaningfully displayed on a single grayscale image, windowing is used to select which range of HU is displayed. Any value below the window appears black; any above appears white.
| Window Setting | Window Center (Level) | Window Width | Use |
|---|---|---|---|
| Lung window | -600 HU | 1500 HU | Parenchyma, airways, small nodules |
| Soft tissue window | +40 HU | 400 HU | Organs, lymph nodes, vessels |
| Bone window | +400 HU | 1500-2000 HU | Cortex, trabecular bone, fractures |
| Brain window | +35 HU | 80 HU | Subtle density differences in brain |
| Liver window | +60 HU | 160 HU | Hepatic lesions |
Always view the same scan on multiple windows - a lung nodule, a liver lesion, and a fracture may all be present on the same scan but only apparent on their respective windows.
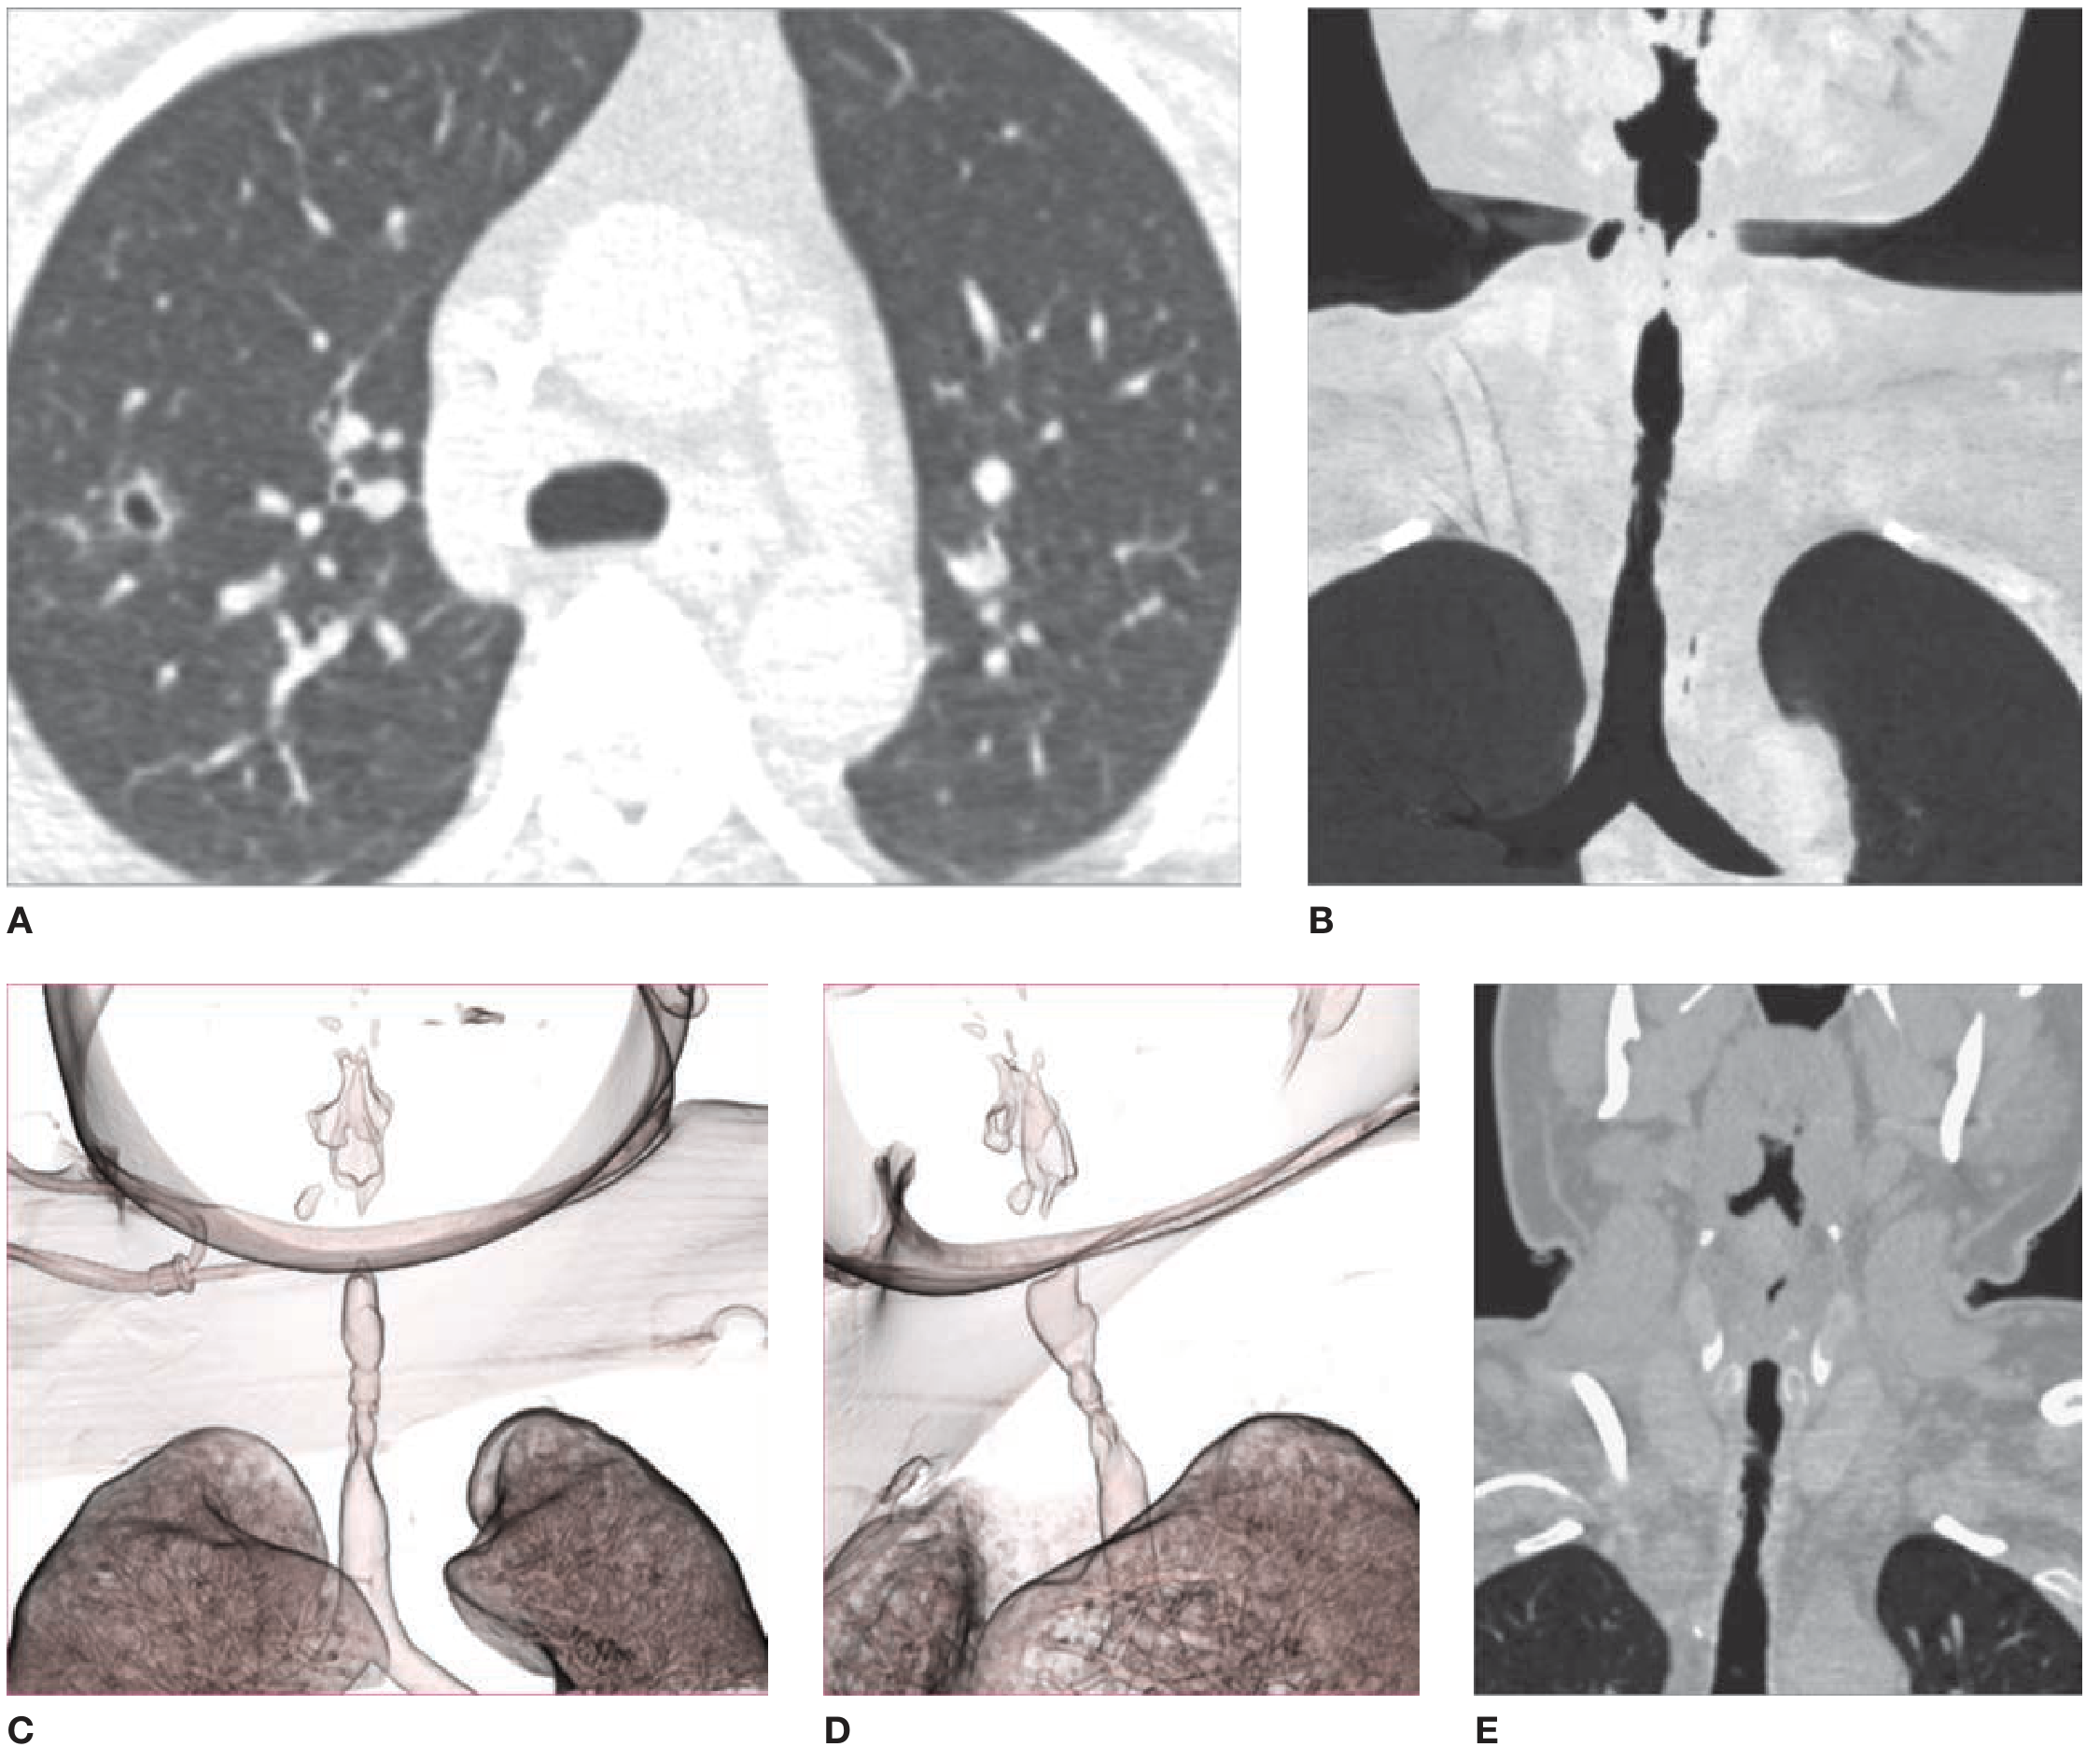
Here is how different window settings look on the same chest CT - note how lung window (A) shows parenchymal detail and vascular markings, while soft tissue window (B) shows mediastinal structures:
5. CT Scanner Technology
Early scanners had a single row of detectors, acquiring one axial image at a time - a full chest took over 30 minutes.
Modern scanners have:
- 64-320 rows of detectors
- One or two X-ray tubes (dual-source CT)
- Fast continuous gantry rotation + simultaneous table translation
- Helical (spiral) acquisition - entire chest in under 1 second
- Submillimeter isotropic resolution images reconstructable in any plane
Dual-energy CT uses both high- and low-energy kV settings simultaneously, allowing:
- Material decomposition (e.g., iodine vs. calcium)
- Virtual unenhanced images from contrast-enhanced studies
- Quantitation of iodine in lung parenchyma as a reflection of pulmonary blood volume - Fishman's Pulmonary Diseases & Disorders
6. High-Resolution CT (HRCT)
HRCT uses thin slices (1 mm) with a high spatial frequency reconstruction algorithm, sharpening edges for improved visualization of fine lung parenchymal detail (interstitium, secondary lobule, bronchiolar walls). Originally acquired non-contiguously (gaps between slices), modern HRCT uses volumetric (contiguous) acquisition.
7. Contrast Enhancement
Types of CT Contrast
- Intravenous (IV) iodinated contrast - highlights vascular structures and lesions based on their blood supply
- Oral contrast - differentiates bowel from lymph nodes, scar, or tumor
- Rectal contrast - used in pelvic imaging when needed
Phases of IV Contrast Enhancement
| Phase | Timing Post-Injection | What It Shows |
|---|---|---|
| Non-contrast | Before injection | Calcification, fat, hemorrhage, baseline density |
| Arterial phase | ~25-35 sec | Aorta, hepatic artery, hypervascular lesions (e.g., HCC, carcinoid) |
| Portal venous phase | ~60-70 sec | Portal vein, liver parenchyma, most abdominal organs |
| Delayed / nephrographic | 3-15 min | Excretory system, washout characteristics, capsular enhancement |
"Dynamic contrast-enhanced CT can include noncontrast, arterial, portal venous, and delayed phases. The classic and most diagnostic pattern for HCC is a combination of hyperenhancement in the arterial phase... loss of enhancement (washout)... and capsular enhancement in portal-venous and delayed phases." - Sleisenger & Fordtran's Gastrointestinal and Liver Disease
8. Key Descriptive CT Findings
| Finding | Description | Common Causes |
|---|---|---|
| Hyperdense | Brighter than surrounding tissue (high HU) | Acute blood, calcification, iodine contrast, protein-rich fluid |
| Hypodense | Darker than surrounding tissue (low HU) | Edema, infarction, fat, necrosis, simple cysts |
| Isodense | Same density as reference tissue | Normal variants, some tumors |
| Enhancement | Increase in HU after contrast | Vascularity / blood-brain barrier breakdown |
| Washout | Loss of enhancement on delayed phase | Classic for HCC |
| Calcification | Very bright (>100 HU), no enhancement | Prior infection, dystrophic, metabolic |
| Fat | Very dark (-100 to -50 HU) | Lipoma, angiomyolipoma, mature teratoma |
| Air | Extremely dark (-1000 HU) | Bowel gas, pneumothorax, pneumomediastinum, gas gangrene |
9. Standard CT Scan Protocols by Region
| Region | Coverage | Key Notes |
|---|---|---|
| Head CT | Skull base to vertex | Non-contrast first for hemorrhage; contrast for tumors, infections |
| Chest CT | Lung apices to adrenals | Lung and mediastinal windows both needed |
| Abdomen CT | Diaphragm to iliac crest | Usually requires IV and sometimes oral contrast |
| Pelvis CT | Iliac crest to pubic symphysis | Separate request from abdomen |
| CT Angiography (CTA) | Variable | Bolus timing for arterial phase; no oral contrast |
10. Postprocessing Techniques
| Technique | Description |
|---|---|
| MPR (Multiplanar Reconstruction) | Reformats axial images into coronal, sagittal, or oblique planes without quality loss |
| 3D Volume Rendering (VR) | Color 3D images of vessels, airways, bones |
| MIP (Maximum Intensity Projection) | Highlights high-density structures (vessels, calcifications) along a ray |
| MinIP (Minimum Intensity Projection) | Highlights low-density structures (airways, emphysema) |
| Virtual Endoscopy | Simulates "flying through" a hollow structure (virtual colonoscopy, CT bronchoscopy) |
Quick Summary
- CT measures X-ray attenuation in Hounsfield units (air = -1000, water = 0, bone = +1000)
- Higher HU = whiter on image; lower HU = blacker
- Windowing selects which HU range is displayed - you must use the right window (lung, bone, soft tissue)
- IV contrast adds phases (arterial, portal venous, delayed) - each phase interrogates different pathology
- Modern CT is volumetric and helical - isotropic data reconstructable in any plane
- Key terms: hyperdense, hypodense, enhancement, washout, calcification, fat density
Sources: Fishman's Pulmonary Diseases and Disorders | Campbell-Walsh-Wein Urology | Sleisenger & Fordtran's Gastrointestinal and Liver Disease | Grainger & Allison's Diagnostic Radiology
This is a shared conversation. Sign in to Orris to start your own chat.