
Fetal devlpment
fetal development stages embryo to fetus diagram
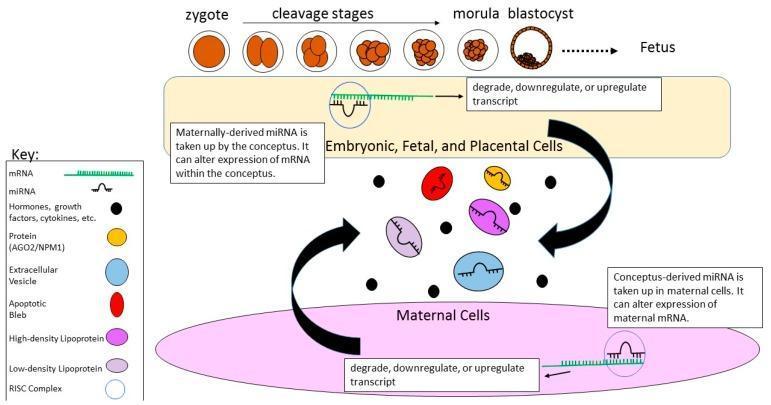
A pathophysiology diagram illustrating bidirectional microRNA (miRNA) crosstalk between embryonic/fetal/placental cells and maternal cells. The top section shows developmental stages from zygote through cleavage, morula, and blastocyst to fetus. Large black arrows indicate the exchange of signaling molecules between the conceptus (yellow region) and maternal tissue (pink region). A central 'Key' identifies various transport vehicles involved in this communication: Extracellular Vesicles (EVs), apoptotic blebs, high-density lipoproteins (HDL), low-density lipoproteins (LDL), and proteins like Argonaute 2 (AGO2) and Nucleophosmin 1 (NPM1). The diagram details a molecular mechanism where transferred miRNA is taken up by recipient cells, associates with a RNA-induced silencing complex (RISC), and binds to complementary target mRNA. This interaction results in the degradation, downregulation, or upregulation of the mRNA transcript. This signaling pathway represents a critical endocrine/paracrine communication system during pregnancy, where maternally-derived miRNA alters conceptus gene expression and conceptus-derived miRNA modifies maternal mRNA expression to support embryonic development and maternal adaptation.
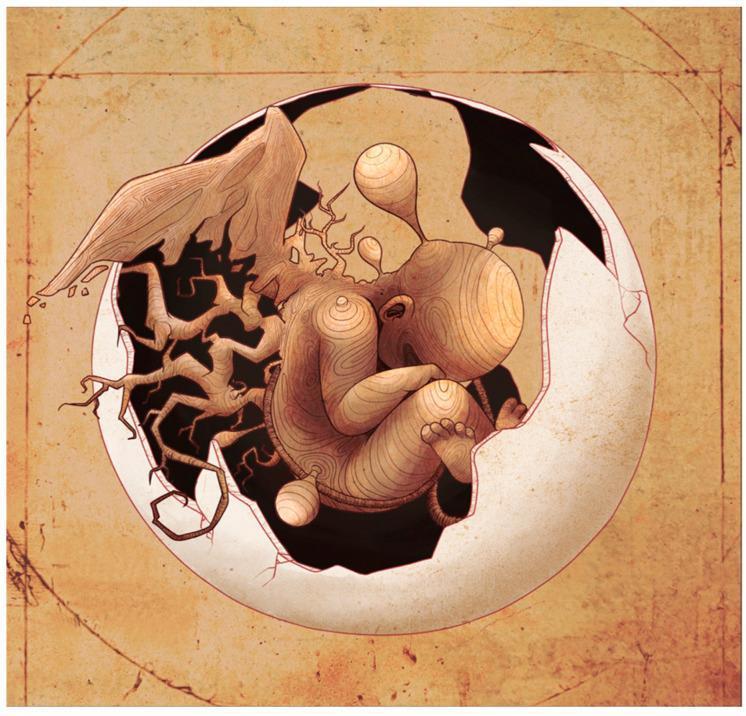
This medical illustration is a conceptual artistic rendition of oncogenesis recapitulating embryogenesis, portraying a human embryo or fetus situated within a cracked eggshell. The central figure is depicted in a curled fetal position, exhibiting an unusual topographical or wood-grain texture across its surface. Distortions in the figure include bulbous protrusions emerging from the head and a complex, root-like or dendritic structure extending from the dorsal region, symbolizing aberrant growth or tumor development (oncogeny). The image is set against a parchment-like background with faint geometric line drawings reminiscent of Renaissance anatomical sketches. This conceptual diagram illustrates the pathological relationship between embryonic stem cell (ESC) pathways and cancer stem cells (CSC), highlighting the 'distorted mirror image' theory where tumorigenesis mimics developmental ontogeny. It serves as a visual metaphor for how tumors utilize developmental mechanisms for growth and immune evasion, relevant to oncology, embryology, and cell biology curriculum.
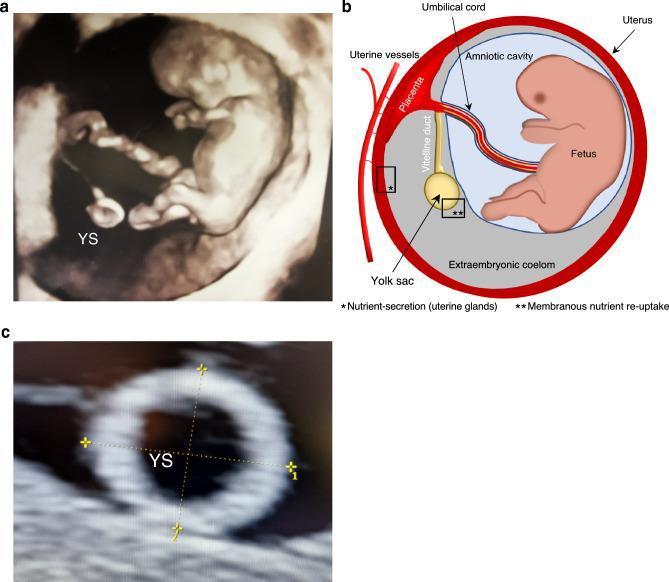
This composite educational graphic details first-trimester embryonic development and yolk sac (YS) anatomy. Panel (a) is a 3D ultrasound of a 10-week-old embryo, showing the echogenic fetus and its connection to the secondary yolk sac via the vitelline duct, set against hypoechoic amniotic fluid. Panel (b) provides a corresponding anatomical diagram illustrating the spatial relationship between the amniotic cavity containing the fetus and the extraembryonic coelom (exocoelomic cavity) housing the yolk sac. It highlights key structures including the placenta, umbilical cord, uterine vessels, and uterine glands. Labels indicate physiological processes like nutrient secretion from uterine glands and membranous re-uptake by the yolk sac. Panel (c) is a high-magnification 2D ultrasound demonstrating the clinical method for measuring yolk sac size using two perpendicular outer-to-outer diameters. The image serves as a reference for early obstetric imaging, fetal-maternal nutrient exchange mechanisms, and standard sonographic biometry during the first trimester.
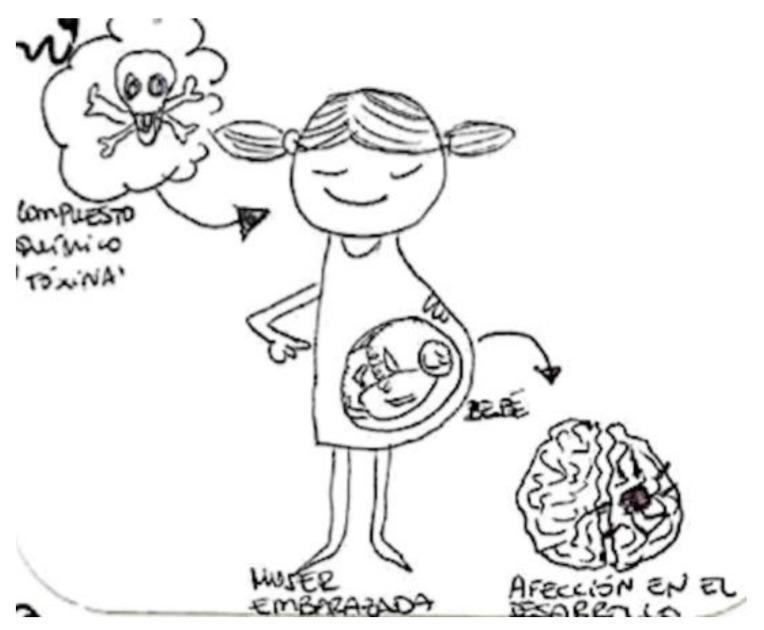
This hand-drawn educational diagram illustrates the pathophysiological impact of environmental toxins on fetal development. The central figure is a pregnant woman (labeled 'MUJER EMBARAZADA') with a smiling fetus visible in the womb (labeled 'BEBÉ'). A thought bubble above the woman contains a skull and crossbones symbol alongside the text 'COMPUESTO QUÍMICO TOXINA', representing the ingestion or exposure to toxic chemical compounds. An arrow originates from the abdominal/fetal region and points toward a separate illustration of a human brain. The brain diagram contains a dark lesion or focal point, accompanied by the label 'AFECCIÓN EN EL DESARROLLO' (developmental disorder). The illustration serves as a conceptual model for placental transfer of teratogens or neurotoxins and their subsequent clinical significance in causing congenital neurodevelopmental impairments. It is designed for public health education to simplify complex toxicological mechanisms into a visual narrative of maternal exposure and fetal consequence.
Fetal Development
The Classic Timeline Diagram
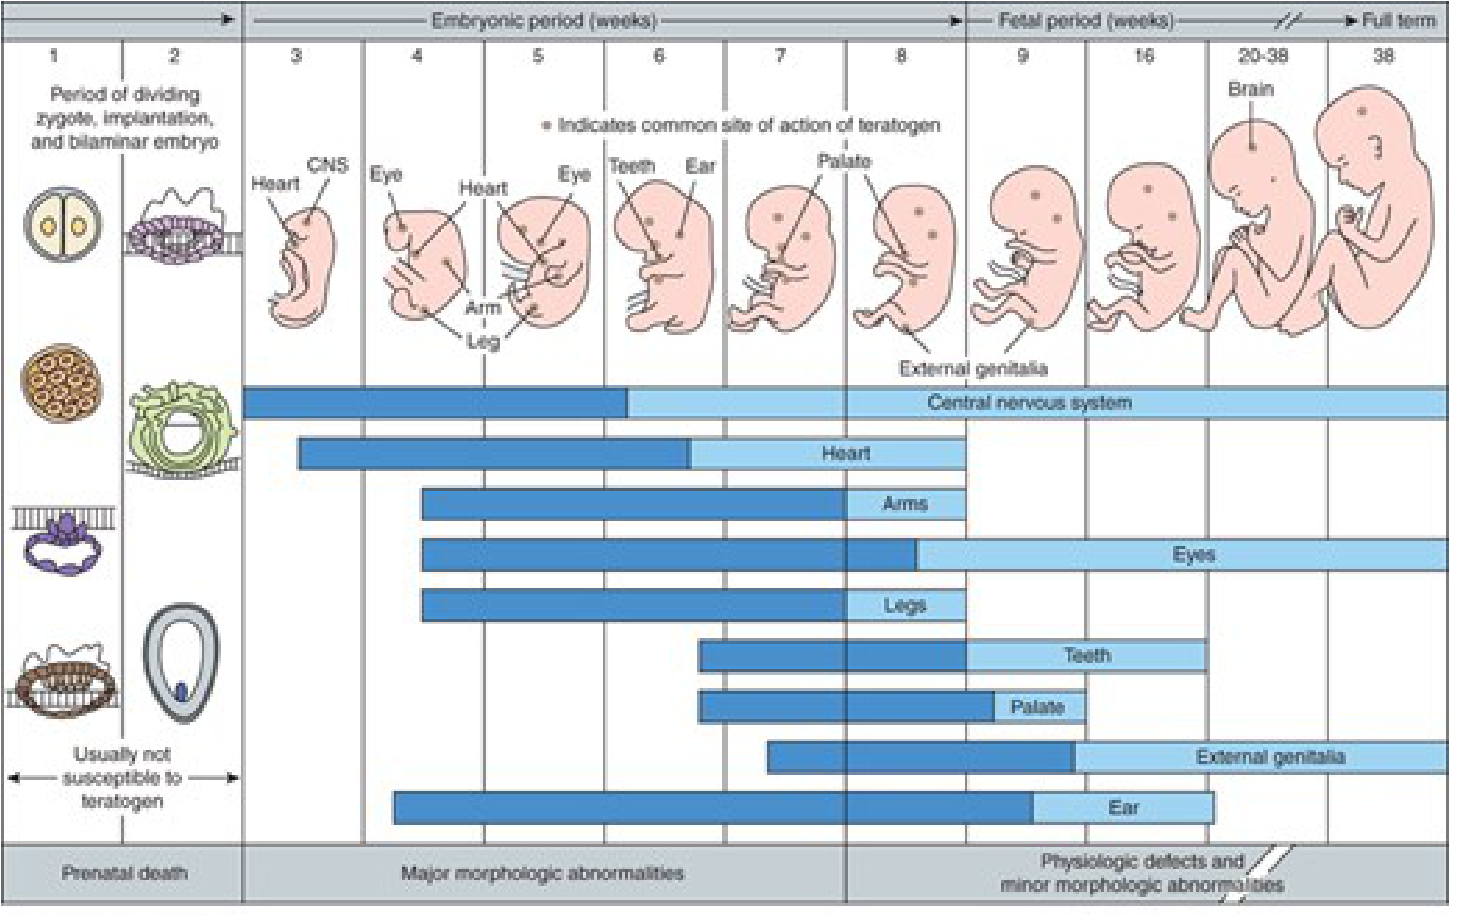
Phase 1 - Germinal Stage (Weeks 1-2)
- Fertilization occurs, forming a zygote
- The zygote undergoes cleavage to form a morula, then a blastocyst
- At ~day 6-7, implantation occurs in the uterine wall
- The placenta begins to form from trophoblastic tissue
- The inner cell mass (embryoblast) separates into the cells that will become the embryo proper
- This period is generally NOT susceptible to teratogens - exposure typically causes all-or-nothing effects (death or survival with no defect)
Phase 2 - Embryonic Stage (Weeks 3-8)
| Week | Key Events |
|---|---|
| 3 | Neural tube begins forming; heart and CNS development start |
| 4 | Heart beats; arm and leg buds appear; eyes and CNS developing |
| 5 | Eyes, heart, arms, legs actively developing; major organogenesis underway |
| 6 | Eyes, teeth, ears forming; upper limbs are paddle-shaped |
| 7 | Teeth and ear development; palate formation begins |
| 8 | Palate and external genitalia begin forming; all major organs present in rudimentary form |
- Miller's Anesthesia, 10e - Chapter 72
Phase 3 - Fetal Stage (Week 9 through Birth)
Weeks 9-12
- The head constitutes ~half the crown-rump length (CRL) at week 9
- CRL nearly doubles by week 12
- Liver is the major site of erythropoiesis (red blood cell formation)
- Urine formation begins between weeks 9-12; fetal urine is discharged into the amniotic fluid
- By week 9: face is broad, eyes widely separated, eyelids fused
- By week 12: primary ossification centers appear in cranium and long bones; upper limbs reach near-final proportions
- Male and female genitalia can be identified by weeks 12-14
Weeks 13-16
- Very rapid growth; CRL increases markedly
- Limb movements become coordinated by week 14 (too subtle for mother to feel, but visible on ultrasound)
- Slow eye movements occur at week 14
- Ossification of the fetal skeleton is active and clearly visible on ultrasound by week 16
- By week 16: ovaries differentiated, containing primordial follicles; eyes now face anteriorly; external ears are near their final position
- Scalp hair patterning is established in this period
Weeks 17-20
- Growth slows, but CRL increases by ~50 mm
- Mother can now feel fetal movements - quickening
- Skin is covered with vernix caseosa (greasy, cheese-like protective coating of dead epidermal cells + sebaceous secretions)
- Lanugo (fine downy hair) appears, helping vernix adhere to skin
- Eyebrows and head hair visible at week 20
- Brown fat begins forming at the root of the neck, posterior sternum, and perirenal area - its role is heat production via fatty acid oxidation
- By week 18: fetal uterus formed, vaginal canalization begins in females
- By week 20: testes have begun to descend (still on posterior abdominal wall)
Weeks 21-25
- Substantial weight gain; fetus becomes better proportioned
- Skin is wrinkled, pink to red (blood in capillaries visible through thin skin)
- At week 21: rapid eye movements begin
- Weeks 22-23: blink-startle responses reported
- Type II pneumocytes begin secreting surfactant - critical for keeping future alveoli open after birth
- Fingernails present by week 24
- Viability is marginal at this age; survival requires intensive neonatal care
Weeks 26-29
- Age of viability - fetuses born in this window can survive with intensive care
- Lungs and pulmonary vasculature sufficiently developed for gas exchange
- CNS mature enough to direct rhythmic breathing movements and regulate body temperature
- Eyelids open at week 26; lanugo and head hair well developed
- Toenails visible; subcutaneous fat increases, smoothing out wrinkles
- White fat reaches ~3.5% of body weight
- By week 28: bone marrow takes over as the primary site of erythropoiesis (replacing the spleen)
Weeks 30-34
- Pupillary light reflex can be elicited at week 30
- Skin becomes pink and smooth; limbs have a chubby appearance
- White fat ~8% of body weight
- Fetuses born at 32 weeks or beyond usually survive without major complications
Weeks 35-38 (Full Term)
-
At week 35: firm grasp and spontaneous orientation to light
-
CNS sufficiently mature for integrative functions
-
By week 36: circumference of head and abdomen are approximately equal
-
Full term at 38 weeks: CRL ~360 mm, weight ~3400 g, white fat ~16% body weight
-
Thorax prominent; breasts slightly protrude in both sexes
-
Testes usually in the scrotum in full-term males
-
Male fetuses are generally longer and heavier than female fetuses
-
The Developing Human: Clinically Oriented Embryology - Chapter 6
Key Concepts
Critical Periods and Teratogen Sensitivity
Erythropoiesis Sites - A Timeline
| Stage | Primary Site |
|---|---|
| Early fetal (9-12 weeks) | Liver |
| Mid-fetal (~12-28 weeks) | Liver + Spleen |
| After 28 weeks | Bone marrow (takes over entirely) |
Surfactant Production
Fetal Oxygenation
Prematurity Classification
| Category | Gestational Age |
|---|---|
| Mild preterm | 32-37 weeks |
| Very preterm | 28-31 weeks |
| Extremely preterm | < 28 weeks |
Create a week-by-week milestone checklist document for clinical reference
ls -la /tmp/workspace/ 2>/dev/null || echo "workspace does not exist yet"
mkdir -p /tmp/workspace/fetal-development && cat << 'PYEOF' > /tmp/workspace/fetal-development/build_doc.py from docx import Document from docx.shared import Pt, Inches, RGBColor from docx.enum.text import WD_ALIGN_PARAGRAPH from docx.enum.table import WD_TABLE_ALIGNMENT, WD_ALIGN_VERTICAL from docx.oxml.ns import qn from docx.oxml import OxmlElement import copy # ── helpers ────────────────────────────────────────────────────────────────── def set_cell_bg(cell, hex_color): tc = cell._tc tcPr = tc.get_or_add_tcPr() shd = OxmlElement('w:shd') shd.set(qn('w:val'), 'clear') shd.set(qn('w:color'), 'auto') shd.set(qn('w:fill'), hex_color) tcPr.append(shd) def set_cell_borders(cell, top=None, bottom=None, left=None, right=None): tc = cell._tc tcPr = tc.get_or_add_tcPr() tcBorders = OxmlElement('w:tcBorders') for side, val in [('top', top), ('bottom', bottom), ('left', left), ('right', right)]: if val: b = OxmlElement(f'w:{side}') b.set(qn('w:val'), val.get('val', 'single')) b.set(qn('w:sz'), val.get('sz', '4')) b.set(qn('w:space'),'0') b.set(qn('w:color'),val.get('color','000000')) tcBorders.append(b) tcPr.append(tcBorders) def add_checkmark_run(para, text, bold=False, color=None, size=10): run = para.add_run(text) run.bold = bold run.font.size = Pt(size) if color: run.font.color.rgb = RGBColor(*bytes.fromhex(color)) def set_col_width(table, col_idx, width_inches): for row in table.rows: row.cells[col_idx].width = Inches(width_inches) # ── document setup ──────────────────────────────────────────────────────────── doc = Document() # Margins for section in doc.sections: section.top_margin = Inches(0.75) section.bottom_margin = Inches(0.75) section.left_margin = Inches(0.9) section.right_margin = Inches(0.9) # Default style normal = doc.styles['Normal'] normal.font.name = 'Arial' normal.font.size = Pt(10) # ── TITLE BLOCK ─────────────────────────────────────────────────────────────── title_para = doc.add_paragraph() title_para.alignment = WD_ALIGN_PARAGRAPH.CENTER r = title_para.add_run('FETAL DEVELOPMENT') r.bold = True r.font.size = Pt(22) r.font.color.rgb = RGBColor(0x1A, 0x53, 0x76) # deep clinical blue sub_para = doc.add_paragraph() sub_para.alignment = WD_ALIGN_PARAGRAPH.CENTER r2 = sub_para.add_run('Week-by-Week Milestone Checklist | Clinical Reference') r2.font.size = Pt(11) r2.font.color.rgb = RGBColor(0x55, 0x55, 0x55) r2.bold = True # thin rule rule = doc.add_paragraph() rule.paragraph_format.space_before = Pt(2) rule.paragraph_format.space_after = Pt(6) rr = rule.add_run('─' * 85) rr.font.color.rgb = RGBColor(0x1A, 0x53, 0x76) rr.font.size = Pt(9) # Sources note src = doc.add_paragraph() src.alignment = WD_ALIGN_PARAGRAPH.CENTER rs = src.add_run('Sources: The Developing Human (Moore & Persaud, 10e) · Miller\'s Anesthesia (10e) · Creasy & Resnik\'s Maternal-Fetal Medicine') rs.font.size = Pt(8) rs.italic = True rs.font.color.rgb = RGBColor(0x88, 0x88, 0x88) src.paragraph_format.space_after = Pt(10) # ── LEGEND ─────────────────────────────────────────────────────────────────── leg = doc.add_paragraph() leg.paragraph_format.space_after = Pt(8) leg.add_run('LEGEND: ').bold = True for sym, label, col in [ ('☐', ' Structural/Anatomical ', '1A5376'), (' ✦ ', ' Functional/Physiological ', '145A32'), (' ⚠ ', ' Clinical Significance ', 'B8480A'), ]: rr = leg.add_run(sym) rr.font.color.rgb = RGBColor(*bytes.fromhex(col)) rr.font.size = Pt(10) rr2 = leg.add_run(label) rr2.font.size = Pt(9) # ═══════════════════════════════════════════════════════════════════════════════ # DATA — each phase / week entry # ═══════════════════════════════════════════════════════════════════════════════ phases = [ { 'phase': 'GERMINAL STAGE', 'weeks': 'Weeks 1-2', 'phase_color': '1A5376', 'bg': 'D6E4F0', 'entries': [ ('☐', 'Fertilization → zygote formation', 'struct'), ('☐', 'Cleavage divisions → morula → blastocyst', 'struct'), ('☐', 'Implantation in uterine wall (~day 6-7)', 'struct'), ('☐', 'Placenta begins forming from trophoblast', 'struct'), ('✦', 'Inner cell mass (embryoblast) differentiates', 'func'), ('⚠', 'NOT susceptible to teratogens — all-or-nothing effect (death or normal development)', 'clin'), ] }, { 'phase': 'EMBRYONIC STAGE', 'weeks': 'Weeks 3-8', 'phase_color': '145A32', 'bg': 'D5F0DC', 'entries': [ ('☐', 'Week 3: Neural plate → neural tube begins; primitive heart forms; CNS development starts', 'struct'), ('☐', 'Week 4: Heart beats; arm and leg buds appear; eye and brain vesicles forming', 'struct'), ('☐', 'Week 5: Eyes, heart, arm, leg development accelerates; major organogenesis underway', 'struct'), ('☐', 'Week 6: Retinal pigment visible; upper limbs paddle-shaped; teeth primordia form', 'struct'), ('☐', 'Week 7: Teeth and ear development; palate begins forming; tail regresses', 'struct'), ('☐', 'Week 8: External genitalia begin forming; all major organs present in rudimentary form', 'struct'), ('✦', 'By end of week 8: embryo ~3 cm CRL; recognizably human', 'func'), ('⚠', 'HIGHEST RISK PERIOD for major morphological abnormalities from teratogen exposure', 'clin'), ('⚠', 'CNS and heart sensitive throughout entire embryonic period', 'clin'), ] }, { 'phase': 'FETAL STAGE — Early', 'weeks': 'Weeks 9-12', 'phase_color': '5B2C6F', 'bg': 'E8DAEF', 'entries': [ ('☐', 'Head = ~50% of crown-rump length (CRL) at week 9', 'struct'), ('☐', 'CRL nearly doubles by end of week 12', 'struct'), ('☐', 'Primary ossification centers appear in cranium and long bones by week 12', 'struct'), ('☐', 'Upper limbs approach near-final proportions by week 12', 'struct'), ('☐', 'Eyelids fused; face broad; eyes widely separated; ears low-set', 'struct'), ('☐', 'Male and female genitalia distinguishable by weeks 12-14', 'struct'), ('✦', 'Liver = major site of erythropoiesis (RBC formation)', 'func'), ('✦', 'Urine formation begins weeks 9-12; fetal urine excreted into amniotic fluid', 'func'), ('✦', 'Fetal swallowing of amniotic fluid begins', 'func'), ('⚠', 'Fetal waste products transferred to maternal circulation via placental membrane', 'clin'), ] }, { 'phase': 'FETAL STAGE', 'weeks': 'Weeks 13-16', 'phase_color': '5B2C6F', 'bg': 'F4ECF7', 'entries': [ ('☐', 'Very rapid growth; head relatively smaller vs. week 12', 'struct'), ('☐', 'Lower limbs lengthen; proportions improve', 'struct'), ('☐', 'Ossification of skeleton active and clearly visible on ultrasound by week 16', 'struct'), ('☐', 'Ovaries differentiated; primordial follicles with oogonia visible by week 16', 'struct'), ('☐', 'Eyes now face anteriorly (not anterolaterally) by week 16', 'struct'), ('☐', 'External ears near definitive positions by week 16', 'struct'), ('☐', 'Scalp hair patterning determined', 'struct'), ('✦', 'Limb movements coordinated by week 14 (visible on US, not yet felt by mother)', 'func'), ('✦', 'Slow eye movements begin at week 14', 'func'), ] }, { 'phase': 'FETAL STAGE', 'weeks': 'Weeks 17-20', 'phase_color': '5B2C6F', 'bg': 'E8DAEF', 'entries': [ ('☐', 'CRL increases ~50 mm; growth rate slows compared to 13-16 wk', 'struct'), ('☐', 'Skin covered with vernix caseosa (dead epidermal cells + sebaceous secretions)', 'struct'), ('☐', 'Lanugo (fine downy hair) covers body; helps vernix adhere', 'struct'), ('☐', 'Eyebrows and head hair visible by week 20', 'struct'), ('☐', 'Fetal uterus formed by week 18; vaginal canalization begins (females)', 'struct'), ('☐', 'Testes begin descent (still on posterior abdominal wall) by week 20', 'struct'), ('✦', 'QUICKENING — mother first feels fetal movements', 'func'), ('✦', 'Brown fat begins forming at root of neck, posterior sternum, perirenal area', 'func'), ('✦', 'Brown fat produces heat by oxidizing fatty acids (thermoregulation)', 'func'), ('⚠', 'AFP peaks at week 14 after LNMP — elevated AFP in NTDs; low AFP in trisomy 21/18', 'clin'), ] }, { 'phase': 'FETAL STAGE', 'weeks': 'Weeks 21-25', 'phase_color': '7B3F00', 'bg': 'FDEBD0', 'entries': [ ('☐', 'Substantial weight gain; better proportioned', 'struct'), ('☐', 'Skin: wrinkled, translucent, pink-to-red (capillaries visible)', 'struct'), ('☐', 'Fingernails present by week 24', 'struct'), ('✦', 'Rapid eye movements begin at week 21', 'func'), ('✦', 'Blink-startle responses reported at weeks 22-23', 'func'), ('✦', 'Type II pneumocytes begin secreting SURFACTANT (~21-24 wk)', 'func'), ('⚠', 'Viability marginal — intensive neonatal care required if born at this stage', 'clin'), ('⚠', 'Surfactant insufficiency → Neonatal Respiratory Distress Syndrome (RDS) if premature', 'clin'), ] }, { 'phase': 'FETAL STAGE', 'weeks': 'Weeks 26-29', 'phase_color': '7B3F00', 'bg': 'FEF9E7', 'entries': [ ('☐', 'Eyelids open at week 26', 'struct'), ('☐', 'Toenails visible; subcutaneous fat increases — skin smoothens', 'struct'), ('☐', 'Lanugo and head hair well developed', 'struct'), ('☐', 'White fat = ~3.5% of body weight', 'struct'), ('✦', 'Lungs and pulmonary vasculature sufficient for gas exchange', 'func'), ('✦', 'CNS directs rhythmic breathing movements and body temperature regulation', 'func'), ('✦', 'Bone marrow takes over as PRIMARY site of erythropoiesis by week 28 (replaces spleen)', 'func'), ('⚠', 'AGE OF VIABILITY — survival possible with intensive neonatal care', 'clin'), ('⚠', 'Highest neonatal mortality in low BW (≤2500 g) and very low BW (≤1500 g) infants', 'clin'), ] }, { 'phase': 'FETAL STAGE', 'weeks': 'Weeks 30-34', 'phase_color': '1A5376', 'bg': 'D6E4F0', 'entries': [ ('☐', 'Skin pink and smooth; limbs have chubby appearance', 'struct'), ('☐', 'White fat = ~8% of body weight', 'struct'), ('✦', 'Pupillary light reflex present at week 30', 'func'), ('✦', 'CNS integration continues to mature rapidly', 'func'), ('⚠', 'Fetuses ≥32 weeks usually survive if born prematurely (mild preterm zone)', 'clin'), ] }, { 'phase': 'FETAL STAGE — Term', 'weeks': 'Weeks 35-38', 'phase_color': '0B3D0B', 'bg': 'D5F0DC', 'entries': [ ('☐', 'By week 36: head circumference ≈ abdominal circumference', 'struct'), ('☐', 'By week 37: foot length slightly > femoral length (used to confirm gestational age)', 'struct'), ('☐', 'At 38 weeks (full term): CRL ~360 mm; weight ~3400 g', 'struct'), ('☐', 'Thorax prominent; breasts slightly protrude in both sexes', 'struct'), ('☐', 'Testes usually in scrotum (full-term males); premature males often have undescended testes', 'struct'), ('☐', 'White fat = ~16% of body weight (gains ~14 g fat/day in final weeks)', 'struct'), ('✦', 'Firm grasp and spontaneous orientation to light by week 35', 'func'), ('✦', 'CNS sufficiently mature for integrative functions near term', 'func'), ('✦', 'Growth rate slows as term approaches (placental changes affect fetal nutrition)', 'func'), ('⚠', 'Males generally longer and heavier than females at birth', 'clin'), ('⚠', 'Normal birth weight: 2500–4200 g; <2500 g = Low BW; <1500 g = Very Low BW; <1000 g = Extremely Low BW', 'clin'), ] }, ] # color map COLORS = { 'struct': '1A5376', 'func': '145A32', 'clin': 'B8480A', } # ═══════════════════════════════════════════════════════════════════════════════ # ERYTHROPOIESIS REFERENCE TABLE # ═══════════════════════════════════════════════════════════════════════════════ def add_phase_section(doc, phase_data): ph = phase_data['phase'] wks = phase_data['weeks'] pcol = phase_data['phase_color'] bg = phase_data['bg'] entries = phase_data['entries'] # Phase header bar — 1-row table full width tbl = doc.add_table(rows=1, cols=1) tbl.alignment = WD_TABLE_ALIGNMENT.LEFT tbl.style = 'Table Grid' cell = tbl.rows[0].cells[0] set_cell_bg(cell, pcol) p = cell.paragraphs[0] p.alignment = WD_ALIGN_PARAGRAPH.LEFT p.paragraph_format.space_before = Pt(3) p.paragraph_format.space_after = Pt(3) r1 = p.add_run(f' {ph}') r1.bold = True r1.font.color.rgb = RGBColor(0xFF, 0xFF, 0xFF) r1.font.size = Pt(11) r2 = p.add_run(f' {wks}') r2.font.color.rgb = RGBColor(0xFF, 0xFF, 0xAA) r2.font.size = Pt(10) # Checklist table — col 0: symbol, col 1: milestone ctbl = doc.add_table(rows=len(entries), cols=2) ctbl.alignment = WD_TABLE_ALIGNMENT.LEFT ctbl.style = 'Table Grid' for i, (sym, text, etype) in enumerate(entries): row = ctbl.rows[i] # symbol cell sc = row.cells[0] set_cell_bg(sc, bg if i % 2 == 0 else 'FFFFFF') sc.width = Inches(0.35) sp = sc.paragraphs[0] sp.alignment = WD_ALIGN_PARAGRAPH.CENTER sp.paragraph_format.space_before = Pt(2) sp.paragraph_format.space_after = Pt(2) sr = sp.add_run(sym) sr.font.color.rgb = RGBColor(*bytes.fromhex(COLORS[etype])) sr.font.size = Pt(11) sr.bold = True # milestone cell mc = row.cells[1] set_cell_bg(mc, bg if i % 2 == 0 else 'FFFFFF') mp = mc.paragraphs[0] mp.paragraph_format.space_before = Pt(2) mp.paragraph_format.space_after = Pt(2) mp.paragraph_format.left_indent = Inches(0.05) mr = mp.add_run(text) mr.font.size = Pt(9.5) mr.font.color.rgb = RGBColor(*bytes.fromhex(COLORS[etype])) if etype == 'clin': mr.bold = True if etype == 'func': mr.italic = True doc.add_paragraph().paragraph_format.space_after = Pt(4) for phase_data in phases: add_phase_section(doc, phase_data) # ═══════════════════════════════════════════════════════════════════════════════ # QUICK-REFERENCE TABLES SECTION # ═══════════════════════════════════════════════════════════════════════════════ doc.add_paragraph() # Section header hdr = doc.add_paragraph() hr = hdr.add_run('QUICK-REFERENCE TABLES') hr.bold = True hr.font.size = Pt(13) hr.font.color.rgb = RGBColor(0x1A, 0x53, 0x76) hdr.paragraph_format.space_after = Pt(6) # ── Table A: Erythropoiesis ── a_hdr = doc.add_paragraph() ar = a_hdr.add_run('A. Sites of Erythropoiesis by Gestational Age') ar.bold = True ar.font.size = Pt(10) ar.font.color.rgb = RGBColor(0x14, 0x5A, 0x32) ery_data = [ ('Gestational Period', 'Primary Site of RBC Formation', 'Notes'), ('Weeks 9-12', 'Liver', 'Liver = dominant site throughout first trimester fetal period'), ('Weeks 12-28', 'Liver + Spleen', 'Activity decreasing in liver; spleen active mid-pregnancy'), ('After week 28', 'Bone Marrow', 'Bone marrow takes over entirely; spleen activity ceases'), ('Post-birth (adult)', 'Bone Marrow', 'Liver/spleen serve as extramedullary sites only in disease'), ] etbl = doc.add_table(rows=len(ery_data), cols=3) etbl.style = 'Table Grid' for i, row_data in enumerate(ery_data): for j, val in enumerate(row_data): c = etbl.rows[i].cells[j] if i == 0: set_cell_bg(c, '145A32') elif i % 2 == 1: set_cell_bg(c, 'D5F0DC') p = c.paragraphs[0] p.paragraph_format.space_before = Pt(2) p.paragraph_format.space_after = Pt(2) r = p.add_run(val) r.font.size = Pt(9) if i == 0: r.bold = True r.font.color.rgb = RGBColor(0xFF, 0xFF, 0xFF) doc.add_paragraph().paragraph_format.space_after = Pt(6) # ── Table B: Prematurity Classification ── b_hdr = doc.add_paragraph() br = b_hdr.add_run('B. Prematurity & Birth Weight Classification') br.bold = True br.font.size = Pt(10) br.font.color.rgb = RGBColor(0x7B, 0x3F, 0x00) prem_data = [ ('Category', 'Gestational Age / Weight', 'Clinical Notes'), ('Mild Preterm', '32-37 weeks', 'Most survive; risk of RDS and feeding difficulties'), ('Very Preterm', '28-31 weeks', 'Significant neonatal morbidity; NICU required'), ('Extremely Preterm', '< 28 weeks', 'Critical; limit of viability ~22-24 weeks'), ('Normal Birth Weight', '2500-4200 g', 'Term neonate target range'), ('Low Birth Weight (LBW)', '< 2500 g', 'Highest risk of neonatal mortality'), ('Very Low Birth Weight (VLBW)', '< 1500 g', 'Major morbidity risk; prolonged NICU stay'), ('Extremely Low Birth Weight', '< 1000 g', 'Very high mortality; significant long-term disability risk'), ] ptbl = doc.add_table(rows=len(prem_data), cols=3) ptbl.style = 'Table Grid' for i, row_data in enumerate(prem_data): for j, val in enumerate(row_data): c = ptbl.rows[i].cells[j] if i == 0: set_cell_bg(c, '7B3F00') elif i % 2 == 1: set_cell_bg(c, 'FDEBD0') p = c.paragraphs[0] p.paragraph_format.space_before = Pt(2) p.paragraph_format.space_after = Pt(2) r = p.add_run(val) r.font.size = Pt(9) if i == 0: r.bold = True r.font.color.rgb = RGBColor(0xFF, 0xFF, 0xFF) doc.add_paragraph().paragraph_format.space_after = Pt(6) # ── Table C: Key Organ Milestones ── c_hdr = doc.add_paragraph() cr = c_hdr.add_run('C. Critical Organ-Specific Milestones') cr.bold = True cr.font.size = Pt(10) cr.font.color.rgb = RGBColor(0x1A, 0x53, 0x76) org_data = [ ('Organ / System', 'Key Milestone', 'Week (Approx.)'), ('Heart', 'Begins beating', '4'), ('CNS', 'Neural tube closes', '3-4'), ('Kidneys', 'Urine formation begins', '9-12'), ('Eyes', 'Slow eye movements begin', '14'), ('Eyes', 'Rapid eye movements begin', '21'), ('Eyes', 'Eyelids open', '26'), ('Lungs', 'Surfactant production begins (Type II pneumocytes)', '21-24'), ('Lungs', 'Sufficient for gas exchange (viability)', '26-28'), ('Skeleton', 'Primary ossification centers in cranium/long bones', '12'), ('Genitalia', 'External genitalia distinguishable by sex', '12-14'), ('Testes', 'Begin descent toward scrotum', '20'), ('Testes', 'Usually in scrotum at full term', '38'), ('Skin / Hair', 'Vernix caseosa + lanugo appear', '17-20'), ('Skin / Hair', 'Eyebrows and head hair visible', '20'), ('Skin / Hair', 'Fingernails present', '24'), ('Skin / Hair', 'Toenails visible', '26-28'), ('Brown Fat', 'Begins forming (thermoregulation)', '17-20'), ('CNS', 'Pupillary light reflex', '30'), ('CNS', 'Firm grasp; orientation to light', '35'), ('Uterus (female)', 'Fetal uterus formed; vaginal canalization begins', '18'), ] otbl = doc.add_table(rows=len(org_data), cols=3) otbl.style = 'Table Grid' for i, row_data in enumerate(org_data): for j, val in enumerate(row_data): c = otbl.rows[i].cells[j] if i == 0: set_cell_bg(c, '1A5376') elif i % 2 == 1: set_cell_bg(c, 'D6E4F0') p = c.paragraphs[0] p.paragraph_format.space_before = Pt(2) p.paragraph_format.space_after = Pt(2) r = p.add_run(val) r.font.size = Pt(9) if i == 0: r.bold = True r.font.color.rgb = RGBColor(0xFF, 0xFF, 0xFF) doc.add_paragraph().paragraph_format.space_after = Pt(8) # ── Footer disclaimer ── disc = doc.add_paragraph() disc.alignment = WD_ALIGN_PARAGRAPH.CENTER disc.paragraph_format.space_before = Pt(8) dr = disc.add_run( 'For educational and clinical reference only. Verify all values against current institutional guidelines and authoritative sources.\n' 'Sources: The Developing Human, 10e (Moore & Persaud) · Miller\'s Anesthesia, 10e · Creasy & Resnik\'s Maternal-Fetal Medicine' ) dr.font.size = Pt(7.5) dr.italic = True dr.font.color.rgb = RGBColor(0xAA, 0xAA, 0xAA) # ── Save ── out_path = '/tmp/workspace/fetal-development/Fetal_Development_Milestone_Checklist.docx' doc.save(out_path) print(f'Saved: {out_path}') PYEOF python3 /tmp/workspace/fetal-development/build_doc.py
python3 -c " from docx import Document doc = Document('/tmp/workspace/fetal-development/Fetal_Development_Milestone_Checklist.docx') print(f'Tables: {len(doc.tables)}') print(f'Paragraphs: {len(doc.paragraphs)}') # quick content check count = 0 for t in doc.tables: for row in t.rows: text = ' | '.join(c.text.strip() for c in row.cells if c.text.strip()) if text and count < 5: print('ROW:', text[:100]) count += 1 import os size = os.path.getsize('/tmp/workspace/fetal-development/Fetal_Development_Milestone_Checklist.docx') print(f'File size: {size:,} bytes') "
Fetal Development Milestone Checklist
Word Document · DOCX
- Germinal Stage (Weeks 1-2)
- Embryonic Stage (Weeks 3-8)
- Fetal Stage broken into 7 sub-periods (Weeks 9-12 through Weeks 35-38)
- ☐ Structural/Anatomical findings (blue)
- ✦ Functional/Physiological milestones (green, italic)
- ⚠ Clinical significance notes (orange, bold) - teratogen windows, viability thresholds, RDS risk, etc.
- Table A - Sites of erythropoiesis by gestational age (liver → spleen → bone marrow timeline)
- Table B - Prematurity and birth weight classification (LBW, VLBW, ELBW cutoffs)
- Table C - Critical organ-specific milestones by week (heart, CNS, lungs, eyes, skeleton, genitalia, skin, etc.)
Picture
What kind of picture do you need?
fetal development stages week by week embryo to full term diagram illustration
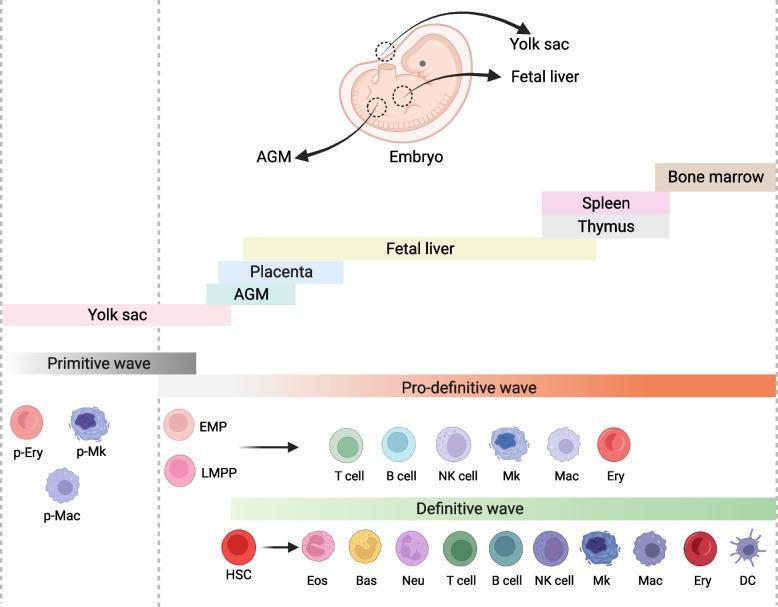
This medical illustration depicts the three waves of embryonic hematopoiesis in vivo, categorized by developmental stages and anatomical locations. At the top, a human embryo diagram identifies key sites: the yolk sac, aorta-gonad-mesonephros (AGM) region, and fetal liver. A timeline highlights the transition of hematopoietic activity through the yolk sac, AGM, placenta, fetal liver, thymus, spleen, and finally the bone marrow. The 'Primitive wave' occurs in the yolk sac, generating primitive erythrocytes (p-Ery), megakaryocytes (p-Mk), and macrophages (p-Mac). The 'Pro-definitive wave' involves erythro-myeloid progenitors (EMP) and lymphoid-primed progenitors (LMPP) that differentiate into T cells, B cells, NK cells, megakaryocytes (Mk), macrophages (Mac), and erythrocytes (Ery). Finally, the 'Definitve wave' shows hematopoietic stem cells (HSCs) giving rise to a full spectrum of mature blood cells including granulocytes (eosinophils, basophils, neutrophils), lymphocytes (T, B, and NK cells), myeloid lineages (Mk, Mac, Ery), and dendritic cells (DC). This schematic illustrates the complex spatiotemporal progression of blood cell formation during human embryogenesis.
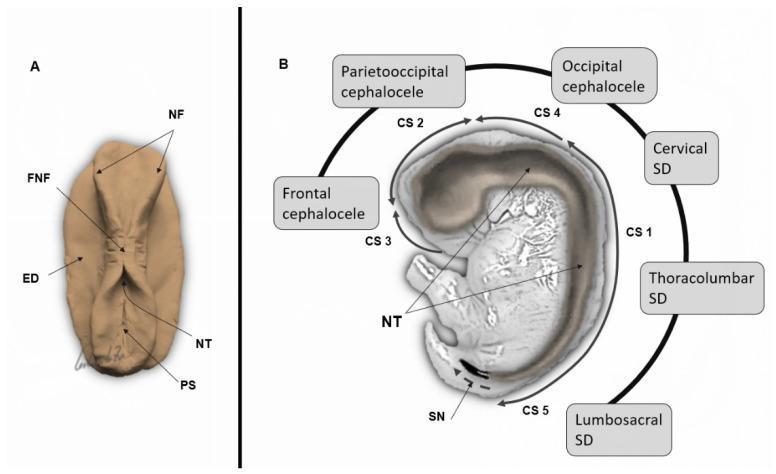
This medical illustration depicts the embryological development of the human neural tube and the multisite closure model. Panel A presents a superior view of the embryonic disk (ED) during the 3rd postconceptional week. Key features include the neural folds (NF) and the initial point of fusion (FNF) where the folds begin to merge to form the neural tube (NT). The primitive streak (PS) is visible at the caudal end, establishing the embryonic axis. Panel B shows a mid-sagittal section of an embryo, illustrating the five distinct closure sites (CS 1–5). The diagram maps specific neural tube defects (NTDs) to failures at these sites: frontal cephalocele (CS 3), parietooccipital cephalocele (CS 2), occipital cephalocele (CS 4), cervical spinal dysraphism (SD) (CS 1), and lumbosacral SD (CS 5). The process of secondary neurulation (SN) is indicated at the distal caudal end. This educational content demonstrates the critical stages of primary neurulation and the clinical correlation between embryonic closure sites and congenital malformations of the central nervous system.
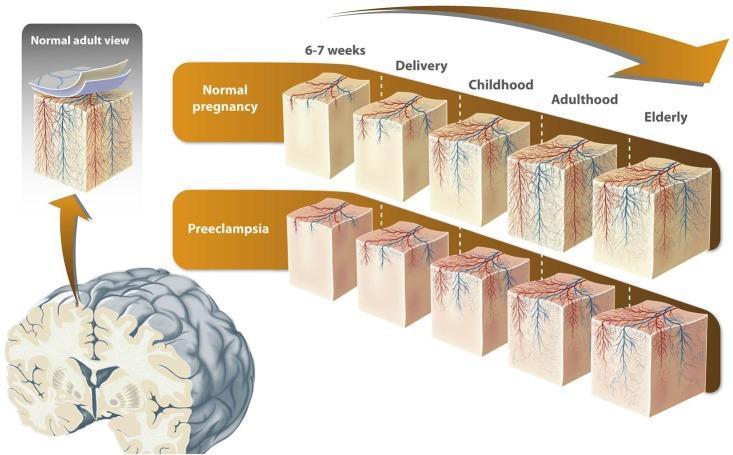
This medical illustration presents a comparative pathophysiology diagram showing cortical microvascular development across the human lifespan in offspring from normal pregnancies versus those affected by preeclampsia. The central visualization consists of two parallel rows of cubic cortical tissue segments spanning five life stages: 6-7 weeks fetal development, delivery, childhood, adulthood, and the elderly. In the 'Normal Pregnancy' row, there is a progressive increase in the density and complexity of the microvascular network (depicted as red arterial and blue venous vessels) reaching its peak in adulthood, followed by a decline in the elderly stage. The 'Preeclampsia' row illustrates reduced angiogenesis and a lower density of microvessels at every corresponding stage compared to the normal group. An inset titled 'Normal Adult View' highlights the anatomical layers, including the pial lamella and the pial capillary anastomotic plexus, showing how the cortical microvasculature originates from this surface plexus. An anatomical diagram of a whole brain in coronal section identifies the cortical region represented in the cubes. The infographic serves to explain how maternal preeclampsia may cause life-long alterations in brain vascular architecture, potentially impacting cognitive health.
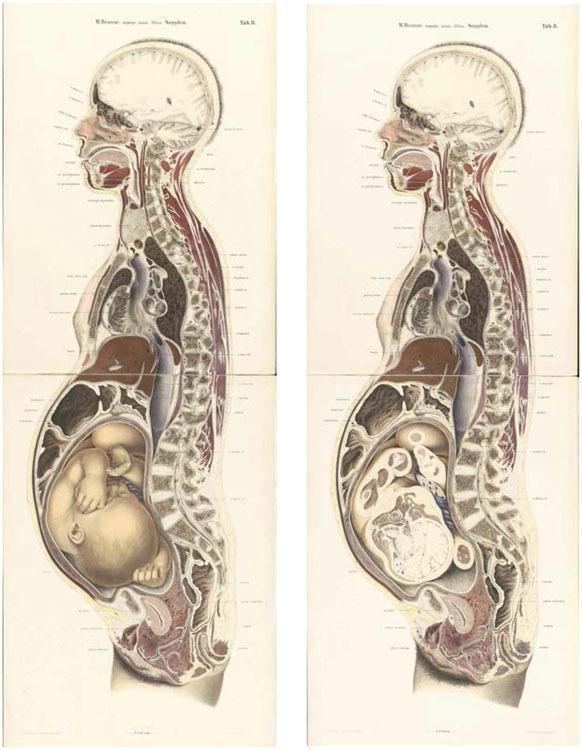
This historical anatomical diagram consists of two full-body mid-sagittal sections of a pregnant woman at full term, based on 19th-century cryosection techniques. The illustrations provide a comprehensive view of maternal and fetal topography. Key maternal structures include the brain, spinal column, esophagus, heart, diaphragm, liver, and a gravid uterus. The left illustration displays the fetus in situ within the uterus, shown in a cephalic presentation (head-down) and flexed 'fetal position' with visible limbs and facial features. The right illustration represents the same sagittal plane but with the fetus removed, revealing the empty uterine cavity, amniotic membranes, and the relationship between the uterus, bladder, and rectum in the pelvic cavity. This comparison highlights the displacement of maternal abdominal viscera (liver and intestines) by the distended uterus. The diagram serves as an educational resource for obstetrics, demonstrating fetal orientation, maternal-fetal anatomical relationships, and the physiological changes in late-stage pregnancy.
This medical illustration is a conceptual artistic rendition of oncogenesis recapitulating embryogenesis, portraying a human embryo or fetus situated within a cracked eggshell. The central figure is depicted in a curled fetal position, exhibiting an unusual topographical or wood-grain texture across its surface. Distortions in the figure include bulbous protrusions emerging from the head and a complex, root-like or dendritic structure extending from the dorsal region, symbolizing aberrant growth or tumor development (oncogeny). The image is set against a parchment-like background with faint geometric line drawings reminiscent of Renaissance anatomical sketches. This conceptual diagram illustrates the pathological relationship between embryonic stem cell (ESC) pathways and cancer stem cells (CSC), highlighting the 'distorted mirror image' theory where tumorigenesis mimics developmental ontogeny. It serves as a visual metaphor for how tumors utilize developmental mechanisms for growth and immune evasion, relevant to oncology, embryology, and cell biology curriculum.
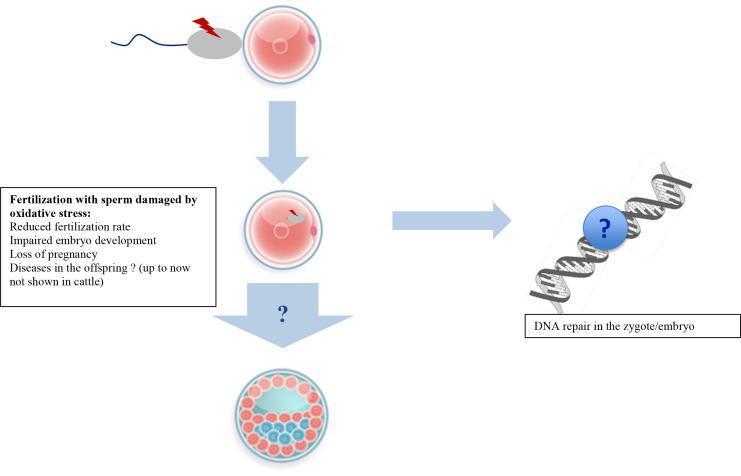
A pathophysiology diagram illustrating the effects of oxidative stress on sperm and subsequent embryo development. The vertical flow on the left depicts fertilization stages: 1) Initial contact between an oocyte and a sperm cell marked with a red lightning bolt symbol, indicating oxidative damage; 2) Incorporation of the damaged paternal genome into the oocyte (zygote stage); and 3) Progression to a blastocyst-like multicellular structure with differentiated cell clusters. A text box lists clinical outcomes of fertilization with oxidatively stressed sperm, including reduced fertilization rates, impaired embryo development, and pregnancy loss. A horizontal arrow from the zygote stage points to a DNA double helix illustration on the right, which is highlighted with a question mark symbol and labeled 'DNA repair in the zygote/embryo'. This visual highlights the uncertainty and critical role of maternal or embryonic DNA repair mechanisms in mitigating paternal oxidative damage. The diagram serves as an educational summary of male-factor infertility mechanisms and developmental biology.
Fetal development stages week by week medical illustration showing size comparison from fertilization through full term birth, including labeled embryo at weeks 4, 6, 8 and fetus at weeks 12, 16, 20, 24, 28, 32, 38, with key anatomical features labeled at each stage, clean white background, professional medical textbook style
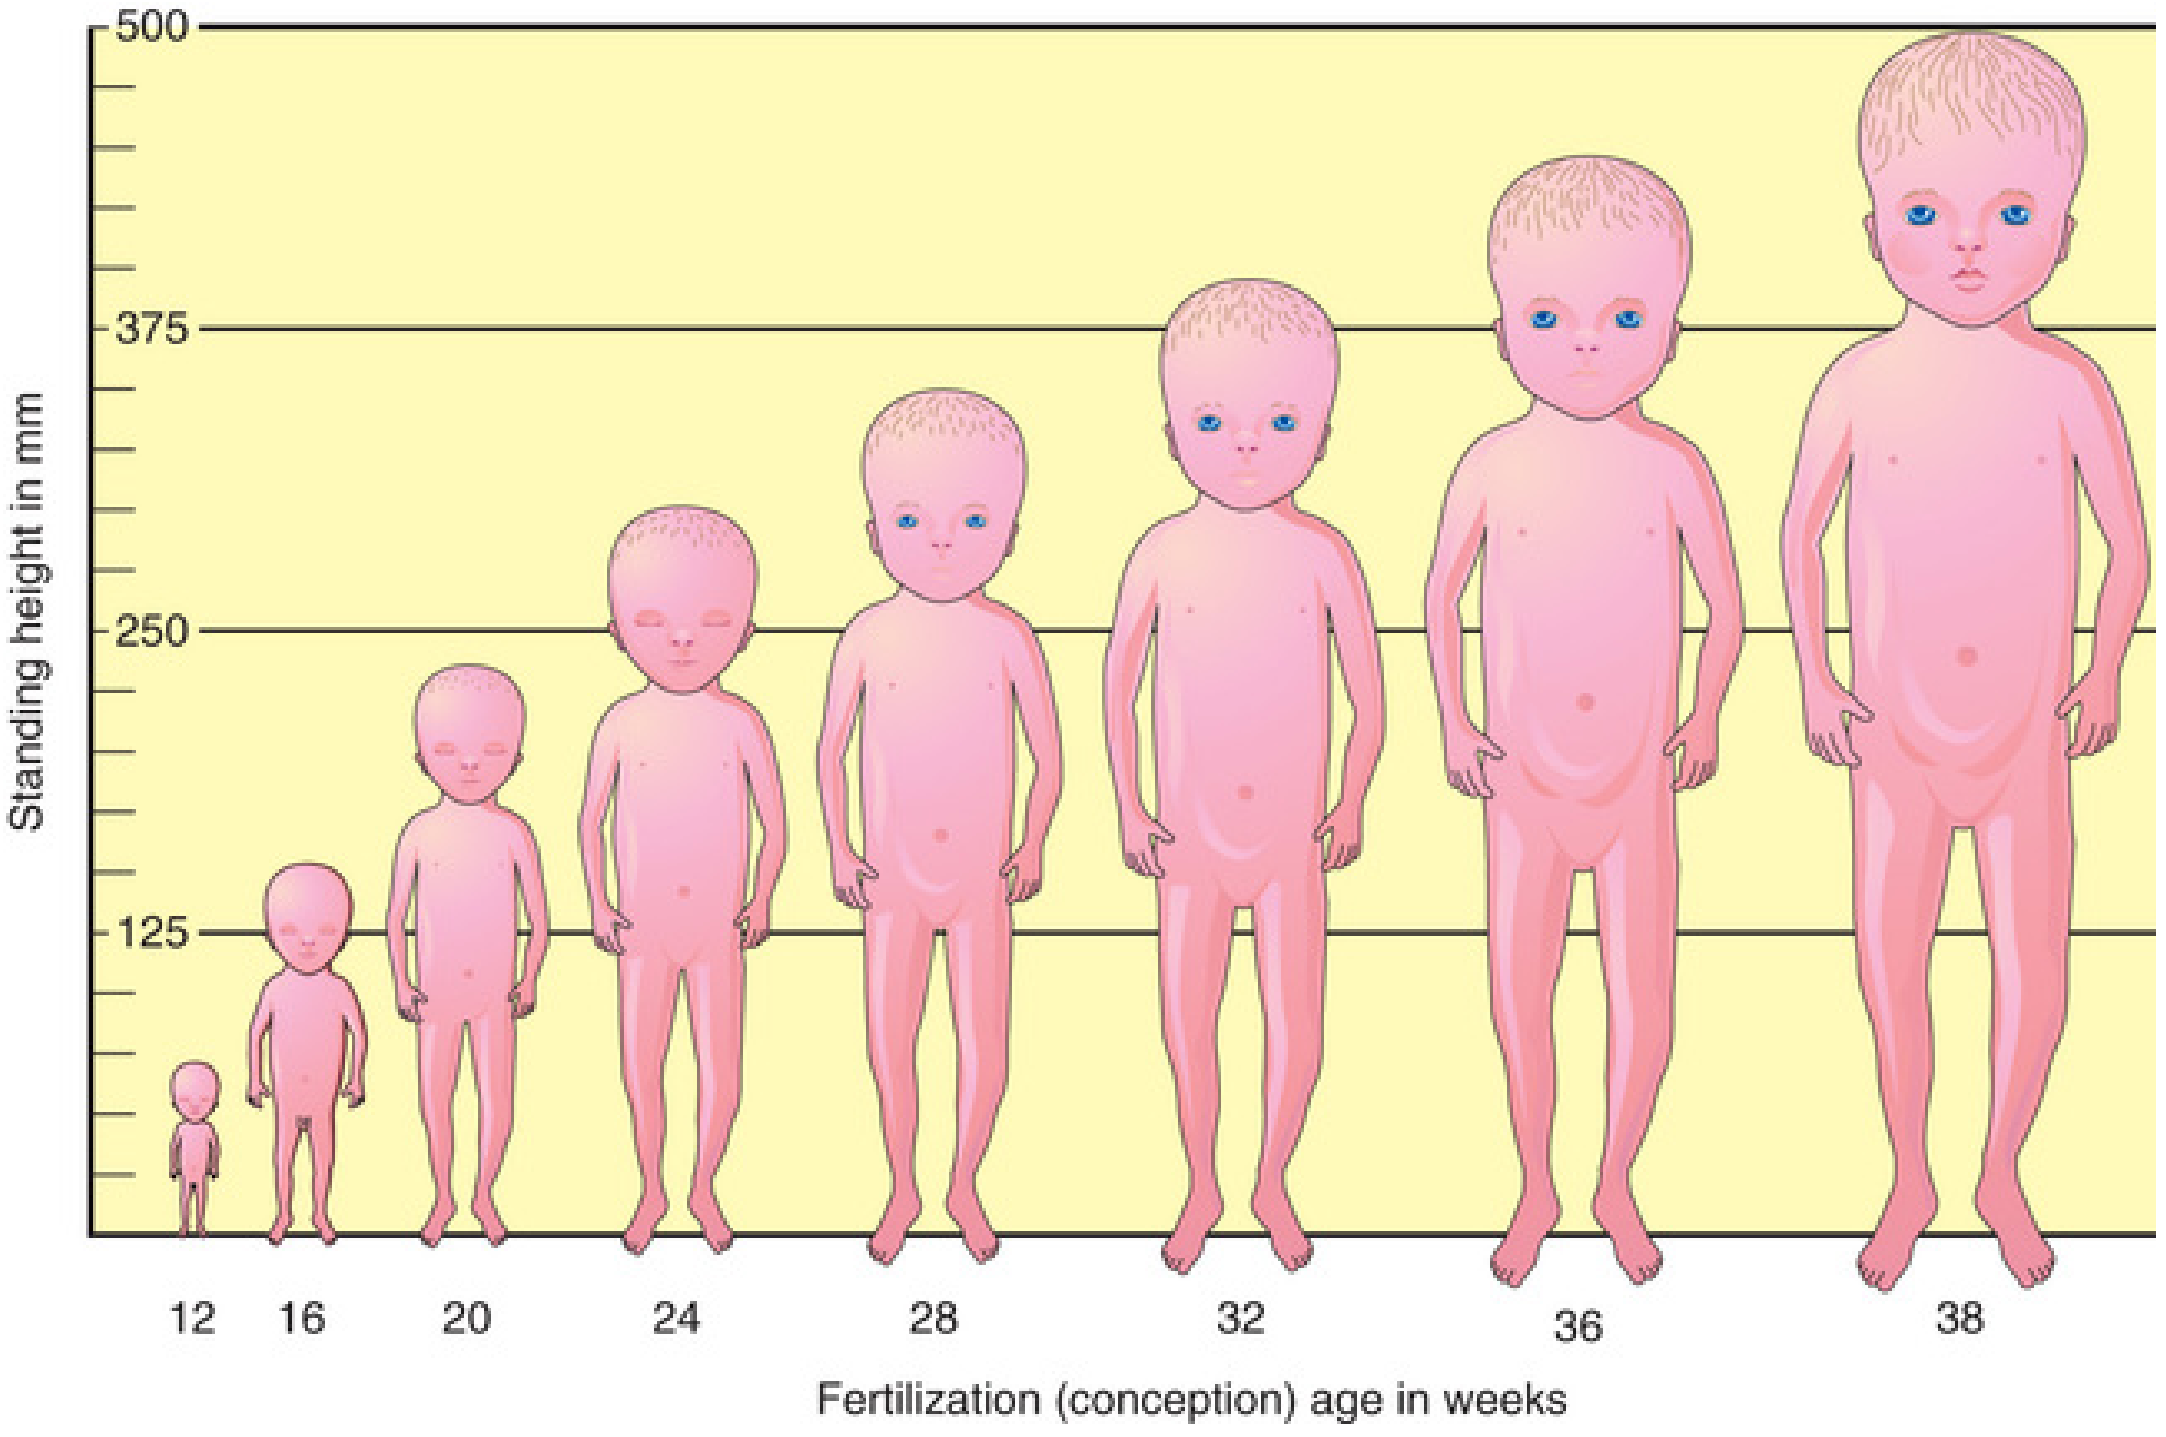
1. Fetal Growth Chart - Size by Week (from The Developing Human, Moore & Persaud)
2. Embryonic & Fetal Periods with Teratogen Sensitivity Windows (from Katzung's Basic & Clinical Pharmacology)
3. Generated Illustration - Week-by-Week Stages
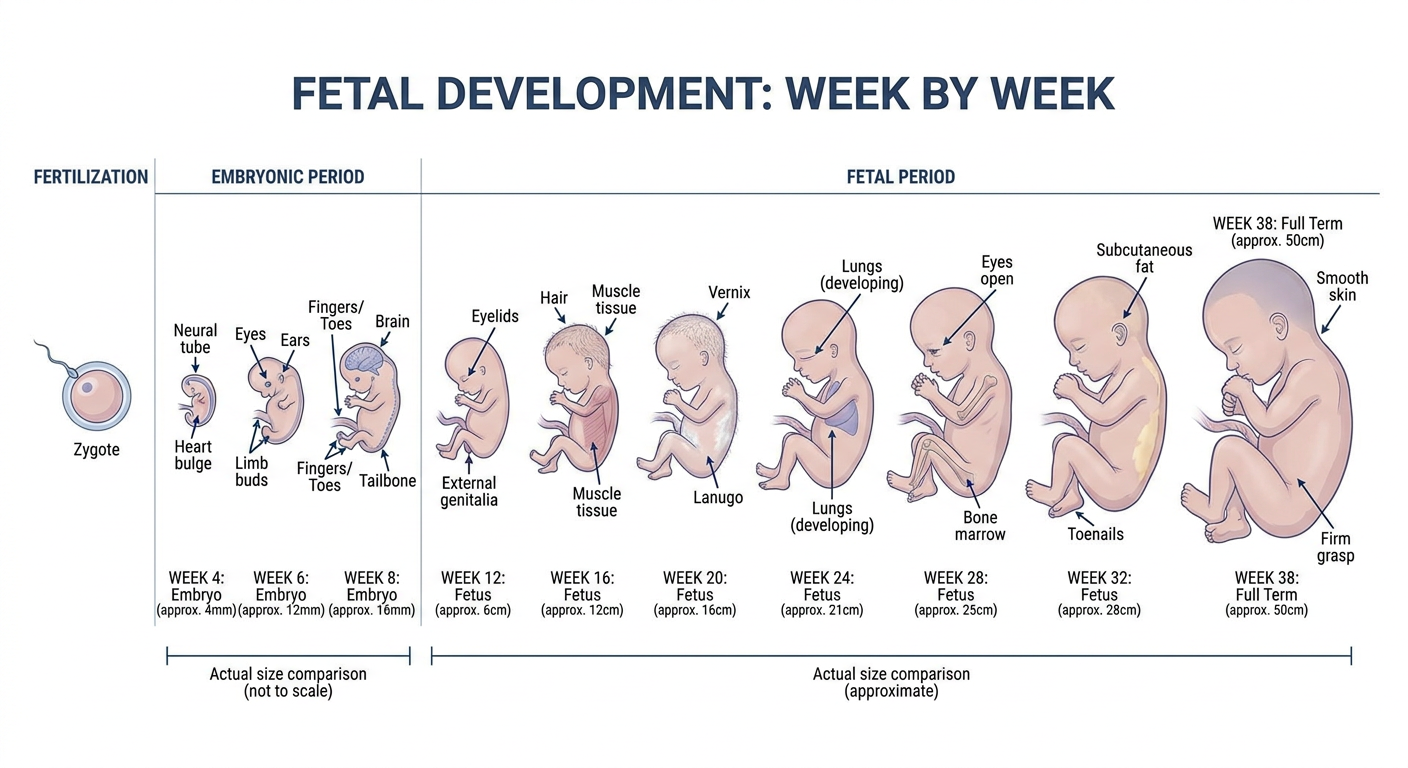
- The embryonic period (weeks 3-8) is when all organs form - highest teratogen risk
- The CNS has the longest sensitive period, stretching all the way to full term
- By week 12, the fetus is recognizably human but the head is still ~50% of total length
- The most dramatic size increase occurs in the third trimester (weeks 28-38)