
Explain 10 common heart diseases with ECG changes & ECG images
common heart diseases ECG changes electrocardiogram findings clinical
ECG images 10 common heart diseases STEMI atrial fibrillation heart block hypertrophy pericarditis
https://litfl.com/ecg-library/diagnosis
10 Common Heart Diseases: ECG Changes & Images
1. ST-Elevation Myocardial Infarction (STEMI)
- Hyperacute phase (minutes): Tall, peaked (hyperacute) T waves - earliest change
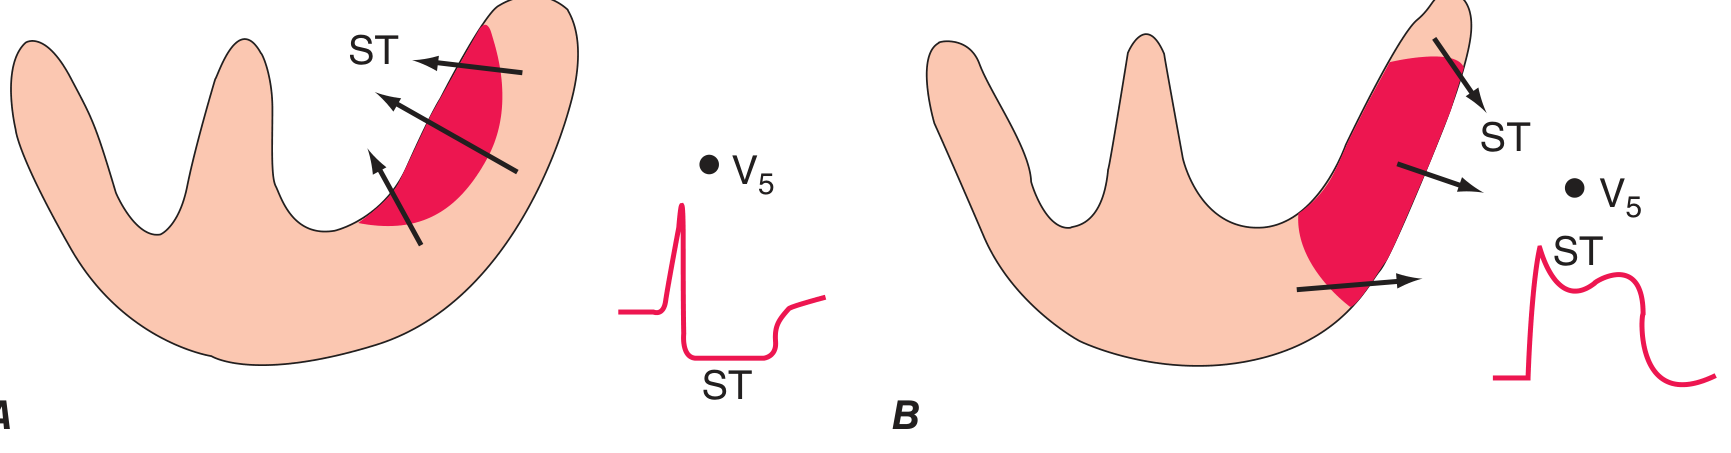
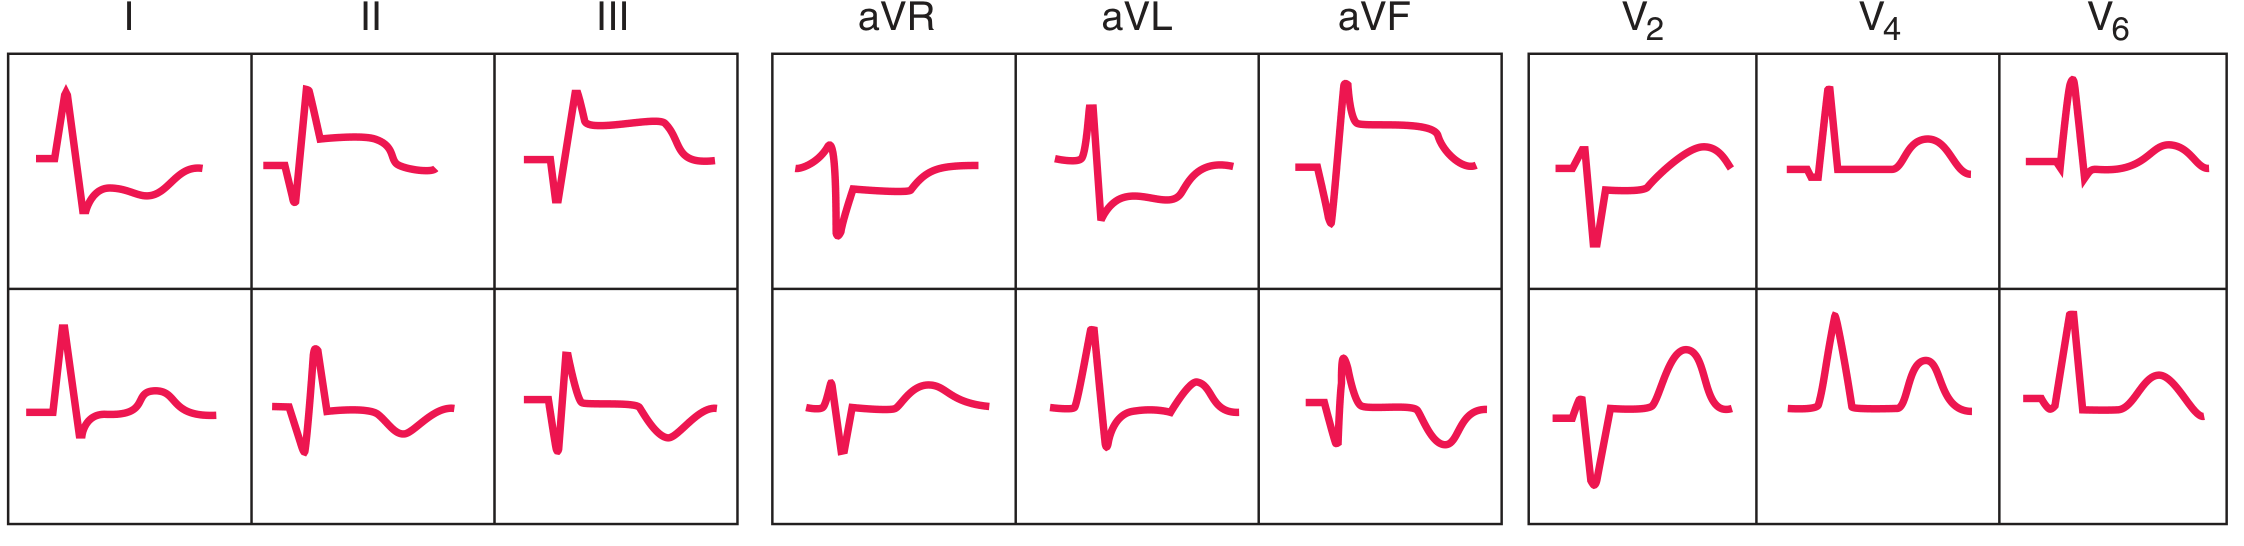
- Acute phase (hours): ST elevation ≥1 mm in ≥2 contiguous limb leads or ≥2 mm in ≥2 contiguous precordial leads; reciprocal ST depression in opposing leads
- Evolving phase (hours-days): Pathological Q waves develop (necrosis marker), T wave inversion
- Chronic phase (weeks-months): Q waves persist; ST may normalize
| Territory | Culprit Artery | ST Elevation | Reciprocal Depression |
|---|---|---|---|
| Anterior | LAD | V1-V4 | II, III, aVF |
| Inferior | RCA/LCx | II, III, aVF | I, aVL, V1-V4 |
| Lateral | LCx | I, aVL, V5-V6 | V1-V2 |
| Posterior | RCA/LCx | Tall R in V1-V2 | ST depression V1-V3 |
2. Non-ST-Elevation ACS (NSTEMI/Unstable Angina)
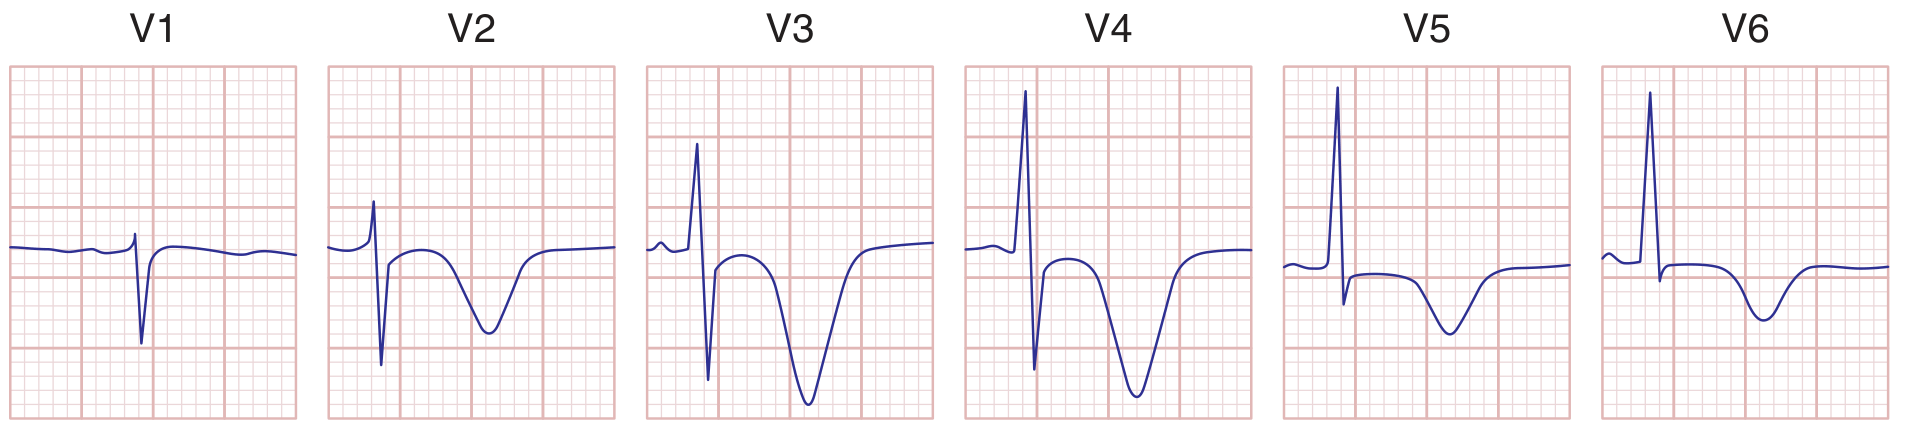
- ST depression (horizontal or downsloping ≥0.5 mm) - most specific for ischemia
- T-wave inversions (symmetric, deep) in involved territory
- Transient ST depression during episodes of chest pain, resolving with relief
- Normal ECG does NOT exclude NSTEMI (diagnosis requires troponin elevation + clinical context)
- No pathological Q waves
- Diffuse deep T-wave inversions across precordium ("Wellens pattern") - indicates high-grade LAD stenosis even at rest
3. Atrial Fibrillation (AF)
- Absent P waves - replaced by irregular, low-amplitude fibrillatory baseline (f-waves)
- Irregularly irregular RR intervals - the hallmark; no two consecutive RR intervals are the same
- Ventricular rate: 110-160/min if uncontrolled; slower with rate control therapy
- Coarse vs. fine fibrillation: Coarse f-waves (≥1mm) common in rheumatic/valvular disease; fine f-waves (<1mm) common in lone AF
- Narrow QRS unless aberrant conduction (bundle branch block) or pre-excitation (WPW)
- In pulmonary hypertension: right axis deviation, R/S ratio >1 in V1, ST depression V1-V3
4. Atrioventricular (AV) Heart Block
| Degree | ECG Findings | Risk |
|---|---|---|
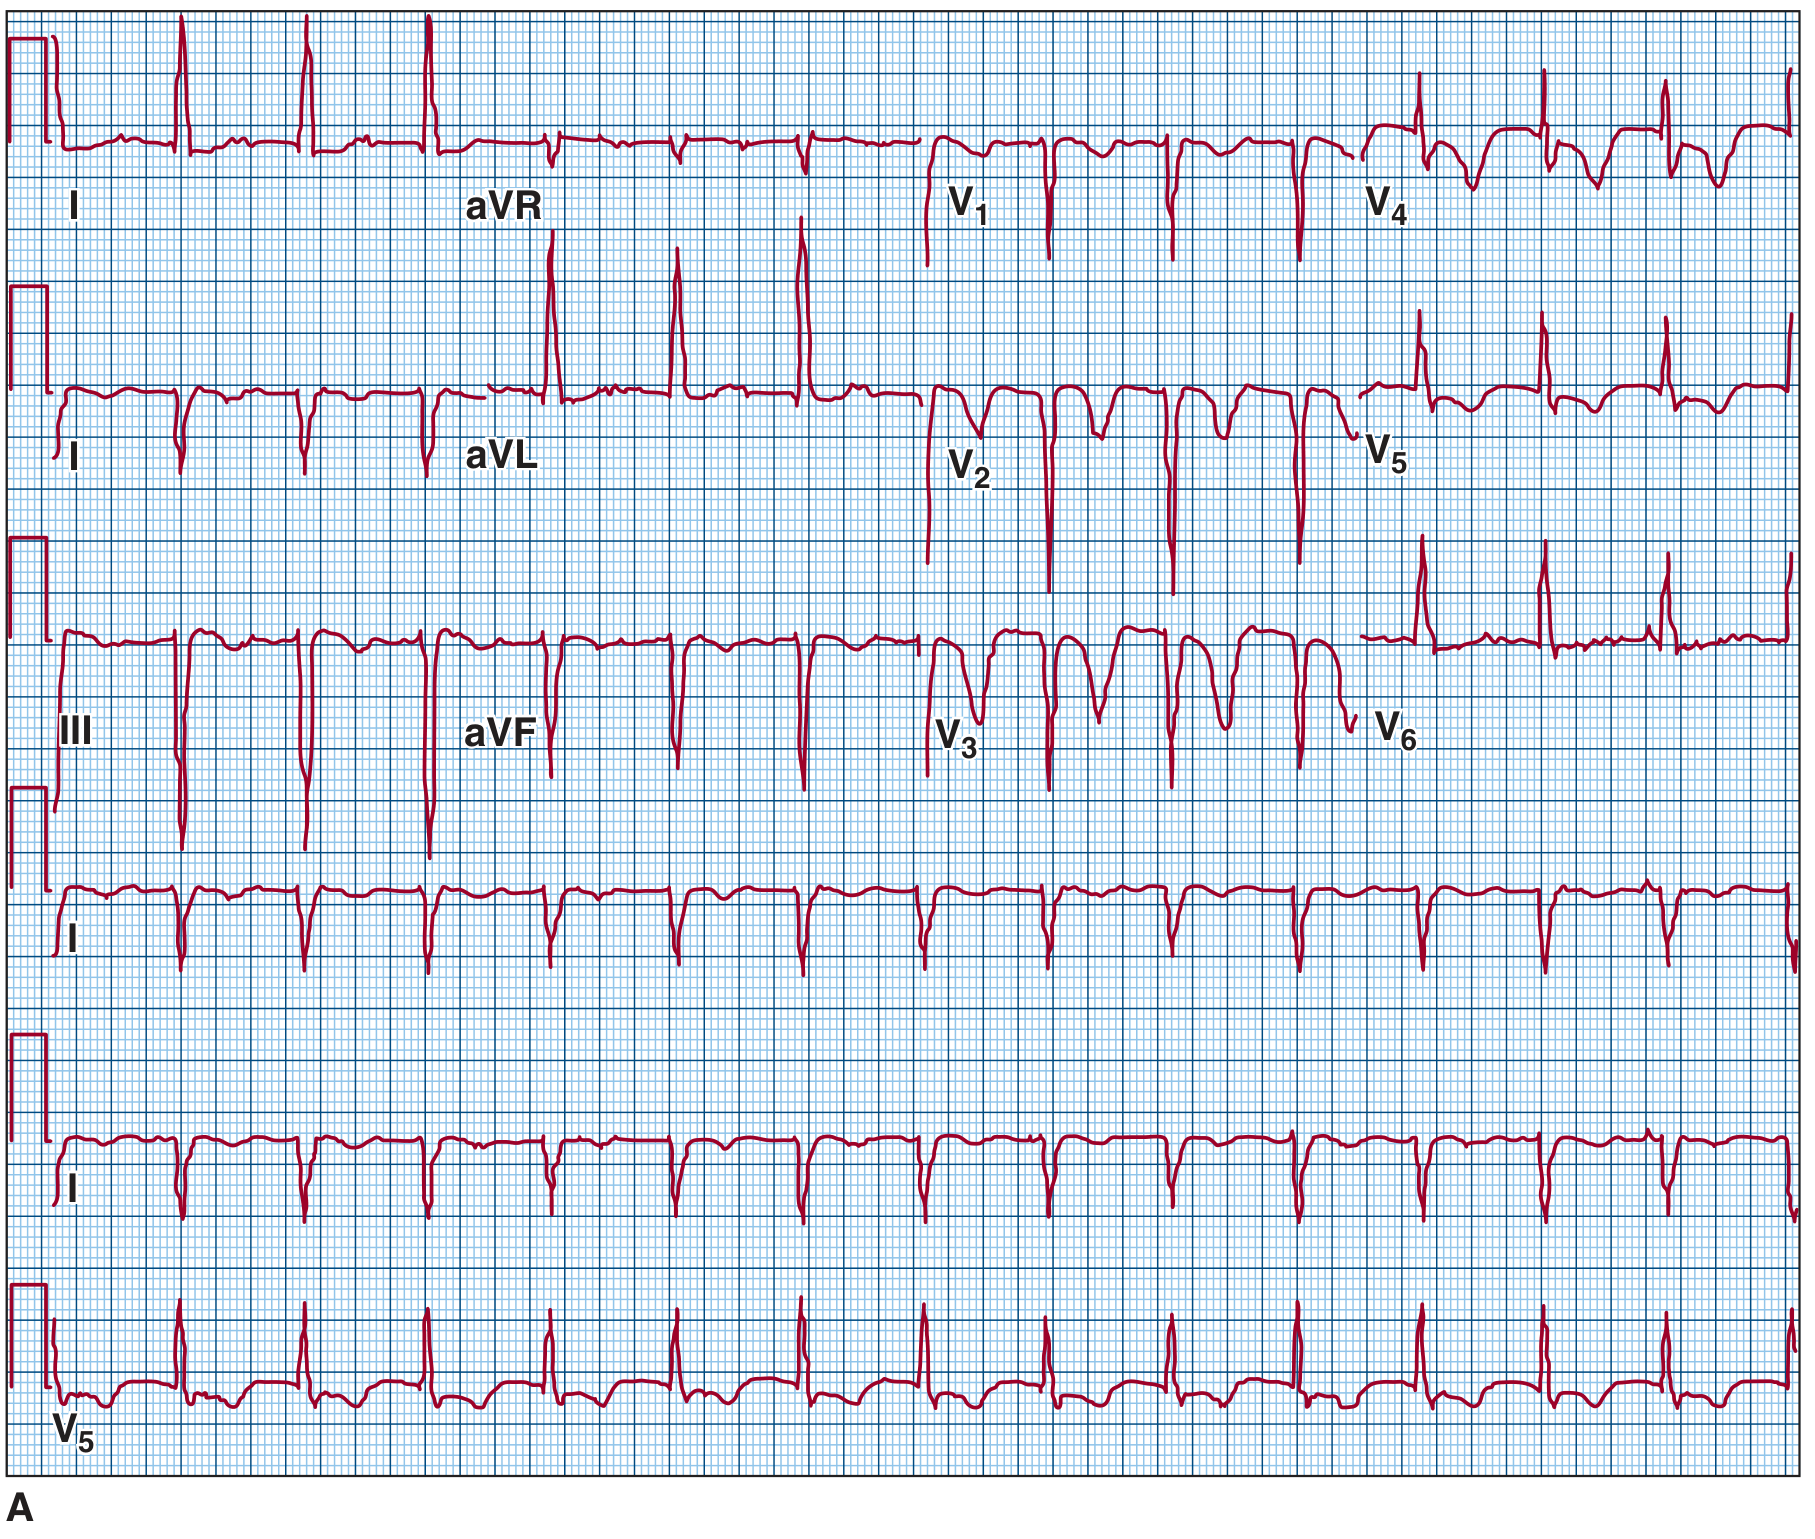
| 1st degree | PR interval >200 ms; all P waves conduct | Benign |
| 2nd degree Mobitz I (Wenckebach) | Progressive PR lengthening → dropped QRS (then cycle restarts) | Usually benign (AV node) |
| 2nd degree Mobitz II | Fixed PR interval + sudden dropped QRS, often with wide QRS | Serious - risk of complete block |
| 3rd degree (Complete block) | Complete AV dissociation; atrial rate > ventricular rate; escape rhythm (narrow = junctional; wide = ventricular) | Life-threatening |
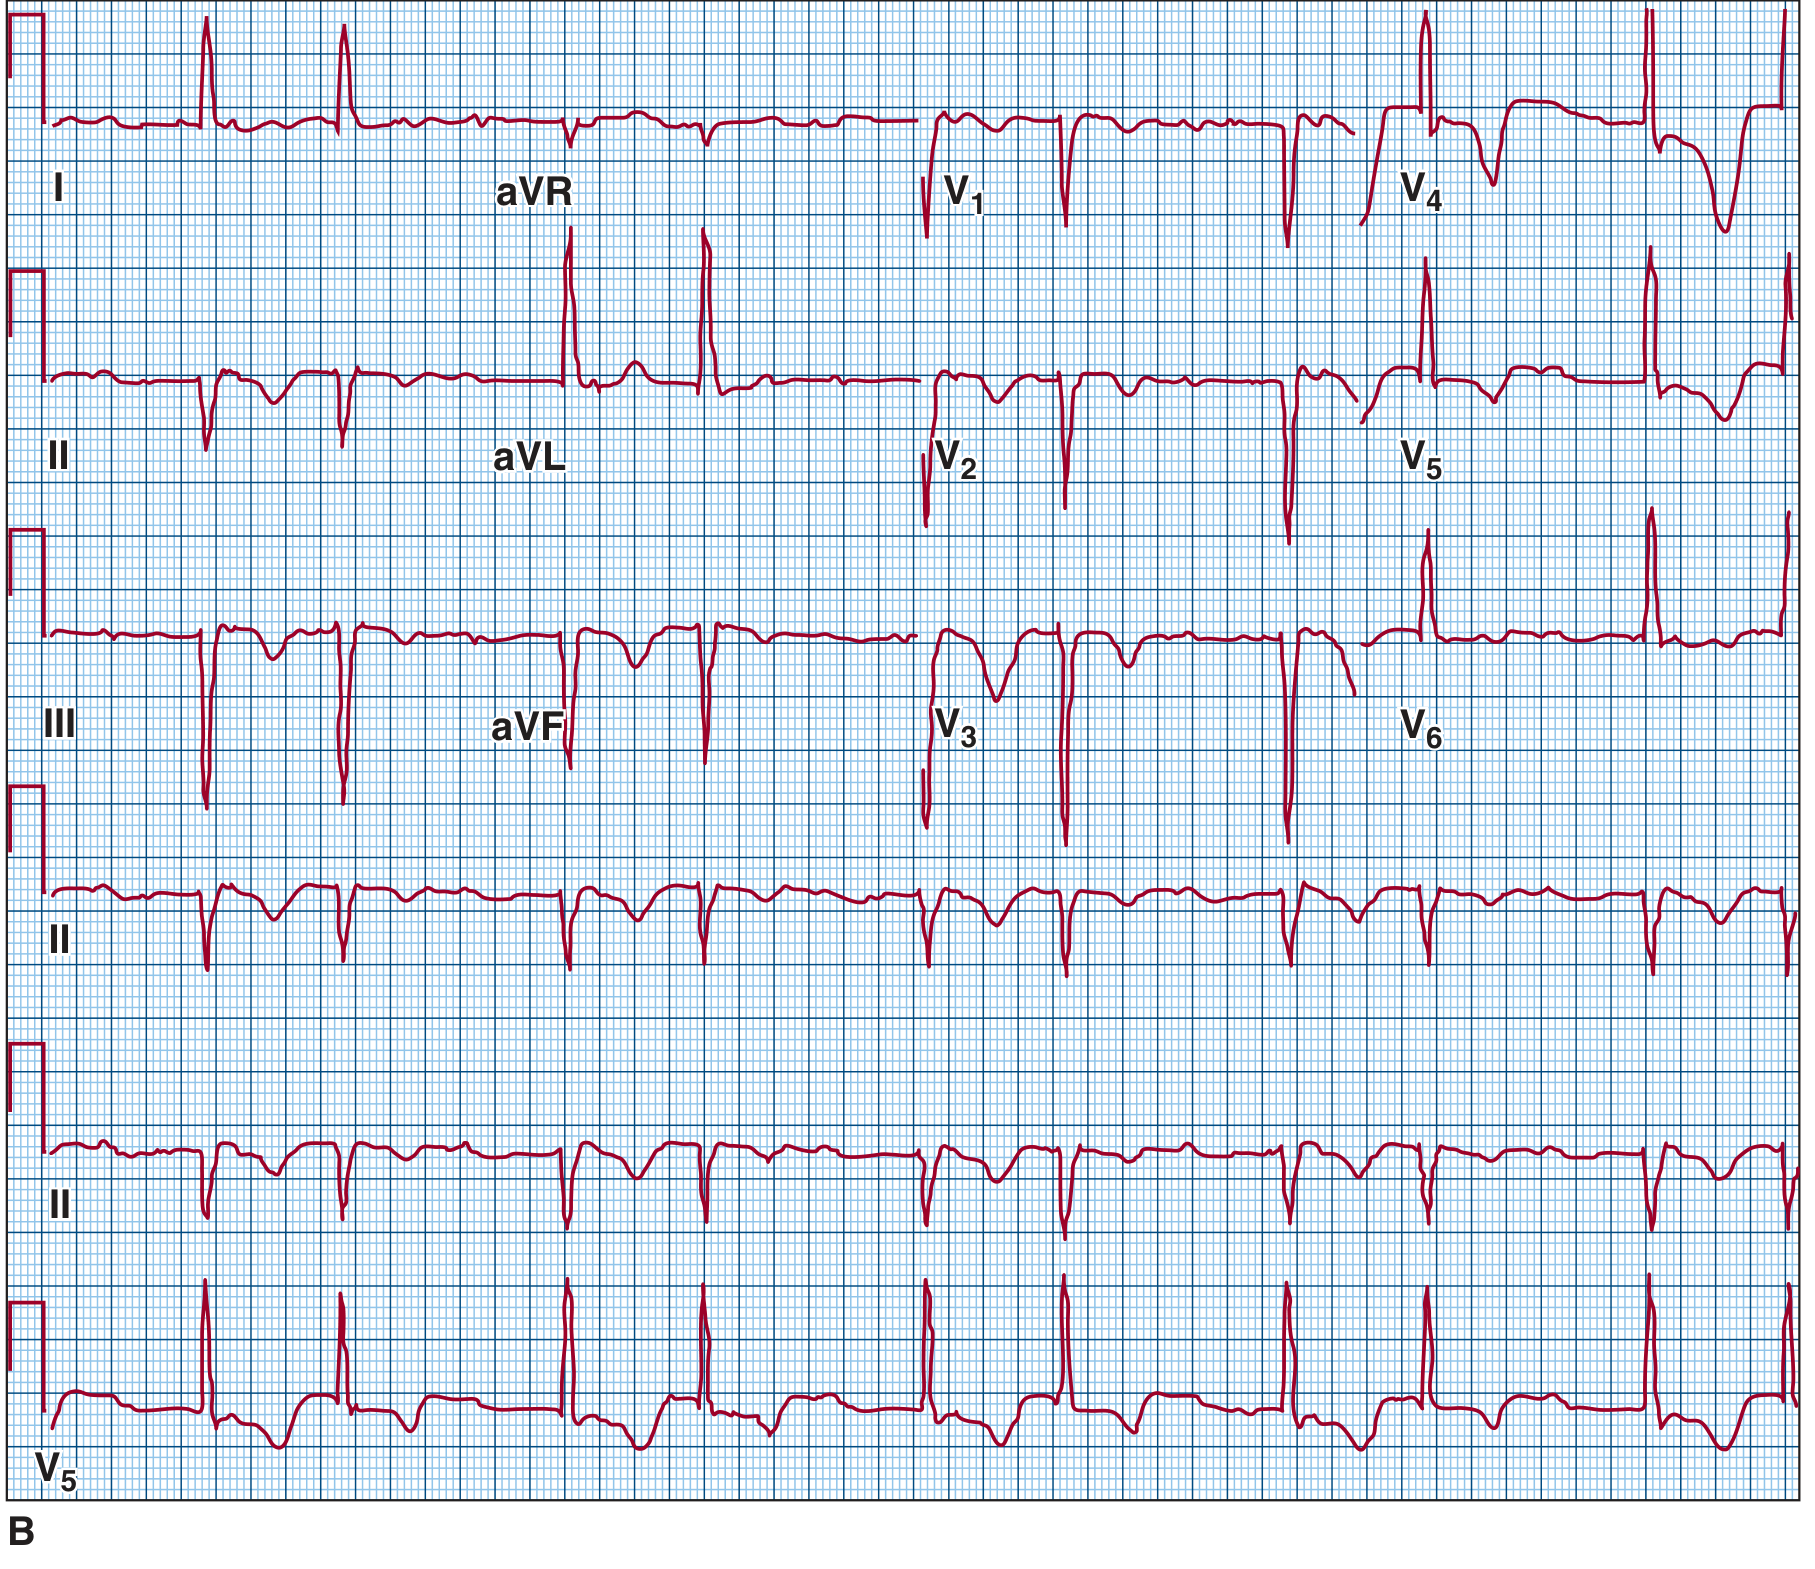
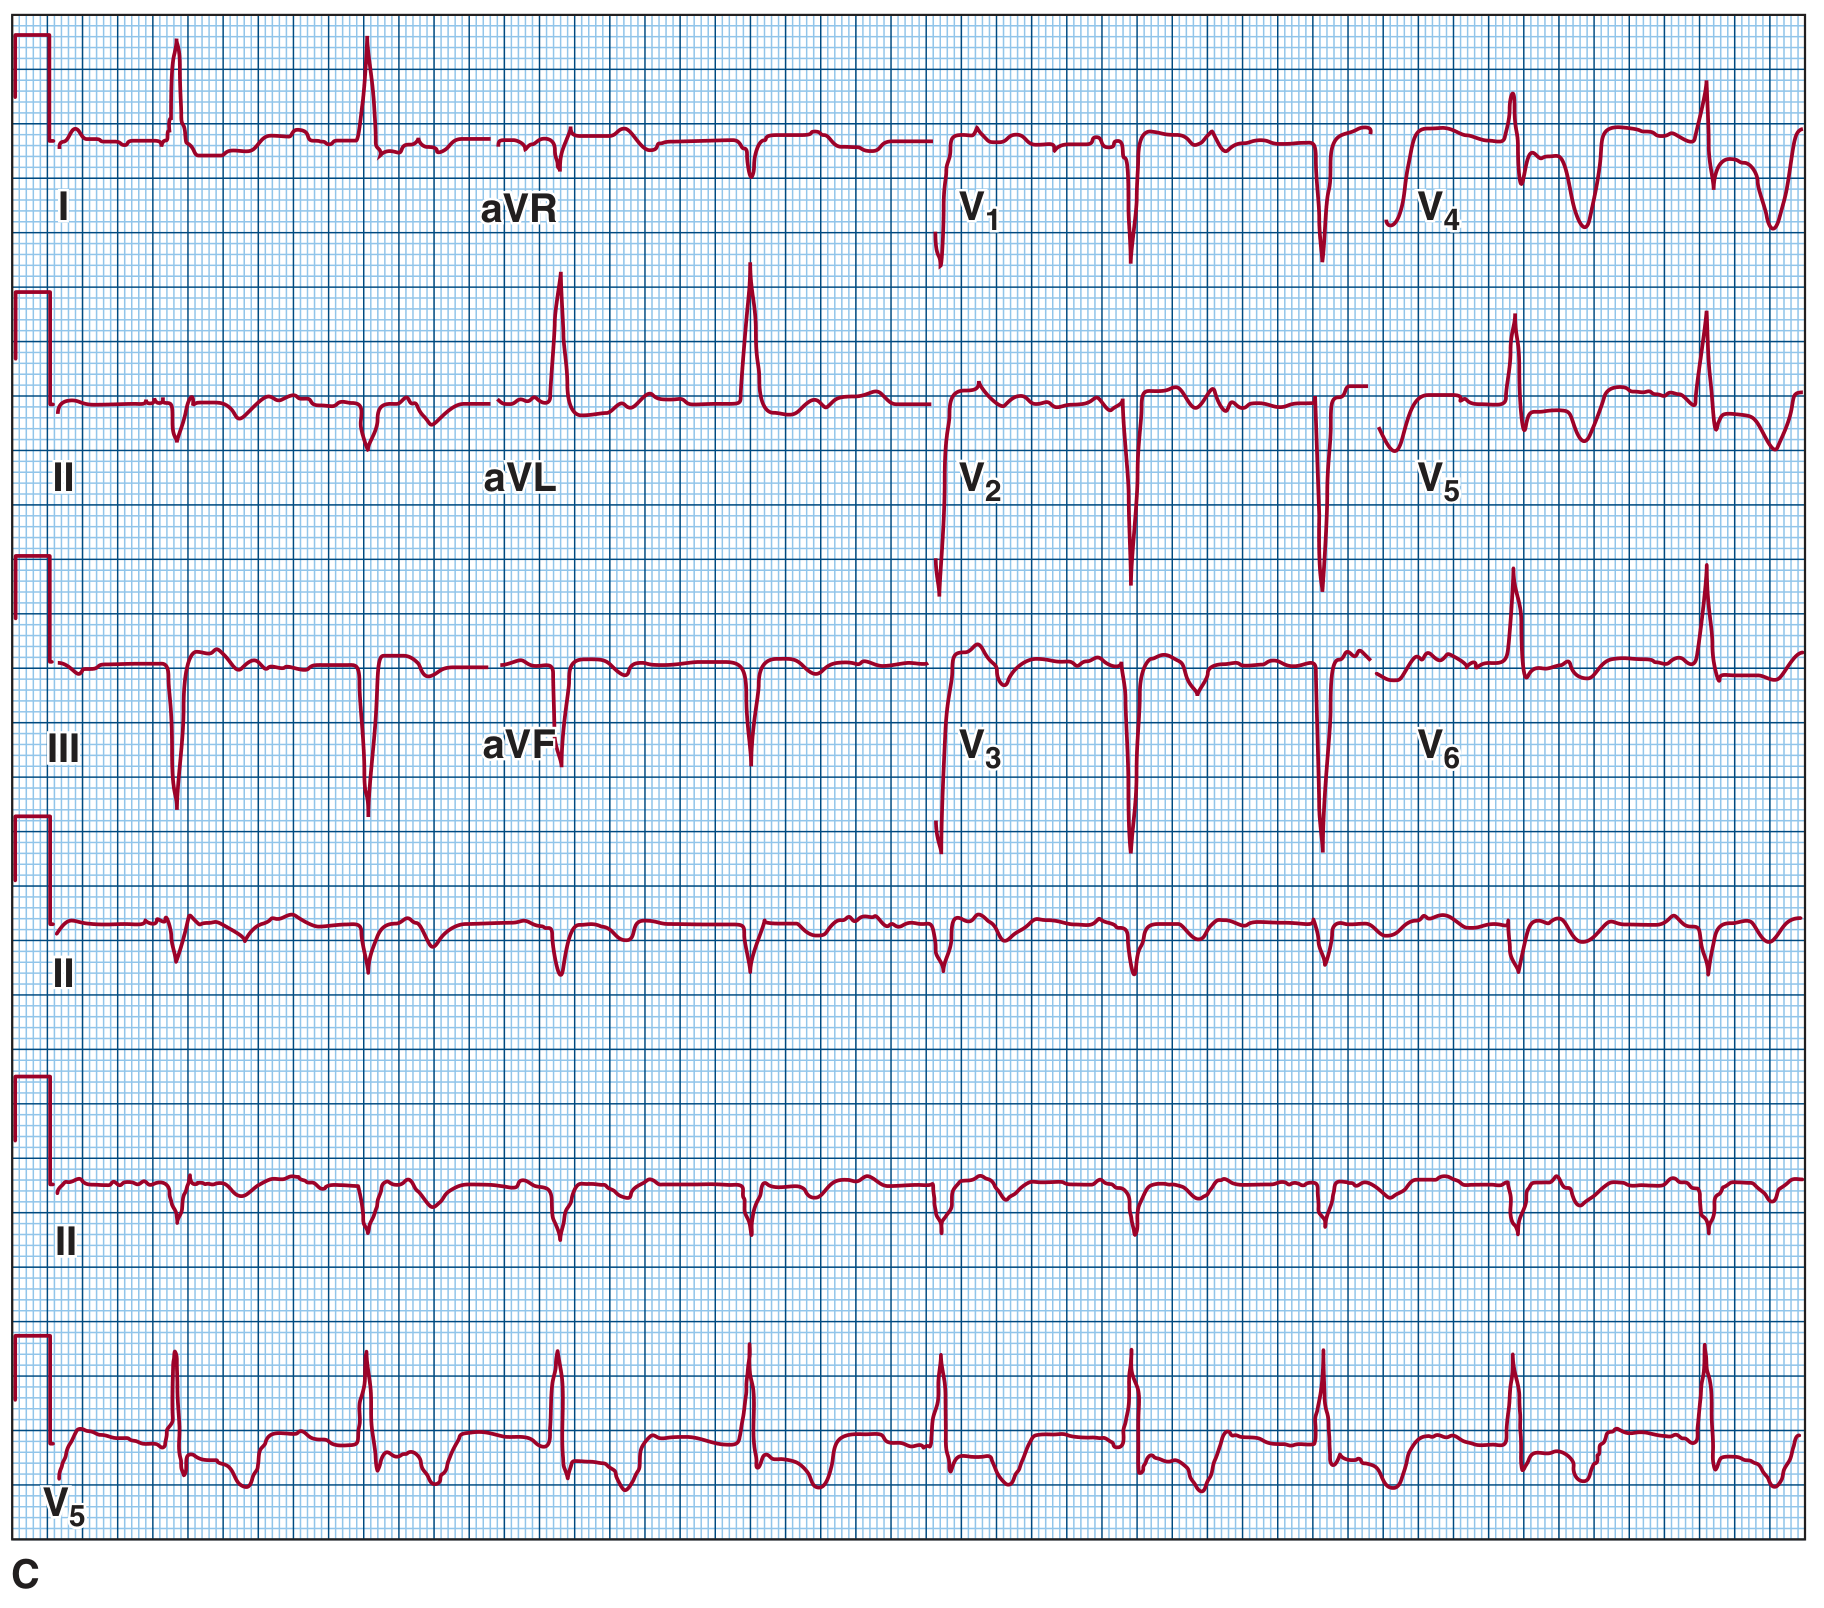

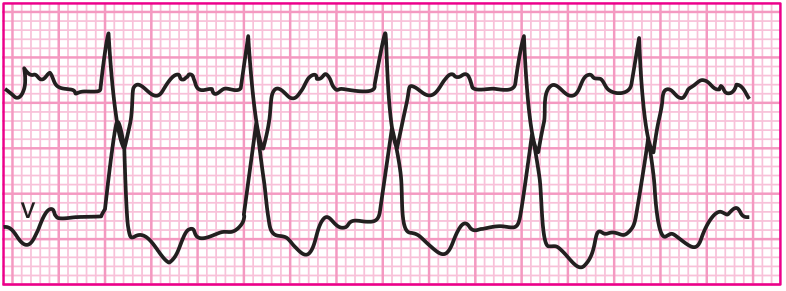
5. Left Ventricular Hypertrophy (LVH)
- Voltage criteria: Sokolow-Lyon: S in V1 + R in V5 or V6 ≥35 mm; or R in aVL ≥11 mm
- Strain pattern: ST depression and asymmetric T-wave inversion in I, aVL, V5-V6 (lateral leads) - reflects "LV strain"
- Left axis deviation: QRS axis <-30° is common
- Prolonged QRS duration (not as wide as bundle branch block, typically 100-120 ms)
- Left atrial enlargement: Broad, notched P waves (P mitrale) - biphasic P in V1 with terminal negative component >1mm depth x 1mm width
- Increased R-wave peak time (intrinsicoid deflection >50 ms in V5-V6)
6. Hypertrophic Cardiomyopathy (HCM)
- LVH voltage criteria - present in most patients
- Septal Q waves: Deep, narrow (<40 ms) Q waves in I, aVL, V5-V6 from abnormal septal depolarization - may mimic inferior/lateral MI but no ST evolution
- Widespread ST depression and T-wave inversions: Can be diffuse
- Left axis deviation
- Giant negative T waves in apical HCM (Yamaguchi syndrome): Deep (>10 mm) symmetric T-wave inversions across precordial leads V3-V6, resembling Wellens but without active ischemia
- WPW pattern: In some hereditary forms (PRKAG2 mutations)
- Atrial fibrillation in advanced/dilated phase
7. Acute Pericarditis
- Stage 1 (days 1-2): Diffuse ST elevation (concave up/"saddle-shaped") in nearly all leads EXCEPT aVR and V1 (which show ST depression); PR depression in II and other leads (pathognomonic); PR elevation in aVR
- Stage 2 (days 3-7): ST returns to baseline; T waves flatten
- Stage 3 (1-3 weeks): T-wave inversions develop diffusely
- Stage 4 (weeks-months): ECG normalizes
- ST elevation is concave (saddle-shaped) not convex
- Diffuse (all leads) not regional
- No reciprocal ST depression (except aVR/V1)
- PR depression is specific for pericarditis
- No pathological Q waves
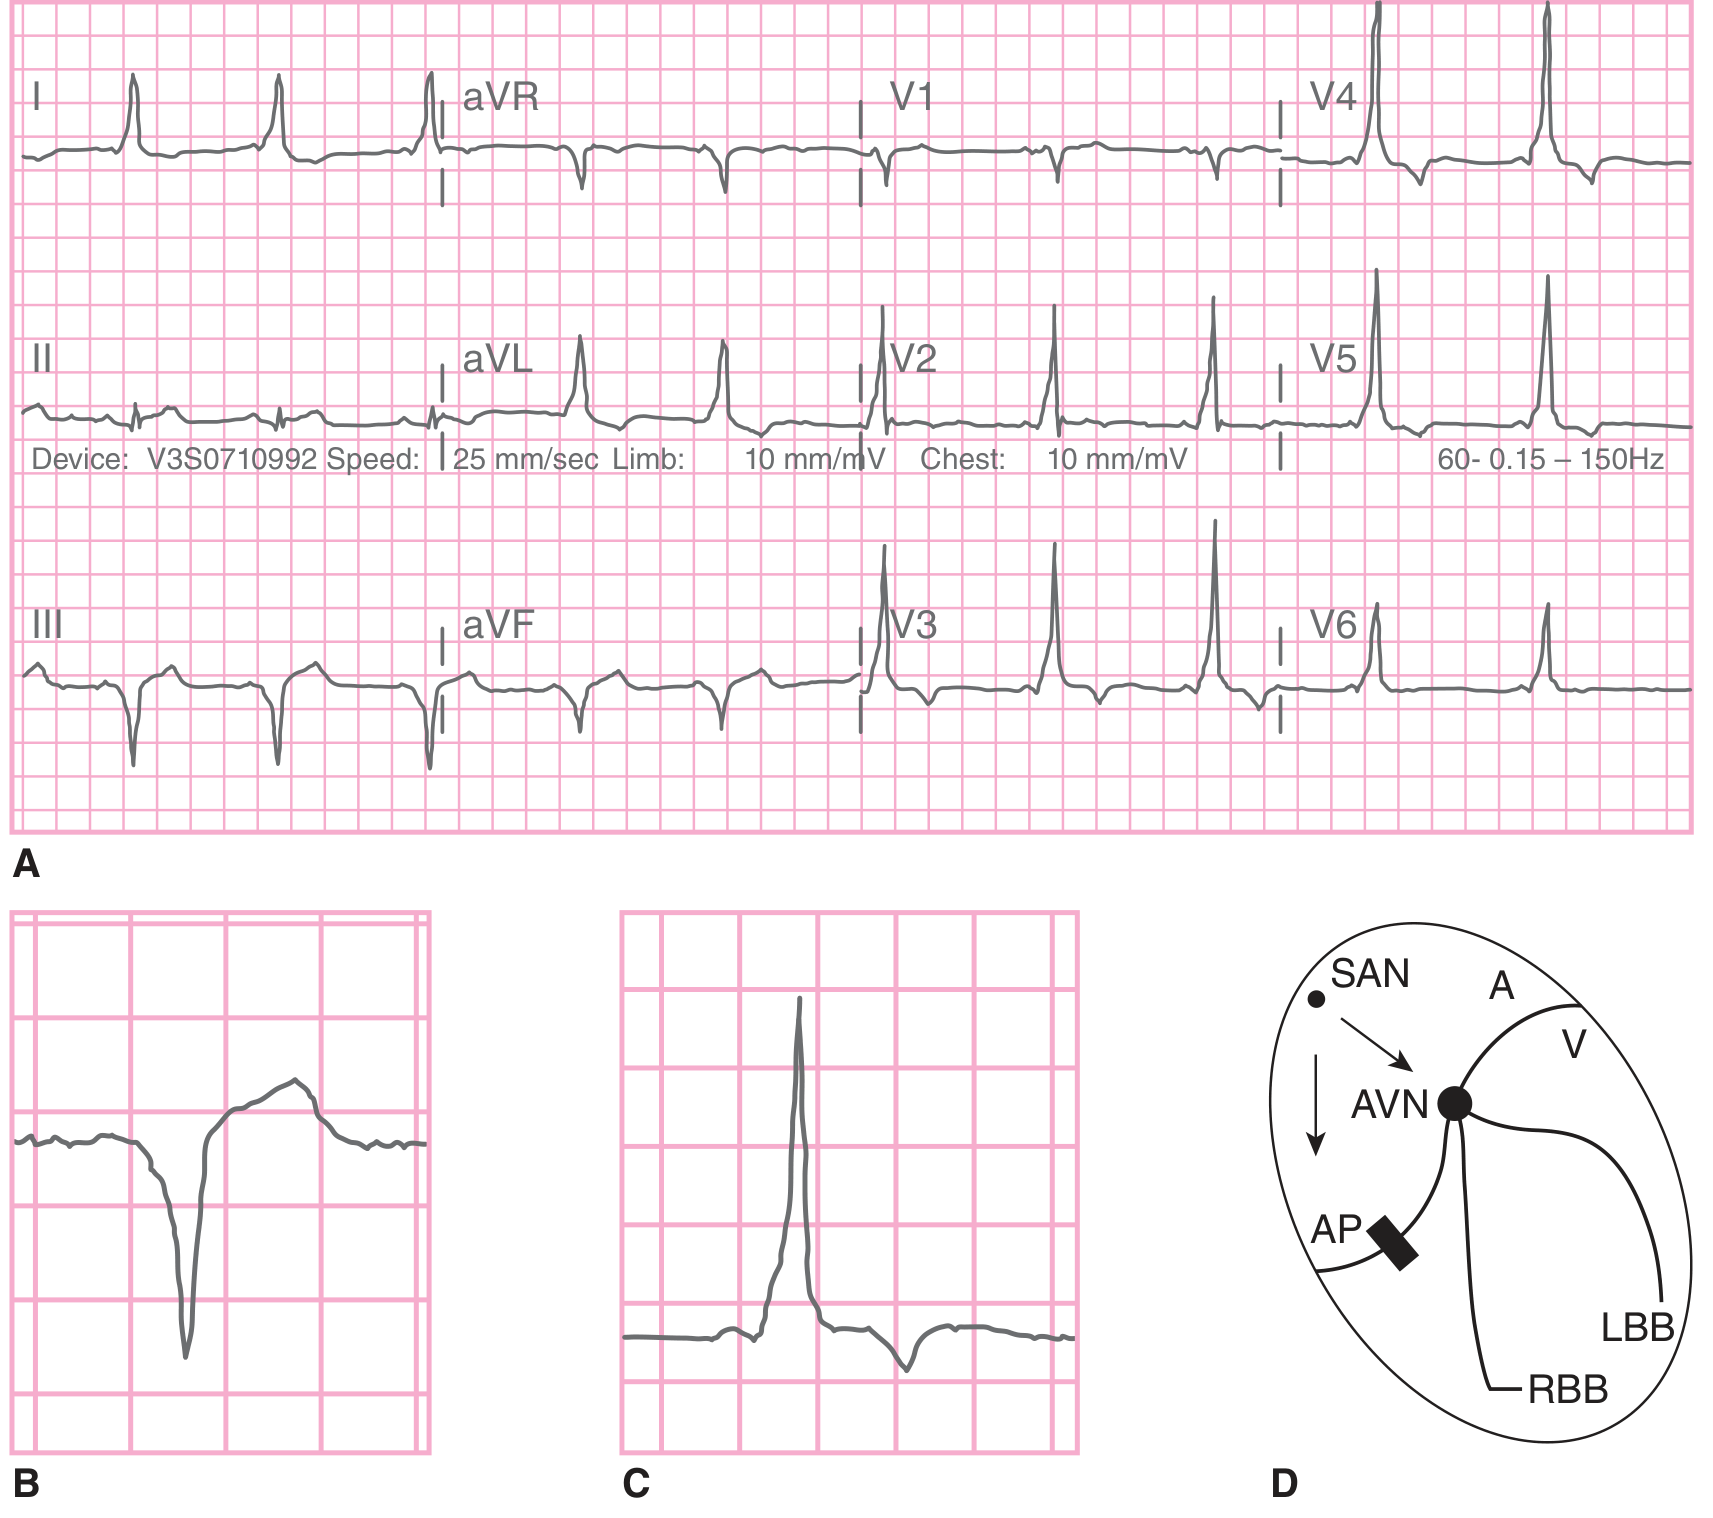
8. Wolff-Parkinson-White (WPW) Syndrome
- Short PR interval (<120 ms) - AV node delay bypassed
- Delta wave - slurred upstroke at the beginning of the QRS (initial part of ventricular pre-excitation)
- Wide QRS (>120 ms) from fusion of accessory pathway + normal conduction
- Secondary ST-T changes - discordant from QRS direction (pseudo-ischemia)
- Pseudo-Q waves - negative delta waves can simulate MI
- During AVRT tachycardia: Narrow complex regular tachycardia (orthodromic) or very rapid wide-complex irregular tachycardia (antidromic/AF - life-threatening)
9. Dilated Cardiomyopathy (DCM)
- Left bundle branch block (LBBB): Very common - wide QRS (>120 ms), broad notched R in I/V5-V6, QS in V1; occurs from conduction system fibrosis
- Left ventricular hypertrophy pattern (may be present despite systolic dysfunction)
- Sinus tachycardia - compensatory
- Poor R-wave progression in precordial leads - reflects lateral wall scarring
- Non-specific ST-T changes widespread
- Pathological Q waves from areas of fibrosis/scarring (without ischemia)
- Low voltage: If associated with cardiac amyloid, sarcoid, or effusion
- Atrial fibrillation - common with progressive disease
- Frequent PVCs / nonsustained VT: From reentrant circuits around fibrotic areas
- No specific diagnostic ECG pattern - diagnosis is echocardiographic
10. Pulmonary Embolism (PE)
- Sinus tachycardia - most common finding (~40% of cases); most sensitive but non-specific
- S1Q3T3 pattern: Deep S wave in lead I + Q wave in lead III + T-wave inversion in lead III - classic but present in only ~20% of cases
- Right heart strain pattern: T-wave inversions in V1-V4 (right precordial leads) ± III, aVF - more sensitive than S1Q3T3
- Right axis deviation - from acute RV pressure/volume load
- New right bundle branch block (RBBB): Complete or incomplete - from RV strain
- P pulmonale: Tall peaked P waves in II >2.5 mm from right atrial dilation
- Atrial fibrillation or flutter (10-35% of cases)
- Low voltage or electrical alternans if associated massive PE with tamponade physiology
- Normal ECG in up to 20% of cases
- Mimics: anterior STEMI (T inversions V1-V4), inferior MI (S1Q3T3)
Summary Table
| Condition | Key ECG Findings | Most Specific Sign |
|---|---|---|
| STEMI | Regional ST elevation, Q waves, reciprocal depression | ST elevation in ≥2 contiguous leads |
| NSTEMI/UA | ST depression, T inversions; no ST elevation | Horizontal/downsloping ST depression |
| Atrial Fibrillation | Absent P waves, irregularly irregular RR | Irregularly irregular narrow complex |
| AV Block | PR prolongation / dropped QRS / AV dissociation | 3rd degree: P and QRS independent |
| LVH | High voltage, lateral strain, LAE | Sokolow-Lyon ≥35 mm + strain |
| HCM | LVH + septal Q waves; giant T inversions (apical) | Deep narrow Q in I, aVL, V5-V6 |
| Acute Pericarditis | Diffuse saddle ST, PR depression | PR depression in II + diffuse ST |
| WPW | Short PR, delta wave, wide QRS | Delta wave + short PR |
| DCM | LBBB, low voltage, AF, PVCs | New LBBB + cardiomegaly |
| Pulmonary Embolism | Sinus tach, S1Q3T3, RV strain V1-V4 | New RBBB + right precordial T inversions |
- Harrison's Principles of Internal Medicine 22E (2025), Ch. 247, 252
- Fuster and Hurst's The Heart, 15th Edition, Ch. 33
- Tintinalli's Emergency Medicine: A Comprehensive Study Guide, Ch. 18
- Braunwald's Heart Disease, 2-Vol Set
- Goldman-Cecil Medicine International Edition
Create a visual summary PDF: ECG patterns comparison chart for all 10 diseases
ls -la /home/daytona/workspace/ 2>/dev/null || echo "workspace empty or missing"
mkdir -p /home/daytona/workspace/ecg-pdf && python3 -c "import reportlab; print('reportlab ok')" && python3 -c "import matplotlib; print('matplotlib ok')"
~/ecg-pdf/generate_ecg_pdf.py
"""
ECG Patterns Comparison Chart - 10 Common Heart Diseases
Visual summary PDF generated with matplotlib + reportlab
"""

import numpy as np
import matplotlib
matplotlib.use('Agg')
import matplotlib.pyplot as plt
import matplotlib.patches as mpatches
from matplotlib.patches import FancyArrowPatch
import io
import os

from reportlab.lib.pagesizes import A4, landscape
from reportlab.lib import colors
from reportlab.lib.units import mm, cm
from reportlab.lib.styles import getSampleStyleSheet, ParagraphStyle
from reportlab.lib.enums import TA_CENTER, TA_LEFT, TA_RIGHT
from reportlab.platypus import (SimpleDocTemplate, Paragraph, Spacer, Table,
                                 TableStyle, Image, HRFlowable, PageBreak,
                                 KeepTogether)
from reportlab.graphics.shapes import Drawing, Rect, String
from reportlab.pdfgen import canvas
from reportlab.platypus.flowables import Flowable

OUTPUT = "/home/daytona/workspace/ecg-pdf/ECG_Patterns_Comparison.pdf"

# ─── COLOR PALETTE ────────────────────────────────────────────────────────────
DARK_NAVY   = colors.HexColor("#0D1B2A")
NAVY        = colors.HexColor("#1B2A4A")
TEAL        = colors.HexColor("#00897B")
TEAL_LIGHT  = colors.HexColor("#4DB6AC")
RED         = colors.HexColor("#C62828")
RED_LIGHT   = colors.HexColor("#EF9A9A")
AMBER       = colors.HexColor("#F57F17")
AMBER_LIGHT = colors.HexColor("#FFE082")
GREEN       = colors.HexColor("#2E7D32")
GREEN_LIGHT = colors.HexColor("#A5D6A7")
PURPLE      = colors.HexColor("#6A1B9A")
PURPLE_LIGHT= colors.HexColor("#CE93D8")
BLUE        = colors.HexColor("#1565C0")
BLUE_LIGHT  = colors.HexColor("#90CAF9")
PINK        = colors.HexColor("#AD1457")
ORANGE      = colors.HexColor("#E65100")
ORANGE_LIGHT= colors.HexColor("#FFCC80")
GREY_DARK   = colors.HexColor("#37474F")
GREY        = colors.HexColor("#78909C")
GREY_LIGHT  = colors.HexColor("#ECEFF1")
WHITE       = colors.white
ECG_GRID    = colors.HexColor("#FFCDD2")   # pink ECG paper
ECG_LINE    = colors.HexColor("#1A237E")   # dark blue trace

# ─── ECG WAVEFORM GENERATORS ─────────────────────────────────────────────────

def ecg_grid_bg(ax, color='#FFEBEE'):
    ax.set_facecolor(color)
    # major grid every 5 small squares (0.2s / 0.5mV)
    ax.set_xlim(0, 4.0)
    ax.set_ylim(-1.5, 2.5)
    for x in np.arange(0, 4.05, 0.2):
        lw = 0.8 if abs(x % 1.0) < 0.01 else 0.3
        ax.axvline(x, color='#EF9A9A', lw=lw, zorder=0)
    for y in np.arange(-1.5, 2.55, 0.1):
        lw = 0.8 if abs(y % 0.5) < 0.01 else 0.3
        ax.axhline(y, color='#EF9A9A', lw=lw, zorder=0)
    ax.set_xticks([])
    ax.set_yticks([])
    for spine in ax.spines.values():
        spine.set_visible(False)

def gaussian(x, mu, sigma, amp):
    return amp * np.exp(-0.5 * ((x - mu) / sigma)**2)

def make_t(x, peak_x, width=0.07, amp=0.3):
    return gaussian(x, peak_x, width, amp)

def make_p(x, peak_x, width=0.04, amp=0.15):
    return gaussian(x, peak_x, width, amp)

def make_qrs(x, q_x, r_x, s_x, q_amp=-0.15, r_amp=1.2, s_amp=-0.3):
    return (gaussian(x, q_x, 0.012, q_amp) +
            gaussian(x, r_x, 0.018, r_amp) +
            gaussian(x, s_x, 0.015, s_amp))

def normal_beat(x_offset=0.0):
    x = np.linspace(x_offset, x_offset + 0.8, 500)
    y = np.zeros_like(x)
    lx = x - x_offset
    y += make_p(lx, 0.12)
    y += make_qrs(lx, 0.26, 0.30, 0.34)
    y += make_t(lx, 0.52)
    return x, y

# ── 1. STEMI ──────────────────────────────────────────────────────────────────
def draw_stemi(ax):
    ecg_grid_bg(ax)
    x = np.linspace(0, 4.0, 2000)
    y = np.zeros_like(x)
    for beat_x in [0.2, 1.2, 2.2, 3.2]:
        lx = x - beat_x
        mask = (lx >= 0) & (lx <= 0.9)
        y[mask] += make_p(lx[mask], 0.10)
        # Pathological Q
        y[mask] += gaussian(lx[mask], 0.22, 0.018, -0.45)
        # R wave (smaller - loss of R)
        y[mask] += gaussian(lx[mask], 0.27, 0.018, 0.7)
        # S wave
        y[mask] += gaussian(lx[mask], 0.32, 0.015, -0.2)
        # ST ELEVATION - convex upward
        st_mask = (lx >= 0.30) & (lx <= 0.55)
        y[mask & st_mask] += 0.6 * np.sin(np.pi * (lx[mask & st_mask] - 0.30) / 0.25)
        # T wave (tall)
        y[mask] += gaussian(lx[mask], 0.60, 0.08, 0.55)
    ax.plot(x, y, color='#B71C1C', lw=1.8, zorder=5)
    ax.axhline(0.0, color='#37474F', lw=0.6, ls='--', alpha=0.5)
    ax.annotate('ST ↑', xy=(0.85, 0.62), fontsize=7, color='#B71C1C', fontweight='bold')
    ax.annotate('Q', xy=(0.40, -0.5), fontsize=7, color='#B71C1C', fontweight='bold')
    ax.set_title('STEMI', fontsize=9, fontweight='bold', color='#B71C1C', pad=2)

# ── 2. NSTEMI ─────────────────────────────────────────────────────────────────
def draw_nstemi(ax):
    ecg_grid_bg(ax)
    x = np.linspace(0, 4.0, 2000)
    y = np.zeros_like(x)
    for beat_x in [0.2, 1.2, 2.2, 3.2]:
        lx = x - beat_x
        mask = (lx >= 0) & (lx <= 0.9)
        y[mask] += make_p(lx[mask], 0.10)
        y[mask] += make_qrs(lx[mask], 0.24, 0.28, 0.32, q_amp=-0.05, r_amp=1.0, s_amp=-0.25)
        # ST DEPRESSION
        st_mask = (lx >= 0.30) & (lx <= 0.55)
        y[mask & st_mask] -= 0.35
        # T wave inverted
        y[mask] += gaussian(lx[mask], 0.60, 0.08, -0.3)
    ax.plot(x, y, color='#E65100', lw=1.8, zorder=5)
    ax.axhline(0.0, color='#37474F', lw=0.6, ls='--', alpha=0.5)
    ax.annotate('ST ↓', xy=(0.82, -0.42), fontsize=7, color='#E65100', fontweight='bold')
    ax.annotate('T inv', xy=(1.72, -0.38), fontsize=7, color='#E65100', fontweight='bold')
    ax.set_title('NSTEMI / Unstable Angina', fontsize=9, fontweight='bold', color='#E65100', pad=2)

# ── 3. ATRIAL FIBRILLATION ────────────────────────────────────────────────────
def draw_afib(ax):
    ecg_grid_bg(ax, '#F3E5F5')
    x = np.linspace(0, 4.0, 2000)
    y = np.zeros_like(x)
    # Fibrillatory baseline
    np.random.seed(42)
    y += 0.07 * np.sin(2 * np.pi * 8 * x) + 0.05 * np.sin(2 * np.pi * 11.3 * x + 0.5) + \
         0.04 * np.sin(2 * np.pi * 14.7 * x + 1.2)
    # Irregular RR intervals
    beat_times = [0.35, 0.82, 1.52, 1.95, 2.55, 3.15, 3.58]
    for bt in beat_times:
        lx = x - bt
        mask = (lx >= -0.1) & (lx <= 0.6)
        y[mask] += make_qrs(lx[mask], 0.02, 0.06, 0.10, r_amp=1.1)
        y[mask] += make_t(lx[mask], 0.30, width=0.07, amp=0.25)
    ax.plot(x, y, color='#6A1B9A', lw=1.8, zorder=5)
    ax.axhline(0.0, color='#37474F', lw=0.6, ls='--', alpha=0.5)
    ax.annotate('No P waves', xy=(0.05, 0.18), fontsize=7, color='#6A1B9A', fontweight='bold')
    ax.annotate('Irregular RR', xy=(0.05, -0.4), fontsize=7, color='#6A1B9A', fontweight='bold')
    ax.set_title('Atrial Fibrillation', fontsize=9, fontweight='bold', color='#6A1B9A', pad=2)

# ── 4a. FIRST-DEGREE AV BLOCK ─────────────────────────────────────────────────
def draw_1st_avblock(ax):
    ecg_grid_bg(ax, '#E8F5E9')
    x = np.linspace(0, 4.0, 2000)
    y = np.zeros_like(x)
    for beat_x in [0.1, 1.1, 2.1, 3.1]:
        lx = x - beat_x
        mask = (lx >= 0) & (lx <= 0.9)
        y[mask] += make_p(lx[mask], 0.10)
        # prolonged PR = 0.28s (normal <0.20)
        y[mask] += make_qrs(lx[mask], 0.36, 0.40, 0.44, r_amp=1.1)
        y[mask] += make_t(lx[mask], 0.62, amp=0.28)
    ax.plot(x, y, color='#2E7D32', lw=1.8, zorder=5)
    ax.axhline(0.0, color='#37474F', lw=0.6, ls='--', alpha=0.5)
    # Annotate PR interval
    ax.annotate('', xy=(0.50, 1.35), xytext=(0.10, 1.35),
                arrowprops=dict(arrowstyle='<->', color='#2E7D32', lw=1.2))
    ax.text(0.30, 1.5, 'PR > 200ms', fontsize=7, color='#2E7D32', fontweight='bold', ha='center')
    ax.set_title('1st Degree AV Block', fontsize=9, fontweight='bold', color='#2E7D32', pad=2)

# ── 4b. 2ND DEGREE (WENCKEBACH) ───────────────────────────────────────────────
def draw_wenckebach(ax):
    ecg_grid_bg(ax, '#E8F5E9')
    x = np.linspace(0, 4.0, 2000)
    y = np.zeros_like(x)
    # P-P regular; PR progressively longer until drop
    p_times = [0.1, 0.9, 1.7, 2.5, 3.3]
    pr_offsets = [0.18, 0.26, 0.36, None, 0.18]  # None = dropped QRS
    for i, (pt, pr) in enumerate(zip(p_times, pr_offsets)):
        lx = x - pt
        mask = (lx >= 0) & (lx <= 0.5)
        y[mask] += make_p(lx[mask], 0.08, amp=0.18)
        if pr is not None:
            lx2 = x - (pt + pr)
            mask2 = (lx2 >= 0) & (lx2 <= 0.5)
            y[mask2] += make_qrs(lx2[mask2], 0.02, 0.06, 0.10, r_amp=1.0)
            y[mask2] += make_t(lx2[mask2], 0.28, amp=0.22)
    ax.plot(x, y, color='#00838F', lw=1.8, zorder=5)
    ax.axhline(0.0, color='#37474F', lw=0.6, ls='--', alpha=0.5)
    ax.annotate('Dropped\nQRS', xy=(3.3, 0.25), fontsize=6.5, color='#00838F',
                fontweight='bold', ha='center',
                arrowprops=dict(arrowstyle='->', color='#00838F'),
                xytext=(3.3, 1.0))
    ax.text(1.5, 2.1, 'Progressive PR ↑ → Dropped beat', fontsize=7,
            color='#00838F', fontweight='bold', ha='center')
    ax.set_title('2nd Degree AV Block (Wenckebach)', fontsize=9, fontweight='bold', color='#00838F', pad=2)

# ── 4c. COMPLETE HEART BLOCK ──────────────────────────────────────────────────
def draw_complete_block(ax):
    ecg_grid_bg(ax, '#E8F5E9')
    x = np.linspace(0, 4.0, 2000)
    y = np.zeros_like(x)
    # P waves - fast (atrial rate ~80 bpm => 0.75s)
    for pt in np.arange(0.15, 4.0, 0.6):
        lx = x - pt
        mask = (lx >= 0) & (lx <= 0.3)
        y[mask] += make_p(lx[mask], 0.08, amp=0.2)
    # QRS - slow escape rhythm (40 bpm => 1.5s), wide
    for qt in [0.5, 2.0, 3.5]:
        lx = x - qt
        mask = (lx >= 0) & (lx <= 0.8)
        # Wide QRS
        y[mask] += gaussian(lx[mask], 0.10, 0.04, -0.3)
        y[mask] += gaussian(lx[mask], 0.18, 0.04, 0.9)
        y[mask] += gaussian(lx[mask], 0.26, 0.04, -0.35)
        y[mask] += make_t(lx[mask], 0.55, width=0.12, amp=0.4)
    ax.plot(x, y, color='#1B5E20', lw=1.8, zorder=5)
    ax.axhline(0.0, color='#37474F', lw=0.6, ls='--', alpha=0.5)
    ax.text(2.0, 2.15, 'AV Dissociation — P and QRS independent', fontsize=7,
            color='#1B5E20', fontweight='bold', ha='center')
    ax.annotate('P', xy=(0.23, 0.22), fontsize=8, color='#C62828', fontweight='bold')
    ax.annotate('QRS', xy=(0.65, 0.95), fontsize=7, color='#1B5E20', fontweight='bold')
    ax.set_title('3rd Degree (Complete) Heart Block', fontsize=9, fontweight='bold', color='#1B5E20', pad=2)

# ── 5. LVH ────────────────────────────────────────────────────────────────────
def draw_lvh(ax):
    ecg_grid_bg(ax, '#FFF3E0')
    x = np.linspace(0, 4.0, 2000)
    y = np.zeros_like(x)
    for beat_x in [0.2, 1.2, 2.2, 3.2]:
        lx = x - beat_x
        mask = (lx >= 0) & (lx <= 0.9)
        # Broad P (LAE)
        y[mask] += make_p(lx[mask], 0.10, width=0.06, amp=0.22)
        # Tall R wave (LVH)
        y[mask] += make_qrs(lx[mask], 0.24, 0.28, 0.32, r_amp=2.1, s_amp=-0.15)
        # Strain - ST depression + asymmetric T inversion
        st_mask = (lx >= 0.30) & (lx <= 0.70)
        y[mask & st_mask] -= 0.28 * (1 - np.exp(-8 * (lx[mask & st_mask] - 0.30)))
        # Asymmetric T inversion
        y[mask] += gaussian(lx[mask], 0.62, 0.055, -0.25)
    ax.plot(x, y, color='#E65100', lw=1.8, zorder=5)
    ax.axhline(0.0, color='#37474F', lw=0.6, ls='--', alpha=0.5)
    ax.annotate('Tall R\n(>2.0mV)', xy=(0.43, 2.15), fontsize=6.5, color='#E65100',
                fontweight='bold', ha='center')
    ax.annotate('Strain\npattern', xy=(1.05, -0.42), fontsize=6.5, color='#E65100',
                fontweight='bold', ha='center')
    ax.set_ylim(-1.5, 2.5)
    ax.set_title('Left Ventricular Hypertrophy (LVH)', fontsize=9, fontweight='bold', color='#E65100', pad=2)

# ── 6. HCM ────────────────────────────────────────────────────────────────────
def draw_hcm(ax):
    ecg_grid_bg(ax, '#FFF3E0')
    x = np.linspace(0, 4.0, 2000)
    y = np.zeros_like(x)
    for beat_x in [0.2, 1.2, 2.2, 3.2]:
        lx = x - beat_x
        mask = (lx >= 0) & (lx <= 0.9)
        y[mask] += make_p(lx[mask], 0.10, amp=0.2)
        # Septal Q wave (deep narrow)
        y[mask] += gaussian(lx[mask], 0.23, 0.012, -0.55)
        # LVH tall R
        y[mask] += gaussian(lx[mask], 0.29, 0.018, 1.9)
        y[mask] += gaussian(lx[mask], 0.34, 0.013, -0.2)
        # ST depression + deep T inversion (giant negative T in HCM)
        y[mask] += gaussian(lx[mask], 0.60, 0.09, -0.7)
    ax.plot(x, y, color='#F57F17', lw=1.8, zorder=5)
    ax.axhline(0.0, color='#37474F', lw=0.6, ls='--', alpha=0.5)
    ax.annotate('Deep\nSeptal Q', xy=(0.38, -0.62), fontsize=6.5, color='#F57F17', fontweight='bold', ha='center')
    ax.annotate('Giant\nT inv', xy=(0.85, -0.78), fontsize=6.5, color='#F57F17', fontweight='bold', ha='center')
    ax.set_ylim(-1.5, 2.5)
    ax.set_title('Hypertrophic Cardiomyopathy (HCM)', fontsize=9, fontweight='bold', color='#F57F17', pad=2)

# ── 7. ACUTE PERICARDITIS ─────────────────────────────────────────────────────
def draw_pericarditis(ax):
    ecg_grid_bg(ax, '#E3F2FD')
    x = np.linspace(0, 4.0, 2000)
    y = np.zeros_like(x)
    for beat_x in [0.2, 1.2, 2.2, 3.2]:
        lx = x - beat_x
        mask = (lx >= 0) & (lx <= 0.9)
        # PR DEPRESSION
        pr_mask = (lx >= 0.03) & (lx <= 0.22)
        y[mask & pr_mask] -= 0.15
        y[mask] += make_p(lx[mask], 0.10, amp=0.2)
        y[mask] += make_qrs(lx[mask], 0.26, 0.30, 0.34, r_amp=1.0)
        # Saddle-shaped (concave) ST elevation - diffuse
        st_mask = (lx >= 0.31) & (lx <= 0.56)
        # concave up = smiley shape
        st_x = lx[mask & st_mask]
        y[mask & st_mask] += 0.35 - 0.35 * np.cos(np.pi * (st_x - 0.31) / 0.25)
        # T wave upright (stage 1)
        y[mask] += gaussian(lx[mask], 0.60, 0.07, 0.3)
    ax.plot(x, y, color='#1565C0', lw=1.8, zorder=5)
    ax.axhline(0.0, color='#37474F', lw=0.6, ls='--', alpha=0.5)
    ax.annotate('PR ↓', xy=(0.32, -0.2), fontsize=7, color='#1565C0', fontweight='bold')
    ax.annotate('Concave ST ↑\n(diffuse)', xy=(0.55, 0.55), fontsize=6.5, color='#1565C0', fontweight='bold')
    ax.set_title('Acute Pericarditis', fontsize=9, fontweight='bold', color='#1565C0', pad=2)

# ── 8. WPW ────────────────────────────────────────────────────────────────────
def draw_wpw(ax):
    ecg_grid_bg(ax, '#FCE4EC')
    x = np.linspace(0, 4.0, 2000)
    y = np.zeros_like(x)
    for beat_x in [0.2, 1.2, 2.2, 3.2]:
        lx = x - beat_x
        mask = (lx >= 0) & (lx <= 0.9)
        y[mask] += make_p(lx[mask], 0.08, amp=0.18)
        # Short PR (0.10s) + delta wave slurring + wide QRS
        # Delta wave: slow ramp up before R
        delta_mask = (lx >= 0.14) & (lx <= 0.24)
        y[mask & delta_mask] += 0.35 * (lx[mask & delta_mask] - 0.14) / 0.10
        # R peak
        y[mask] += gaussian(lx[mask], 0.28, 0.022, 1.0)
        # S wave
        y[mask] += gaussian(lx[mask], 0.36, 0.018, -0.28)
        # Discordant T wave
        y[mask] += gaussian(lx[mask], 0.56, 0.07, -0.25)
    ax.plot(x, y, color='#AD1457', lw=1.8, zorder=5)
    ax.axhline(0.0, color='#37474F', lw=0.6, ls='--', alpha=0.5)
    # Annotate short PR
    ax.annotate('', xy=(0.28, 1.2), xytext=(0.08, 1.2),
                arrowprops=dict(arrowstyle='<->', color='#AD1457', lw=1.2))
    ax.text(0.18, 1.38, 'Short PR', fontsize=7, color='#AD1457', fontweight='bold', ha='center')
    ax.annotate('δ wave', xy=(0.34, 0.22), fontsize=7, color='#AD1457', fontweight='bold')
    ax.set_title('Wolff-Parkinson-White (WPW)', fontsize=9, fontweight='bold', color='#AD1457', pad=2)

# ── 9. DILATED CARDIOMYOPATHY (LBBB pattern) ─────────────────────────────────
def draw_dcm(ax):
    ecg_grid_bg(ax, '#EDE7F6')
    x = np.linspace(0, 4.0, 2000)
    y = np.zeros_like(x)
    for beat_x in [0.2, 1.3, 2.4, 3.5]:
        lx = x - beat_x
        mask = (lx >= 0) & (lx <= 0.9)
        y[mask] += make_p(lx[mask], 0.10, amp=0.16)
        # LBBB: broad notched R in V5/V6 leads
        # QRS width ~0.14s, RSR' in lateral leads
        y[mask] += gaussian(lx[mask], 0.26, 0.025, 0.55)  # r
        y[mask] += gaussian(lx[mask], 0.32, 0.025, 0.72)  # R (notched)
        y[mask] += gaussian(lx[mask], 0.38, 0.02, -0.08)  # s (small)
        # Discordant ST-T
        st_mask = (lx >= 0.35) & (lx <= 0.62)
        y[mask & st_mask] -= 0.18
        y[mask] += gaussian(lx[mask], 0.62, 0.08, -0.22)
    ax.plot(x, y, color='#4527A0', lw=1.8, zorder=5)
    ax.axhline(0.0, color='#37474F', lw=0.6, ls='--', alpha=0.5)
    ax.annotate('LBBB\nBroad notched R', xy=(0.5, 0.8), fontsize=6.5,
                color='#4527A0', fontweight='bold', ha='center')
    ax.set_title('Dilated Cardiomyopathy (LBBB pattern)', fontsize=9, fontweight='bold', color='#4527A0', pad=2)

# ── 10. PULMONARY EMBOLISM ────────────────────────────────────────────────────
def draw_pe(ax):
    ecg_grid_bg(ax, '#E0F7FA')
    x = np.linspace(0, 4.0, 2000)
    y = np.zeros_like(x)
    for beat_x in [0.15, 1.05, 1.95, 2.85]:
        lx = x - beat_x
        mask = (lx >= 0) & (lx <= 0.75)
        # Sinus tachycardia (HR ~110)
        y[mask] += make_p(lx[mask], 0.08, amp=0.18)
        # S wave in lead I (deep S)
        y[mask] += gaussian(lx[mask], 0.20, 0.015, 0.85)   # R
        y[mask] += gaussian(lx[mask], 0.28, 0.022, -0.55)  # Deep S
        # T-wave inversion (V1-V4 territory, right heart strain)
        y[mask] += gaussian(lx[mask], 0.50, 0.07, -0.28)
    # Add Q wave in "lead III" region (S1Q3T3)
    for beat_x in [0.15, 1.05, 1.95, 2.85]:
        lx = x - beat_x
        mask = (lx >= 0) & (lx <= 0.75)
        y[mask] += gaussian(lx[mask], 0.16, 0.014, -0.28)  # Q in III
    ax.plot(x, y, color='#006064', lw=1.8, zorder=5)
    ax.axhline(0.0, color='#37474F', lw=0.6, ls='--', alpha=0.5)
    ax.text(2.0, 2.1, 'S1Q3T3 — Right Heart Strain', fontsize=7,
            color='#006064', fontweight='bold', ha='center')
    ax.annotate('Deep S', xy=(0.42, -0.58), fontsize=7, color='#006064', fontweight='bold')
    ax.set_title('Pulmonary Embolism', fontsize=9, fontweight='bold', color='#006064', pad=2)

# ─── SAVE INDIVIDUAL WAVEFORM IMAGES ─────────────────────────────────────────

DRAW_FUNCS = [
    ('stemi',      draw_stemi),
    ('nstemi',     draw_nstemi),
    ('afib',       draw_afib),
    ('avb1',       draw_1st_avblock),
    ('wenckebach', draw_wenckebach),
    ('chb',        draw_complete_block),
    ('lvh',        draw_lvh),
    ('hcm',        draw_hcm),
    ('pericarditis', draw_pericarditis),
    ('wpw',        draw_wpw),
    ('dcm',        draw_dcm),
    ('pe',         draw_pe),
]

img_paths = {}
for name, fn in DRAW_FUNCS:
    fig, ax = plt.subplots(figsize=(5.2, 1.7))
    fig.patch.set_facecolor('white')
    ax.set_xlim(0, 4.0)
    ax.set_ylim(-1.5, 2.5)
    fn(ax)
    path = f"/home/daytona/workspace/ecg-pdf/ecg_{name}.png"
    fig.tight_layout(pad=0.3)
    fig.savefig(path, dpi=160, bbox_inches='tight', facecolor='white')
    plt.close(fig)
    img_paths[name] = path
    print(f"  saved {path}")

print("All ECG images saved.")
~/ecg-pdf/assemble_pdf.py
"""
PDF assembly for ECG Patterns Comparison Chart
"""

import os, io
from reportlab.lib.pagesizes import A4, landscape
from reportlab.lib import colors
from reportlab.lib.units import mm, cm
from reportlab.lib.styles import getSampleStyleSheet, ParagraphStyle
from reportlab.lib.enums import TA_CENTER, TA_LEFT, TA_RIGHT
from reportlab.platypus import (SimpleDocTemplate, Paragraph, Spacer, Table,
                                 TableStyle, Image as RLImage, HRFlowable,
                                 PageBreak, KeepTogether)
from reportlab.pdfbase import pdfmetrics
from reportlab.pdfbase.ttfonts import TTFont

OUTPUT = "/home/daytona/workspace/ecg-pdf/ECG_Patterns_Comparison.pdf"
IMG_DIR = "/home/daytona/workspace/ecg-pdf"

# ─── COLORS ──────────────────────────────────────────────────────────────────
DARK_NAVY   = colors.HexColor("#0D1B2A")
NAVY        = colors.HexColor("#1B2A4A")
TEAL        = colors.HexColor("#00695C")
TEAL_LIGHT  = colors.HexColor("#E0F2F1")
RED         = colors.HexColor("#C62828")
RED_LIGHT   = colors.HexColor("#FFEBEE")
AMBER       = colors.HexColor("#E65100")
AMBER_LIGHT = colors.HexColor("#FFF3E0")
GREEN       = colors.HexColor("#2E7D32")
GREEN_LIGHT = colors.HexColor("#E8F5E9")
PURPLE      = colors.HexColor("#4527A0")
PURPLE_LIGHT= colors.HexColor("#EDE7F6")
BLUE        = colors.HexColor("#1565C0")
BLUE_LIGHT  = colors.HexColor("#E3F2FD")
PINK        = colors.HexColor("#880E4F")
PINK_LIGHT  = colors.HexColor("#FCE4EC")
CYAN        = colors.HexColor("#006064")
CYAN_LIGHT  = colors.HexColor("#E0F7FA")
GREY_DARK   = colors.HexColor("#37474F")
GREY_LIGHT  = colors.HexColor("#ECEFF1")
GOLD        = colors.HexColor("#F57F17")
GOLD_LIGHT  = colors.HexColor("#FFFDE7")
WHITE       = colors.white

# ─── STYLES ──────────────────────────────────────────────────────────────────
styles = getSampleStyleSheet()

def S(name, **kw):
    base = styles.get(name, styles['Normal'])
    return ParagraphStyle(name + '_custom', parent=base, **kw)

title_style = S('Normal', fontSize=28, leading=34, textColor=WHITE,
                fontName='Helvetica-Bold', alignment=TA_CENTER, spaceAfter=6)
subtitle_style = S('Normal', fontSize=13, leading=16, textColor=TEAL_LIGHT,
                   fontName='Helvetica', alignment=TA_CENTER, spaceAfter=4)
section_header = S('Normal', fontSize=14, leading=18, textColor=WHITE,
                   fontName='Helvetica-Bold', alignment=TA_CENTER,
                   backColor=NAVY, borderPadding=(6, 10, 6, 10))
disease_title = S('Normal', fontSize=11, leading=14, textColor=WHITE,
                  fontName='Helvetica-Bold', alignment=TA_CENTER)
body = S('Normal', fontSize=8.5, leading=11.5, textColor=GREY_DARK,
         fontName='Helvetica')
body_bold = S('Normal', fontSize=8.5, leading=11.5, textColor=DARK_NAVY,
              fontName='Helvetica-Bold')
small = S('Normal', fontSize=7.5, leading=10, textColor=GREY_DARK,
          fontName='Helvetica')
small_bold = S('Normal', fontSize=7.5, leading=10, textColor=DARK_NAVY,
               fontName='Helvetica-Bold')
table_header_style = S('Normal', fontSize=8, leading=10, textColor=WHITE,
                       fontName='Helvetica-Bold', alignment=TA_CENTER)
table_cell_style = S('Normal', fontSize=7.5, leading=10, textColor=GREY_DARK,
                     fontName='Helvetica', alignment=TA_LEFT)
caption_style = S('Normal', fontSize=7, leading=9, textColor=GREY_DARK,
                  fontName='Helvetica-Oblique', alignment=TA_CENTER)
footer_style = S('Normal', fontSize=7, leading=9, textColor=GREY_DARK,
                 fontName='Helvetica', alignment=TA_CENTER)
bullet_style = S('Normal', fontSize=8, leading=11, textColor=GREY_DARK,
                 fontName='Helvetica', leftIndent=8, firstLineIndent=-8)

# ─── HELPERS ─────────────────────────────────────────────────────────────────

def ecg_img(name, w=None, h=None):
    path = os.path.join(IMG_DIR, f"ecg_{name}.png")
    if not os.path.exists(path):
        return Paragraph(f"[ECG: {name}]", small)
    img = RLImage(path)
    if w:
        ratio = img.imageHeight / img.imageWidth
        img.drawWidth = w
        img.drawHeight = w * ratio
    elif h:
        ratio = img.imageWidth / img.imageHeight
        img.drawWidth = h * ratio
        img.drawHeight = h
    return img

def color_box(text, bg, fg=WHITE, w=None):
    style = S('Normal', fontSize=9.5, leading=12, textColor=fg,
              fontName='Helvetica-Bold', alignment=TA_CENTER,
              backColor=bg, borderPadding=(5, 8, 5, 8))
    return Paragraph(text, style)

def hr(color=TEAL, thickness=1.5):
    return HRFlowable(width='100%', thickness=thickness, color=color,
                      spaceAfter=4, spaceBefore=4)

def bullets(items, color=GREY_DARK):
    style = ParagraphStyle('bull', parent=styles['Normal'],
                           fontSize=8, leading=11, textColor=color,
                           fontName='Helvetica', leftIndent=10,
                           firstLineIndent=-10, spaceAfter=1)
    return [Paragraph(f"• {item}", style) for item in items]

# ─── PAGE TEMPLATE ───────────────────────────────────────────────────────────

PAGE_W, PAGE_H = A4  # 595 x 842 pt portrait
MARGIN = 1.5 * cm

def on_page(canvas, doc):
    canvas.saveState()
    # Top banner
    canvas.setFillColor(DARK_NAVY)
    canvas.rect(0, PAGE_H - 22, PAGE_W, 22, fill=1, stroke=0)
    canvas.setFillColor(TEAL_LIGHT)
    canvas.setFont('Helvetica-Bold', 8)
    canvas.drawString(12, PAGE_H - 14, "ECG PATTERNS COMPARISON CHART")
    canvas.setFillColor(GREY_LIGHT)
    canvas.setFont('Helvetica', 7.5)
    canvas.drawRightString(PAGE_W - 12, PAGE_H - 14,
                           "10 Common Heart Diseases | Clinical Reference")
    # Bottom bar
    canvas.setFillColor(DARK_NAVY)
    canvas.rect(0, 0, PAGE_W, 18, fill=1, stroke=0)
    canvas.setFillColor(GREY_LIGHT)
    canvas.setFont('Helvetica', 7)
    canvas.drawString(12, 5, "For educational purposes only. Always correlate with clinical findings.")
    canvas.drawRightString(PAGE_W - 12, 5,
                           f"Page {doc.page}")
    canvas.restoreState()

# ─── BUILD DOCUMENT ──────────────────────────────────────────────────────────

doc = SimpleDocTemplate(
    OUTPUT,
    pagesize=A4,
    leftMargin=MARGIN, rightMargin=MARGIN,
    topMargin=MARGIN + 20, bottomMargin=MARGIN + 16,
    title="ECG Patterns Comparison Chart — 10 Heart Diseases",
    author="Orris Medical Reference",
    subject="Cardiology ECG Visual Summary"
)

story = []
W = PAGE_W - 2 * MARGIN   # usable width ~16.7 cm

# ══════════════════════════════════════════════════════════════════════════════
# PAGE 1 — COVER
# ══════════════════════════════════════════════════════════════════════════════

story.append(Spacer(1, 1.2 * cm))

# Title block
title_data = [[Paragraph(
    "<b>ECG Patterns<br/>Comparison Chart</b>",
    S('Normal', fontSize=30, leading=36, textColor=WHITE,
      fontName='Helvetica-Bold', alignment=TA_CENTER))]]
title_table = Table(title_data, colWidths=[W])
title_table.setStyle(TableStyle([
    ('BACKGROUND', (0,0), (-1,-1), DARK_NAVY),
    ('TOPPADDING', (0,0), (-1,-1), 18),
    ('BOTTOMPADDING', (0,0), (-1,-1), 18),
    ('LEFTPADDING', (0,0), (-1,-1), 14),
    ('RIGHTPADDING', (0,0), (-1,-1), 14),
    ('ROUNDEDCORNERS', (0,0), (-1,-1), [8,8,8,8]),
]))
story.append(title_table)
story.append(Spacer(1, 0.4 * cm))

subtitle_data = [[Paragraph(
    "Visual reference guide to electrocardiographic findings in 10 common cardiac conditions",
    S('Normal', fontSize=12, leading=16, textColor=DARK_NAVY,
      fontName='Helvetica', alignment=TA_CENTER))]]
sub_table = Table(subtitle_data, colWidths=[W])
sub_table.setStyle(TableStyle([
    ('BACKGROUND', (0,0), (-1,-1), TEAL_LIGHT),
    ('TOPPADDING', (0,0), (-1,-1), 8),
    ('BOTTOMPADDING', (0,0), (-1,-1), 8),
    ('LEFTPADDING', (0,0), (-1,-1), 12),
    ('RIGHTPADDING', (0,0), (-1,-1), 12),
]))
story.append(sub_table)
story.append(Spacer(1, 0.5 * cm))
story.append(hr(TEAL, 2))
story.append(Spacer(1, 0.3 * cm))

# 10 diseases overview grid (2 × 5)
disease_meta = [
    ("1", "STEMI", RED,    "ST elevation, Q waves, reciprocal changes"),
    ("2", "NSTEMI/UA", AMBER, "ST depression, T-wave inversions"),
    ("3", "Atrial Fibrillation", PURPLE, "Absent P, irregularly irregular RR"),
    ("4", "AV Heart Block", GREEN, "PR prolongation / AV dissociation"),
    ("5", "LVH", AMBER,    "High voltage, lateral strain pattern"),
    ("6", "HCM", GOLD,     "LVH + deep septal Q + giant T inversions"),
    ("7", "Acute Pericarditis", BLUE, "Concave ST elevation, PR depression"),
    ("8", "WPW Syndrome", PINK, "Short PR, delta wave, wide QRS"),
    ("9", "Dilated Cardiomyopathy", PURPLE, "LBBB pattern, low voltage, AF"),
    ("10", "Pulmonary Embolism", CYAN, "S1Q3T3, right heart strain, tachycardia"),
]

row1 = []
row2 = []
for i, (num, name, clr, ecg_key) in enumerate(disease_meta):
    cell = Table([[
        Paragraph(f"<b>{num}</b>",
                  S('Normal', fontSize=18, leading=22, textColor=WHITE,
                    fontName='Helvetica-Bold', alignment=TA_CENTER)),
        Paragraph(f"<b>{name}</b><br/><font size='7'>{ecg_key}</font>",
                  S('Normal', fontSize=9, leading=12, textColor=WHITE,
                    fontName='Helvetica-Bold'))
    ]], colWidths=[22, W/2 - 38])
    cell.setStyle(TableStyle([
        ('BACKGROUND', (0,0), (-1,-1), clr),
        ('TOPPADDING', (0,0), (-1,-1), 8),
        ('BOTTOMPADDING', (0,0), (-1,-1), 8),
        ('LEFTPADDING', (0,0), (-1,-1), 6),
        ('RIGHTPADDING', (0,0), (-1,-1), 6),
        ('VALIGN', (0,0), (-1,-1), 'MIDDLE'),
    ]))
    if i < 5:
        row1.append(cell)
    else:
        row2.append(cell)

gap = 4
cw = (W - gap) / 2
overview_table = Table(
    [row1, [Spacer(1, gap)] * 5, row2],
    colWidths=[cw] * 5,
    rowHeights=[None, gap, None]
)
overview_table.setStyle(TableStyle([
    ('LEFTPADDING', (0,0), (-1,-1), 2),
    ('RIGHTPADDING', (0,0), (-1,-1), 2),
    ('TOPPADDING', (0,0), (-1,-1), 2),
    ('BOTTOMPADDING', (0,0), (-1,-1), 2),
]))
story.append(overview_table)
story.append(Spacer(1, 0.5 * cm))
story.append(hr(TEAL, 1))
story.append(Spacer(1, 0.3 * cm))

# Quick ECG key
key_items = [
    ("P wave", "Atrial depolarization (normal: 80-100ms)"),
    ("PR interval", "AV conduction time (normal: 120-200ms)"),
    ("QRS complex", "Ventricular depolarization (normal: <120ms)"),
    ("ST segment", "Early ventricular repolarization (isoelectric)"),
    ("T wave", "Ventricular repolarization (normally upright)"),
    ("QT interval", "Total ventricular systole (normal: <440ms in men)"),
]
key_rows = [[
    Paragraph("<b>ECG COMPONENT</b>", table_header_style),
    Paragraph("<b>MEANING</b>", table_header_style)
]]
for k, v in key_items:
    key_rows.append([
        Paragraph(f"<b>{k}</b>", small_bold),
        Paragraph(v, small)
    ])
key_table = Table(key_rows, colWidths=[W * 0.3, W * 0.7])
key_table.setStyle(TableStyle([
    ('BACKGROUND', (0,0), (-1,0), NAVY),
    ('BACKGROUND', (0,1), (-1,-1), GREY_LIGHT),
    ('ROWBACKGROUNDS', (0,1), (-1,-1), [WHITE, GREY_LIGHT]),
    ('GRID', (0,0), (-1,-1), 0.4, GREY),
    ('TOPPADDING', (0,0), (-1,-1), 4),
    ('BOTTOMPADDING', (0,0), (-1,-1), 4),
    ('LEFTPADDING', (0,0), (-1,-1), 6),
    ('RIGHTPADDING', (0,0), (-1,-1), 6),
    ('VALIGN', (0,0), (-1,-1), 'MIDDLE'),
]))
story.append(key_table)

story.append(PageBreak())

# ══════════════════════════════════════════════════════════════════════════════
# PAGES 2-3 — DISEASE CARDS (5 per page)
# Disease card: ECG waveform image + key findings table
# ══════════════════════════════════════════════════════════════════════════════

DISEASES = [
    {
        "num": "01", "name": "ST-Elevation Myocardial Infarction (STEMI)",
        "color": RED, "light": RED_LIGHT,
        "ecg_img": "stemi",
        "mechanism": "Complete coronary occlusion → transmural ischemia → epicardial 'current of injury'",
        "ecg_changes": [
            "Hyperacute T waves (minutes) – tall, peaked T waves",
            "ST elevation ≥1 mm in ≥2 contiguous limb leads; ≥2 mm in precordial leads",
            "Convex (tombstone) ST elevation – distinguishes from pericarditis",
            "Pathological Q waves (necrosis marker) – width ≥40ms, depth ≥25% R",
            "Reciprocal ST depression in opposing leads",
            "T-wave inversion (evolving phase, hours-days)",
        ],
        "localization": "Anterior (LAD): V1-V4 | Inferior (RCA): II, III, aVF | Lateral (LCx): I, aVL, V5-V6",
        "pearls": "Normal ECG does NOT exclude STEMI. LBBB can mask changes. Posterior MI = ST depression V1-V3.",
    },
    {
        "num": "02", "name": "NSTEMI / Unstable Angina",
        "color": AMBER, "light": AMBER_LIGHT,
        "ecg_img": "nstemi",
        "mechanism": "Partial coronary occlusion → subendocardial ischemia → ST vector toward endocardium",
        "ecg_changes": [
            "ST depression ≥0.5 mm (horizontal or downsloping) – most specific for ischemia",
            "Symmetric deep T-wave inversions in ischemic territory",
            "Transient ST changes during pain, resolving at rest",
            "Wellens T-wave sign: deep V1-V4 inversions → critical LAD stenosis",
            "NO pathological Q waves, NO ST elevation",
            "Normal ECG possible — troponin essential for NSTEMI diagnosis",
        ],
        "localization": "ST depression does not localize well; T inversions may indicate territory",
        "pearls": "NSTEMI = same ECG as UA but with elevated troponin. De Winter pattern (upsloping ST depression + peaked T) = proximal LAD occlusion.",
    },
    {
        "num": "03", "name": "Atrial Fibrillation (AF)",
        "color": PURPLE, "light": PURPLE_LIGHT,
        "ecg_img": "afib",
        "mechanism": "Chaotic multi-wavelet reentry in atria (400-600/min) → loss of organized atrial contraction",
        "ecg_changes": [
            "Absent P waves – replaced by irregular fibrillatory baseline (f-waves)",
            "Irregularly irregular RR intervals – pathognomonic finding",
            "Ventricular rate typically 110-160/min (uncontrolled)",
            "Narrow QRS unless aberrant conduction (LBBB) or WPW (life-threatening)",
            "Coarse f-waves (>1mm): valvular/rheumatic AF",
            "Fine f-waves (<1mm): common in lone AF or ischaemic AF",
        ],
        "localization": "N/A – rhythm disorder affecting all leads",
        "pearls": "AF + WPW = avoid rate-limiting agents (adenosine, beta-blockers, CCBs, digoxin) – risk of VF. Rate control vs rhythm control depends on clinical context.",
    },
    {
        "num": "04", "name": "AV Heart Block (1st, 2nd, 3rd Degree)",
        "color": GREEN, "light": GREEN_LIGHT,
        "ecg_img": "avb1",
        "mechanism": "Impaired conduction in AV node or His-Purkinje system from fibrosis, ischaemia, or drugs",
        "ecg_changes": [
            "1st degree: PR interval >200 ms; all P waves conduct to ventricles",
            "2nd degree Mobitz I (Wenckebach): progressive PR lengthening → dropped QRS, then cycle repeats",
            "2nd degree Mobitz II: fixed PR + sudden dropped QRS; often wide QRS; infranodal",
            "3rd degree (complete): AV dissociation – P waves and QRS march independently",
            "Complete block: atrial rate > ventricular escape rate (20-40/min if ventricular escape)",
            "Narrow QRS escape = junctional (proximal block); Wide QRS = ventricular (distal block)",
        ],
        "localization": "AV node (proximal – narrow escape) vs. His-Purkinje (distal – wide escape)",
        "pearls": "Mobitz I is usually benign; Mobitz II requires pacing. Complete block with wide QRS escape = emergency pacing. Drug causes: beta-blockers, CCBs, digoxin, amiodarone.",
    },
    {
        "num": "05", "name": "Left Ventricular Hypertrophy (LVH)",
        "color": AMBER, "light": AMBER_LIGHT,
        "ecg_img": "lvh",
        "mechanism": "Increased LV muscle mass from pressure/volume overload → larger electrical forces leftward and posteriorly",
        "ecg_changes": [
            "High voltage: Sokolow-Lyon criteria: SV1 + RV5-6 ≥35 mm",
            "Cornell criteria: RaVL + SV3 >28mm (men) or >20mm (women)",
            "Left axis deviation (QRS axis < -30°)",
            "LV 'strain' pattern: ST depression + asymmetric T inversion in I, aVL, V5-V6",
            "Left atrial enlargement: broad notched P (P mitrale), biphasic P in V1",
            "Prolonged QRS intrinsicoid deflection >50 ms in V5-V6",
        ],
        "localization": "Lateral leads (I, aVL, V5-V6) most prominent",
        "pearls": "ECG has ~50% sensitivity for LVH but is specific. LVH strain pattern increases cardiovascular risk independently. Causes: hypertension, aortic stenosis, HCM.",
    },
    {
        "num": "06", "name": "Hypertrophic Cardiomyopathy (HCM)",
        "color": GOLD, "light": GOLD_LIGHT,
        "ecg_img": "hcm",
        "mechanism": "Sarcomere gene mutation → asymmetric septal hypertrophy + myofibrillar disarray → abnormal depolarization",
        "ecg_changes": [
            "LVH voltage criteria (most patients)",
            "Deep narrow septal Q waves in I, aVL, V5-V6 (abnormal septal depolarization – NOT infarction)",
            "Widespread ST depression and T-wave inversions",
            "Apical HCM (Yamaguchi): giant deep T inversions >10mm in V3-V6 (pathognomonic)",
            "Left axis deviation; left atrial enlargement",
            "WPW pattern in PRKAG2-mutation HCM; AF in advanced disease",
        ],
        "localization": "Lateral leads show septal Q; diffuse ST-T changes",
        "pearls": "HCM is the most common cause of sudden cardiac death in young athletes. Giant T inversions in apical HCM mimic Wellens syndrome but are not ischaemic. Avoid digoxin, nitrates, diuretics (exacerbate obstruction).",
    },
    {
        "num": "07", "name": "Acute Pericarditis",
        "color": BLUE, "light": BLUE_LIGHT,
        "ecg_img": "pericarditis",
        "mechanism": "Diffuse pericardial inflammation → uniform epicardial injury → concentric current of injury affecting all surfaces",
        "ecg_changes": [
            "Stage 1: Diffuse concave (saddle-shaped) ST elevation in ALL leads except aVR & V1",
            "PR depression in leads II, III, aVF, V4-V6 (atrial injury) – pathognomonic",
            "PR elevation in aVR (reciprocal to PR depression)",
            "Stage 2 (days 3-7): ST normalizes; T waves flatten",
            "Stage 3 (1-3 weeks): Diffuse T-wave inversions",
            "Stage 4 (weeks-months): ECG normalizes",
        ],
        "localization": "Diffuse (all leads) – key distinction from MI (regional)",
        "pearls": "Key STEMI vs pericarditis: concave (not convex) ST, diffuse (not regional), PR depression, no reciprocal ST changes (except aVR/V1), no Q waves. Spodick's sign: downsloping TP segment. Treat with NSAIDs + colchicine.",
    },
    {
        "num": "08", "name": "Wolff-Parkinson-White (WPW) Syndrome",
        "color": PINK, "light": PINK_LIGHT,
        "ecg_img": "wpw",
        "mechanism": "Accessory AV pathway (Bundle of Kent) bypasses AV node → ventricular pre-excitation via direct atrial-ventricular connection",
        "ecg_changes": [
            "Short PR interval <120 ms (AV nodal delay bypassed)",
            "Delta wave: slurred, slow initial QRS upstroke from cell-to-cell accessory conduction",
            "Wide QRS >120 ms: fusion of accessory + normal conduction",
            "Discordant ST-T changes (secondary to abnormal depolarization)",
            "Pseudo-Q waves from negative delta waves (mimics inferior/lateral MI)",
            "During tachycardia: orthodromic AVRT = narrow complex; antidromic AVRT = wide complex",
        ],
        "localization": "Delta wave polarity identifies accessory pathway location",
        "pearls": "WPW + AF is life-threatening: rapid antidromic conduction can trigger VF. AVOID adenosine, beta-blockers, CCBs, digoxin. Use procainamide IV or DC cardioversion. Definitive treatment: radiofrequency catheter ablation.",
    },
    {
        "num": "09", "name": "Dilated Cardiomyopathy (DCM)",
        "color": PURPLE, "light": PURPLE_LIGHT,
        "ecg_img": "dcm",
        "mechanism": "Global LV dilation + systolic dysfunction → stretched/fibrotic myocardium disrupts conduction pathways",
        "ecg_changes": [
            "Left bundle branch block (LBBB): wide QRS >120ms, broad notched R in I/V5-V6, rS/QS in V1 – most characteristic",
            "Poor R-wave progression V1-V4 (anterior fibrosis/scar)",
            "Sinus tachycardia (compensatory)",
            "Non-specific ST-T changes widespread",
            "Low voltage in amyloid/sarcoid-related cardiomyopathy",
            "Atrial fibrillation (common with progression); frequent PVCs/NSVT",
        ],
        "localization": "No regional pattern; diffuse changes",
        "pearls": "New LBBB + dyspnea = DCM until proven otherwise. Cardiac resynchronization therapy (CRT) benefits patients with LBBB + EF ≤35% + NYHA II-III. Causes: idiopathic (50%), alcohol, viral myocarditis, chemotherapy, peripartum.",
    },
    {
        "num": "10", "name": "Pulmonary Embolism (PE)",
        "color": CYAN, "light": CYAN_LIGHT,
        "ecg_img": "pe",
        "mechanism": "Acute RV pressure overload from pulmonary artery obstruction → RV dilation, rightward axis shift, conduction changes",
        "ecg_changes": [
            "Sinus tachycardia: most common (40%); most sensitive but non-specific finding",
            "S1Q3T3 pattern: deep S in I + Q wave + T-wave inversion in III (~20% sensitivity)",
            "Right precordial T-wave inversions V1-V4 (RV strain) – more sensitive than S1Q3T3",
            "New right bundle branch block (RBBB): complete or incomplete",
            "Right axis deviation (>90°) from acute RV dilatation",
            "P pulmonale: peaked P waves >2.5mm in II (right atrial dilation); AF in 10-35%",
        ],
        "localization": "Right-sided leads (V1-V4, III, aVF) most affected",
        "pearls": "Normal ECG in up to 20% of PE. S1Q3T3 is neither sensitive nor specific but is the 'classic' sign. Right precordial T inversions (V1-V4) are more sensitive. ECG mimics: anterior STEMI (T inversions V1-V4), inferior MI (S1Q3T3). Confirm with CT-PA.",
    },
]

def disease_card(d):
    """Build a single disease card flowable."""
    elements = []
    clr = d['color']
    light = d['light']

    # Header bar
    hdr = Table([[
        Paragraph(f"<b>{d['num']}</b>",
                  S('Normal', fontSize=16, textColor=WHITE,
                    fontName='Helvetica-Bold', alignment=TA_CENTER)),
        Paragraph(f"<b>{d['name']}</b>",
                  S('Normal', fontSize=11, leading=14, textColor=WHITE,
                    fontName='Helvetica-Bold', alignment=TA_LEFT))
    ]], colWidths=[30, W - 38])
    hdr.setStyle(TableStyle([
        ('BACKGROUND', (0,0), (-1,-1), clr),
        ('TOPPADDING', (0,0), (-1,-1), 7),
        ('BOTTOMPADDING', (0,0), (-1,-1), 7),
        ('LEFTPADDING', (0,0), (-1,-1), 8),
        ('RIGHTPADDING', (0,0), (-1,-1), 8),
        ('VALIGN', (0,0), (-1,-1), 'MIDDLE'),
    ]))
    elements.append(hdr)

    # Body: ECG image (left) + findings (right)
    img = ecg_img(d['ecg_img'], w=W * 0.48)

    # Right side content
    right_content = []
    right_content.append(Paragraph(
        f"<b>Mechanism:</b> {d['mechanism']}",
        S('Normal', fontSize=7.5, leading=10, textColor=GREY_DARK,
          fontName='Helvetica', spaceAfter=4, backColor=light,
          borderPadding=(3,5,3,5))
    ))
    right_content.append(Spacer(1, 3))
    right_content.append(Paragraph(
        "<b>KEY ECG CHANGES:</b>",
        S('Normal', fontSize=8, leading=10, textColor=clr,
          fontName='Helvetica-Bold', spaceAfter=2)
    ))
    for item in d['ecg_changes']:
        right_content.append(Paragraph(
            f"▸ {item}",
            S('Normal', fontSize=7.5, leading=10, textColor=GREY_DARK,
              fontName='Helvetica', leftIndent=6, spaceAfter=1)
        ))
    right_content.append(Spacer(1, 3))
    right_content.append(Paragraph(
        f"<b>LOCALIZATION:</b> {d['localization']}",
        S('Normal', fontSize=7.5, leading=10, textColor=DARK_NAVY,
          fontName='Helvetica-Bold', spaceAfter=2)
    ))
    right_content.append(Paragraph(
        f"<b>⚡ CLINICAL PEARL:</b> {d['pearls']}",
        S('Normal', fontSize=7.5, leading=10,
          textColor=clr,
          fontName='Helvetica-Bold', borderPadding=(3,4,3,4),
          backColor=light)
    ))

    from reportlab.platypus import KeepInFrame
    right_frame = KeepInFrame(W * 0.48, 200, right_content, mode='shrink')

    body_table = Table(
        [[img, right_frame]],
        colWidths=[W * 0.50, W * 0.48],
        rowHeights=None
    )
    body_table.setStyle(TableStyle([
        ('VALIGN', (0,0), (-1,-1), 'TOP'),
        ('LEFTPADDING', (0,0), (-1,-1), 5),
        ('RIGHTPADDING', (0,0), (-1,-1), 5),
        ('TOPPADDING', (0,0), (-1,-1), 5),
        ('BOTTOMPADDING', (0,0), (-1,-1), 5),
        ('BACKGROUND', (0,0), (-1,-1), WHITE),
        ('BOX', (0,0), (-1,-1), 0.5, clr),
    ]))
    elements.append(body_table)
    elements.append(Spacer(1, 6))
    return elements

# Add disease cards - 2 per page to keep legible
for i, disease in enumerate(DISEASES):
    story.extend(disease_card(disease))
    if i < len(DISEASES) - 1:
        # Page break every 2 cards
        if (i + 1) % 2 == 0:
            story.append(PageBreak())

story.append(PageBreak())

# ══════════════════════════════════════════════════════════════════════════════
# FINAL PAGE — MASTER COMPARISON TABLE
# ══════════════════════════════════════════════════════════════════════════════

story.append(Paragraph(
    "<b>MASTER ECG COMPARISON TABLE</b>",
    S('Normal', fontSize=16, leading=20, textColor=WHITE, fontName='Helvetica-Bold',
      alignment=TA_CENTER, backColor=DARK_NAVY, borderPadding=(10, 12, 10, 12))
))
story.append(Spacer(1, 0.3 * cm))

headers = ["#", "Condition", "Heart Rate", "P Wave", "PR Interval",
           "QRS Complex", "ST Segment", "T Wave", "Key Sign"]
col_w = [W * f for f in [0.03, 0.14, 0.07, 0.08, 0.09, 0.12, 0.13, 0.11, 0.22]]

rows = [
    ["1", "STEMI", "Tachycardia", "Normal", "Normal",
     "Pathological Q", "Elevation (convex)", "Inversion (evolving)", "Regional ST↑ + reciprocal ST↓"],
    ["2", "NSTEMI/UA", "Tachycardia", "Normal", "Normal",
     "Normal/narrow Q", "Depression ≥0.5mm", "Deep inversion", "No ST elevation; troponin ↑"],
    ["3", "Atrial Fibrillation", "Irregular 110-160", "Absent (f-waves)", "Unmeasurable",
     "Narrow (usually)", "Normal", "Normal", "Irregularly irregular RR"],
    ["4a", "1st° AV Block", "Normal", "Normal", ">200ms",
     "Normal", "Normal", "Normal", "Prolonged PR, all beats conduct"],
    ["4b", "Wenckebach", "Normal", "Normal", "Progressively ↑",
     "Dropped beat", "Normal", "Normal", "Grouped beating, PR then dropped QRS"],
    ["4c", "Complete Block", "Ventricular <40", "Normal (faster)", "Dissociated",
     "Wide (escape)", "Normal", "Normal", "Full AV dissociation"],
    ["5", "LVH", "Normal", "Broad (P mitrale)", "Normal",
     "High voltage", "Lateral depression", "Lateral inversion", "SV1+RV5 ≥35mm + strain"],
    ["6", "HCM", "Normal", "Normal/enlarged", "Normal",
     "LVH; deep septal Q", "Depression", "Giant inversions", "Deep narrow Q V5-V6 ± apical HCM pattern"],
    ["7", "Pericarditis", "Tachycardia", "Normal", "PR depression",
     "Normal", "Concave ST↑ diffuse", "Upright→inverted", "Saddle ST + PR depression (Stage 1)"],
    ["8", "WPW", "Normal/tachy", "Normal", "<120ms (short)",
     "Wide (delta wave)", "Discordant", "Discordant", "Delta wave + short PR + pseudo-Q"],
    ["9", "DCM", "Tachycardia/AF", "Normal or AF", "Normal",
     "LBBB pattern", "Discordant (LBBB)", "Discordant", "New LBBB + poor R-wave progression"],
    ["10", "Pulmonary Embolism", "Tachycardia", "P pulmonale", "Normal",
     "RBBB possible", "S1 deep", "T inv V1-V4", "S1Q3T3 + right precordial T inversions"],
]

row_colors = [RED_LIGHT, AMBER_LIGHT, PURPLE_LIGHT,
              GREEN_LIGHT, GREEN_LIGHT, GREEN_LIGHT,
              AMBER_LIGHT, GOLD_LIGHT, BLUE_LIGHT,
              PINK_LIGHT, PURPLE_LIGHT, CYAN_LIGHT]

table_data = [[Paragraph(f"<b>{h}</b>", table_header_style) for h in headers]]
for row in rows:
    table_data.append([Paragraph(str(c), table_cell_style) for c in row])

comp_table = Table(table_data, colWidths=col_w, repeatRows=1)
ts = [
    ('BACKGROUND', (0,0), (-1,0), DARK_NAVY),
    ('GRID', (0,0), (-1,-1), 0.4, GREY),
    ('VALIGN', (0,0), (-1,-1), 'MIDDLE'),
    ('TOPPADDING', (0,0), (-1,-1), 3),
    ('BOTTOMPADDING', (0,0), (-1,-1), 3),
    ('LEFTPADDING', (0,0), (-1,-1), 3),
    ('RIGHTPADDING', (0,0), (-1,-1), 3),
    ('FONTNAME', (0,0), (-1,0), 'Helvetica-Bold'),
    ('FONTSIZE', (0,0), (-1,0), 7.5),
]
for i, rc in enumerate(row_colors):
    ts.append(('BACKGROUND', (0, i+1), (-1, i+1), rc))

comp_table.setStyle(TableStyle(ts))
story.append(comp_table)
story.append(Spacer(1, 0.5 * cm))

# Emergency summary
story.append(hr(RED, 1.5))
emergency_data = [[
    Paragraph("<b>⚡ EMERGENCY ECG RECOGNITION</b>",
              S('Normal', fontSize=9, textColor=WHITE, fontName='Helvetica-Bold',
                alignment=TA_CENTER)),
    Paragraph("<b>ACTION</b>",
              S('Normal', fontSize=9, textColor=WHITE, fontName='Helvetica-Bold',
                alignment=TA_CENTER)),
]]
emergency_rows = [
    ("STEMI: regional ST elevation in ≥2 contiguous leads", "Activate cath lab → PCI within 90 min"),
    ("WPW + AF: rapid wide irregular tachycardia", "DC cardioversion; avoid AV-nodal agents"),
    ("Complete heart block: AV dissociation + slow escape", "Transcutaneous pacing; transvenous pacing"),
    ("VF/pulseless VT: chaotic / wide QRS no output", "Defibrillation immediately + CPR"),
    ("PE: sinus tach + S1Q3T3 + right precordial T inversions", "CT-PA → anticoagulation ± thrombolysis"),
]
for cond, action in emergency_rows:
    emergency_data.append([
        Paragraph(f"• {cond}", S('Normal', fontSize=8, textColor=DARK_NAVY, fontName='Helvetica')),
        Paragraph(action, S('Normal', fontSize=8, textColor=RED, fontName='Helvetica-Bold')),
    ])

emerg_table = Table(emergency_data, colWidths=[W * 0.62, W * 0.38])
emerg_table.setStyle(TableStyle([
    ('BACKGROUND', (0,0), (-1,0), RED),
    ('ROWBACKGROUNDS', (0,1), (-1,-1), [RED_LIGHT, WHITE]),
    ('GRID', (0,0), (-1,-1), 0.4, RED),
    ('VALIGN', (0,0), (-1,-1), 'MIDDLE'),
    ('TOPPADDING', (0,0), (-1,-1), 4),
    ('BOTTOMPADDING', (0,0), (-1,-1), 4),
    ('LEFTPADDING', (0,0), (-1,-1), 6),
    ('RIGHTPADDING', (0,0), (-1,-1), 6),
]))
story.append(emerg_table)
story.append(Spacer(1, 6))
story.append(Paragraph(
    "Sources: Harrison's Principles of Internal Medicine 22E (2025) | Fuster and Hurst's The Heart 15E | "
    "Tintinalli's Emergency Medicine | Braunwald's Heart Disease | Goldman-Cecil Medicine",
    footer_style
))

# ─── BUILD ────────────────────────────────────────────────────────────────────
doc.build(story, onFirstPage=on_page, onLaterPages=on_page)
print(f"PDF saved: {OUTPUT}")
cd /home/daytona/workspace/ecg-pdf && python3 generate_ecg_pdf.py 2>&1
cd /home/daytona/workspace/ecg-pdf && python3 assemble_pdf.py 2>&1
~/ecg-pdf/assemble_pdf.py
Successfully replaced 1 instance(s) of the string in '/home/daytona/workspace/ecg-pdf/assemble_pdf.py'
cd /home/daytona/workspace/ecg-pdf && python3 assemble_pdf.py 2>&1
ls -lh /home/daytona/workspace/ecg-pdf/ECG_Patterns_Comparison.pdf && python3 -c " from pypdf import PdfReader r = PdfReader('/home/daytona/workspace/ecg-pdf/ECG_Patterns_Comparison.pdf') print(f'Pages: {len(r.pages)}') print(f'Title: {r.metadata.title}') for i, p in enumerate(r.pages): txt = p.extract_text() print(f' Page {i+1}: {len(txt)} chars') "
ECG Patterns Comparison
PDF Document · PDF
What's inside
- Color-coded index of all 10 diseases
- ECG component key (P, PR, QRS, ST, T, QT intervals with normal values)
- Drawn ECG waveform on pink grid paper with annotated features (ST arrows, delta waves, PR markers, etc.)
- Mechanism of the ECG change
- 6 key ECG findings as bullet points
- Localization / lead territories
- Clinical pearl (treatment traps, mimics, action thresholds)
- 12-column comparison table across all 10 conditions (heart rate, P wave, PR, QRS, ST, T wave, key sign)
- Emergency ECG recognition quick-reference with immediate actions (STEMI → cath lab, WPW+AF → cardioversion, complete heart block → pacing, etc.)
- Source citations from Harrison's, Braunwald's, Tintinalli's, Fuster & Hurst
Generate an interactive ECG lead anatomy poster showing all 12-lead placement and vectors
ls /home/daytona/workspace/ecg-pdf/ && node --version && python3 --version
mkdir -p /home/daytona/workspace/ecg-poster
~/ecg-poster/ECG_Lead_Anatomy_Poster.html
<!DOCTYPE html>
<html lang="en">
<head>
<meta charset="UTF-8">
<meta name="viewport" content="width=device-width, initial-scale=1.0">
<title>Interactive 12-Lead ECG Anatomy Poster</title>
<style>
/* ── RESET & BASE ─────────────────────────────────────────── */
*, *::before, *::after { box-sizing: border-box; margin: 0; padding: 0; }
:root {
--navy: #0D1B2A;
--navy2: #1B2A4A;
--teal: #00897B;
--teal2: #4DB6AC;
--teal3: #E0F2F1;
--red: #C62828;
--red2: #EF9A9A;
--red3: #FFEBEE;
--amber: #E65100;
--amber2: #FFB74D;
--amber3: #FFF3E0;
--green: #2E7D32;
--green2: #81C784;
--green3: #E8F5E9;
--blue: #1565C0;
--blue2: #90CAF9;
--blue3: #E3F2FD;
--purple: #6A1B9A;
--purp2: #CE93D8;
--purp3: #F3E5F5;
--grey: #546E7A;
--grey2: #B0BEC5;
--grey3: #ECEFF1;
--gold: #F57F17;
--gold3: #FFFDE7;
--white: #FFFFFF;
--skin: #F5CBA7;
--skin2: #FDEBD0;
--heart: #C0392B;
}
html { font-size: 15px; }
body {
font-family: 'Segoe UI', Arial, sans-serif;
background: var(--navy);
color: var(--grey3);
min-height: 100vh;
overflow-x: hidden;
}
/* ── HEADER ──────────────────────────────────────────────── */
header {
background: linear-gradient(135deg, var(--navy2) 0%, #0a2540 100%);
border-bottom: 3px solid var(--teal);
padding: 18px 32px 14px;
display: flex; align-items: center; justify-content: space-between;
position: sticky; top: 0; z-index: 200;
box-shadow: 0 4px 20px rgba(0,0,0,0.5);
}
header .title-block h1 {
font-size: 1.55rem; font-weight: 800; color: var(--white);
letter-spacing: 0.5px; line-height: 1.2;
}
header .title-block p {
font-size: 0.8rem; color: var(--teal2); margin-top: 3px;
}
header .badge-row {
display: flex; gap: 8px; flex-wrap: wrap;
}
.badge {
font-size: 0.7rem; font-weight: 700; padding: 4px 10px;
border-radius: 20px; text-transform: uppercase; letter-spacing: 0.6px;
cursor: pointer; transition: all 0.2s;
}
.badge:hover { transform: translateY(-1px); box-shadow: 0 3px 10px rgba(0,0,0,0.3); }
.badge-limb { background: var(--red); color: var(--white); }
.badge-aug { background: var(--amber); color: var(--white); }
.badge-precord{ background: var(--teal); color: var(--white); }
.badge-all { background: var(--grey); color: var(--white); }
.badge-vector { background: var(--purple); color: var(--white); }
.badge-reset { background: var(--navy2); color: var(--grey2); border: 1px solid var(--grey); }
/* ── MAIN LAYOUT ─────────────────────────────────────────── */
main {
display: grid;
grid-template-columns: 1fr 380px;
grid-template-rows: auto auto;
gap: 16px;
padding: 16px 20px;
max-width: 1400px;
margin: 0 auto;
}
/* ── PANEL CARD ──────────────────────────────────────────── */
.card {
background: rgba(27,42,74,0.7);
border: 1px solid rgba(77,182,172,0.25);
border-radius: 12px;
backdrop-filter: blur(4px);
overflow: hidden;
}
.card-header {
background: var(--navy2);
padding: 10px 16px;
font-size: 0.78rem; font-weight: 700;
text-transform: uppercase; letter-spacing: 1px;
color: var(--teal2);
border-bottom: 1px solid rgba(77,182,172,0.2);
display: flex; align-items: center; gap: 8px;
}
.card-header .dot {
width: 8px; height: 8px; border-radius: 50%;
background: var(--teal); flex-shrink: 0;
}
/* ── ANATOMY PANEL ───────────────────────────────────────── */
#anatomy-panel {
grid-column: 1; grid-row: 1 / 3;
position: relative;
}
#anatomy-svg {
width: 100%; height: auto;
display: block;
cursor: crosshair;
}
/* ── INFO PANEL ──────────────────────────────────────────── */
#info-panel {
grid-column: 2; grid-row: 1;
}
#info-content { padding: 14px 16px; }
#lead-name {
font-size: 1.5rem; font-weight: 800; color: var(--white);
margin-bottom: 4px;
}
#lead-type-badge {
display: inline-block;
font-size: 0.7rem; font-weight: 700; padding: 3px 10px;
border-radius: 12px; text-transform: uppercase; letter-spacing: 0.5px;
margin-bottom: 12px;
}
.info-section { margin-bottom: 12px; }
.info-section h4 {
font-size: 0.72rem; text-transform: uppercase; letter-spacing: 0.8px;
color: var(--teal2); margin-bottom: 5px; font-weight: 700;
}
.info-section p, .info-section li {
font-size: 0.82rem; line-height: 1.55; color: var(--grey2);
}
.info-section ul { padding-left: 16px; }
.info-section li { margin-bottom: 3px; }
.highlight { color: var(--white); font-weight: 600; }
.tag-row { display: flex; flex-wrap: wrap; gap: 5px; margin-top: 6px; }
.tag {
font-size: 0.7rem; padding: 3px 9px; border-radius: 10px;
font-weight: 600; background: rgba(255,255,255,0.08);
color: var(--grey2); border: 1px solid rgba(255,255,255,0.12);
}
.tag.active { background: rgba(77,182,172,0.2); color: var(--teal2); border-color: var(--teal); }
/* ECG mini strip */
#ecg-strip-wrap {
background: #1a0a0a; border-radius: 8px; padding: 6px;
margin-top: 6px;
}
#ecg-strip-canvas {
display: block; width: 100%; height: 60px;
border-radius: 4px;
}
.strip-label {
font-size: 0.65rem; color: var(--grey2); margin-top: 3px; text-align: center;
}
/* ── LEADS GRID ──────────────────────────────────────────── */
#leads-panel {
grid-column: 2; grid-row: 2;
}
#leads-grid {
display: grid;
grid-template-columns: repeat(4, 1fr);
gap: 5px;
padding: 10px;
}
.lead-btn {
padding: 8px 4px;
border-radius: 8px;
border: 1.5px solid rgba(255,255,255,0.1);
background: rgba(255,255,255,0.04);
color: var(--grey2);
font-size: 0.78rem; font-weight: 700;
cursor: pointer;
text-align: center;
transition: all 0.18s;
position: relative;
display: flex; flex-direction: column;
align-items: center; justify-content: center;
gap: 3px;
}
.lead-btn:hover {
transform: translateY(-2px);
box-shadow: 0 4px 14px rgba(0,0,0,0.4);
}
.lead-btn.active {
border-width: 2px;
color: var(--white);
}
.lead-btn .lead-sub {
font-size: 0.6rem; font-weight: 400; opacity: 0.75;
}
.lead-btn .lead-dot {
width: 6px; height: 6px; border-radius: 50%;
background: currentColor; opacity: 0.6;
}
/* type colours */
.lead-limb { border-color: rgba(198,40,40,0.3); }
.lead-limb.active { background: rgba(198,40,40,0.18); border-color: var(--red); color: #FF8A80; }
.lead-aug { border-color: rgba(230,81,0,0.3); }
.lead-aug.active { background: rgba(230,81,0,0.18); border-color: var(--amber); color: #FFCC80; }
.lead-precord{ border-color: rgba(0,137,123,0.3); }
.lead-precord.active{ background: rgba(0,137,123,0.18); border-color: var(--teal); color: var(--teal2); }
/* ── TOOLTIP ─────────────────────────────────────────────── */
#tooltip {
position: fixed;
background: var(--navy2);
border: 1px solid var(--teal);
border-radius: 8px;
padding: 8px 12px;
font-size: 0.75rem;
color: var(--white);
pointer-events: none;
z-index: 999;
opacity: 0;
transition: opacity 0.15s;
max-width: 200px;
box-shadow: 0 4px 20px rgba(0,0,0,0.5);
}
#tooltip.show { opacity: 1; }
#tooltip .tt-title { font-weight: 800; margin-bottom: 3px; font-size: 0.8rem; }
#tooltip .tt-body { color: var(--grey2); line-height: 1.4; }
/* ── AXIS WHEEL ──────────────────────────────────────────── */
#axis-panel {
grid-column: 1; grid-row: 2;
/* Shows in bottom-left of anatomy panel area – we'll place below grid */
display: none; /* toggled */
}
/* ── LEGEND ──────────────────────────────────────────────── */
#legend {
padding: 10px 16px 14px;
display: flex; gap: 18px; flex-wrap: wrap;
}
.legend-item {
display: flex; align-items: center; gap: 6px;
font-size: 0.73rem; color: var(--grey2);
}
.legend-color {
width: 28px; height: 4px; border-radius: 2px;
}
/* ── FOOTER ──────────────────────────────────────────────── */
footer {
text-align: center; padding: 10px;
font-size: 0.68rem; color: var(--grey);
border-top: 1px solid rgba(255,255,255,0.06);
margin-top: 8px;
}
/* ── ANIMATIONS ──────────────────────────────────────────── */
@keyframes pulse-ring {
0% { r: 10; opacity: 0.9; }
50% { r: 17; opacity: 0.5; }
100% { r: 10; opacity: 0.9; }
}
.electrode-pulse { animation: pulse-ring 1.8s ease-in-out infinite; }
@keyframes draw-vector {
from { stroke-dashoffset: 400; }
to { stroke-dashoffset: 0; }
}
.vector-line {
stroke-dasharray: 400;
animation: draw-vector 0.8s ease-out forwards;
}
/* ── RESPONSIVE ──────────────────────────────────────────── */
@media (max-width: 900px) {
main { grid-template-columns: 1fr; grid-template-rows: auto; }
#anatomy-panel { grid-column: 1; grid-row: 1; }
#info-panel { grid-column: 1; grid-row: 2; }
#leads-panel { grid-column: 1; grid-row: 3; }
}
</style>
</head>
<body>
<!-- ══════════════════════════════════════════ HEADER -->
<header>
<div class="title-block">
<h1>⚡ Interactive 12-Lead ECG Anatomy Poster</h1>
<p>Click any electrode or lead button to explore placement, vectors & waveforms</p>
</div>
<div class="badge-row">
<span class="badge badge-limb" onclick="filterLeads('limb')">Limb Leads</span>
<span class="badge badge-aug" onclick="filterLeads('aug')">Augmented</span>
<span class="badge badge-precord" onclick="filterLeads('precord')">Precordial</span>
<span class="badge badge-vector" onclick="toggleVectors()">Vectors</span>
<span class="badge badge-all" onclick="filterLeads('all')">All Leads</span>
<span class="badge badge-reset" onclick="resetAll()">Reset</span>
</div>
</header>
<!-- ══════════════════════════════════════════ TOOLTIP -->
<div id="tooltip">
<div class="tt-title" id="tt-title"></div>
<div class="tt-body" id="tt-body"></div>
</div>
<!-- ══════════════════════════════════════════ MAIN -->
<main>
<!-- ── ANATOMY PANEL ──────────────────────────────── -->
<div class="card" id="anatomy-panel">
<div class="card-header"><span class="dot"></span>Body Anatomy — Electrode Placement & Lead Vectors</div>
<svg id="anatomy-svg" viewBox="0 0 820 680" xmlns="http://www.w3.org/2000/svg">
<defs>
<!-- Gradients -->
<radialGradient id="bodyGrad" cx="50%" cy="40%" r="55%">
<stop offset="0%" stop-color="#F5CBA7"/>
<stop offset="100%" stop-color="#D4956A"/>
</radialGradient>
<radialGradient id="heartGrad" cx="50%" cy="40%" r="60%">
<stop offset="0%" stop-color="#E74C3C"/>
<stop offset="100%" stop-color="#7B241C"/>
</radialGradient>
<radialGradient id="chestGrad" cx="50%" cy="30%" r="60%">
<stop offset="0%" stop-color="#F5CBA7"/>
<stop offset="100%" stop-color="#C49A6C"/>
</radialGradient>
<!-- Electrode glow filter -->
<filter id="elec-glow" x="-50%" y="-50%" width="200%" height="200%">
<feGaussianBlur stdDeviation="3" result="blur"/>
<feMerge><feMergeNode in="blur"/><feMergeNode in="SourceGraphic"/></feMerge>
</filter>
<filter id="elec-glow-strong" x="-80%" y="-80%" width="260%" height="260%">
<feGaussianBlur stdDeviation="5" result="blur"/>
<feMerge><feMergeNode in="blur"/><feMergeNode in="SourceGraphic"/></feMerge>
</filter>
<!-- Arrow marker -->
<marker id="arrowhead" markerWidth="8" markerHeight="6" refX="8" refY="3" orient="auto">
<polygon points="0 0, 8 3, 0 6" fill="currentColor"/>
</marker>
<marker id="arrowhead-red" markerWidth="8" markerHeight="6" refX="8" refY="3" orient="auto">
<polygon points="0 0, 8 3, 0 6" fill="#FF5252"/>
</marker>
<marker id="arrowhead-blue" markerWidth="8" markerHeight="6" refX="8" refY="3" orient="auto">
<polygon points="0 0, 8 3, 0 6" fill="#448AFF"/>
</marker>
<marker id="arrowhead-green" markerWidth="8" markerHeight="6" refX="8" refY="3" orient="auto">
<polygon points="0 0, 8 3, 0 6" fill="#69F0AE"/>
</marker>
<marker id="arrowhead-gold" markerWidth="8" markerHeight="6" refX="8" refY="3" orient="auto">
<polygon points="0 0, 8 3, 0 6" fill="#FFD740"/>
</marker>
<marker id="arrowhead-purple" markerWidth="8" markerHeight="6" refX="8" refY="3" orient="auto">
<polygon points="0 0, 8 3, 0 6" fill="#E040FB"/>
</marker>
</defs>
<!-- ─ BACKGROUND ─ -->
<rect width="820" height="680" fill="#0D1B2A" rx="12"/>
<!-- ECG grid subtle background -->
<g opacity="0.05">
<line x1="0" x2="820" y1="50" y2="50" stroke="#4DB6AC" stroke-width="0.5"/>
<line x1="0" x2="820" y1="100" y2="100" stroke="#4DB6AC" stroke-width="1"/>
<line x1="0" x2="820" y1="150" y2="150" stroke="#4DB6AC" stroke-width="0.5"/>
<line x1="0" x2="820" y1="200" y2="200" stroke="#4DB6AC" stroke-width="1"/>
<line x1="0" x2="820" y1="250" y2="250" stroke="#4DB6AC" stroke-width="0.5"/>
<line x1="0" x2="820" y1="300" y2="300" stroke="#4DB6AC" stroke-width="1"/>
<line x1="0" x2="820" y1="350" y2="350" stroke="#4DB6AC" stroke-width="0.5"/>
<line x1="0" x2="820" y1="400" y2="400" stroke="#4DB6AC" stroke-width="1"/>
<line x1="0" x2="820" y1="450" y2="450" stroke="#4DB6AC" stroke-width="0.5"/>
<line x1="0" x2="820" y1="500" y2="500" stroke="#4DB6AC" stroke-width="1"/>
<line x1="0" x2="820" y1="550" y2="550" stroke="#4DB6AC" stroke-width="0.5"/>
<line x1="0" x2="820" y1="600" y2="600" stroke="#4DB6AC" stroke-width="1"/>
<line x1="50" y1="0" x2="50" y2="680" stroke="#4DB6AC" stroke-width="0.5"/>
<line x1="100" y1="0" x2="100" y2="680" stroke="#4DB6AC" stroke-width="1"/>
<line x1="150" y1="0" x2="150" y2="680" stroke="#4DB6AC" stroke-width="0.5"/>
<line x1="200" y1="0" x2="200" y2="680" stroke="#4DB6AC" stroke-width="1"/>
<line x1="250" y1="0" x2="250" y2="680" stroke="#4DB6AC" stroke-width="0.5"/>
<line x1="300" y1="0" x2="300" y2="680" stroke="#4DB6AC" stroke-width="1"/>
<line x1="350" y1="0" x2="350" y2="680" stroke="#4DB6AC" stroke-width="0.5"/>
<line x1="400" y1="0" x2="400" y2="680" stroke="#4DB6AC" stroke-width="1"/>
<line x1="450" y1="0" x2="450" y2="680" stroke="#4DB6AC" stroke-width="0.5"/>
<line x1="500" y1="0" x2="500" y2="680" stroke="#4DB6AC" stroke-width="1"/>
<line x1="550" y1="0" x2="550" y2="680" stroke="#4DB6AC" stroke-width="0.5"/>
<line x1="600" y1="0" x2="600" y2="680" stroke="#4DB6AC" stroke-width="1"/>
<line x1="650" y1="0" x2="650" y2="680" stroke="#4DB6AC" stroke-width="0.5"/>
<line x1="700" y1="0" x2="700" y2="680" stroke="#4DB6AC" stroke-width="1"/>
<line x1="750" y1="0" x2="750" y2="680" stroke="#4DB6AC" stroke-width="0.5"/>
<line x1="800" y1="0" x2="800" y2="680" stroke="#4DB6AC" stroke-width="1"/>
</g>
<!-- ─ BODY SILHOUETTE (torso + limbs) ─ -->
<!-- Torso -->
<ellipse cx="410" cy="340" rx="105" ry="165" fill="url(#bodyGrad)" opacity="0.92"/>
<!-- Neck -->
<rect x="383" y="165" width="54" height="60" rx="8" fill="url(#bodyGrad)" opacity="0.92"/>
<!-- Head -->
<ellipse cx="410" cy="130" rx="58" ry="70" fill="url(#bodyGrad)" opacity="0.92"/>
<!-- Left arm -->
<path d="M305,210 Q265,250 230,350 Q220,380 225,420" stroke="url(#bodyGrad)" stroke-width="42" fill="none" stroke-linecap="round" opacity="0.92"/>
<!-- Right arm -->
<path d="M515,210 Q555,250 590,350 Q600,380 595,420" stroke="url(#bodyGrad)" stroke-width="42" fill="none" stroke-linecap="round" opacity="0.92"/>
<!-- Left leg -->
<path d="M360,490 Q340,540 330,590 Q325,630 325,655" stroke="url(#bodyGrad)" stroke-width="48" fill="none" stroke-linecap="round" opacity="0.92"/>
<!-- Right leg -->
<path d="M460,490 Q480,540 490,590 Q495,630 495,655" stroke="url(#bodyGrad)" stroke-width="48" fill="none" stroke-linecap="round" opacity="0.92"/>
<!-- Body outline -->
<ellipse cx="410" cy="340" rx="105" ry="165" fill="none" stroke="#C49A6C" stroke-width="1.2" opacity="0.4"/>
<!-- ─ CHEST DETAIL ─ -->
<!-- Rib cage hint -->
<g opacity="0.12" stroke="#C49A6C" stroke-width="1.5" fill="none">
<ellipse cx="410" cy="280" rx="70" ry="25"/>
<ellipse cx="410" cy="305" rx="75" ry="22"/>
<ellipse cx="410" cy="330" rx="78" ry="20"/>
<ellipse cx="410" cy="355" rx="75" ry="18"/>
<line x1="410" y1="255" x2="410" y2="465"/>
</g>
<!-- ─ HEART ─ -->
<g id="heart-group" transform="translate(388,300) scale(0.42)" opacity="0.95">
<path d="M50,30 A30,30,0,0,1,100,30 A30,30,0,0,1,150,30 Q150,60,100,100 Q50,60,50,30 Z"
fill="url(#heartGrad)" stroke="#7B241C" stroke-width="2"/>
<!-- heart shine -->
<ellipse cx="75" cy="40" rx="18" ry="10" fill="rgba(255,255,255,0.15)" transform="rotate(-20,75,40)"/>
</g>
<text x="370" y="296" fill="#FF8A80" font-size="9" font-weight="700" opacity="0.7">♥ Heart</text>
<!-- ─ TITLE LABELS ─ -->
<text x="410" y="22" fill="#4DB6AC" font-size="13" font-weight="800" text-anchor="middle" letter-spacing="2">12-LEAD ECG — ELECTRODE PLACEMENT</text>
<!-- ══════════════════════ LEAD VECTORS (group, toggled) ══ -->
<g id="vectors-group" opacity="0" style="transition:opacity 0.4s">
<!-- Einthoven triangle: I, II, III -->
<!-- Lead I: RA → LA (right to left, horizontal) -->
<line x1="225" y1="400" x2="597" y2="400" stroke="#FF5252" stroke-width="2.2" stroke-dasharray="8,4" opacity="0.85" marker-end="url(#arrowhead-red)"/>
<text x="411" y="393" fill="#FF5252" font-size="9.5" font-weight="700" text-anchor="middle">Lead I (0°)</text>
<!-- Lead II: RA → LL (top-right to bottom-left) -->
<line x1="225" y1="400" x2="325" y2="640" stroke="#448AFF" stroke-width="2.2" stroke-dasharray="8,4" opacity="0.85" marker-end="url(#arrowhead-blue)"/>
<text x="255" y="540" fill="#448AFF" font-size="9.5" font-weight="700">Lead II (60°)</text>
<!-- Lead III: LA → LL -->
<line x1="597" y1="400" x2="325" y2="640" stroke="#69F0AE" stroke-width="2.2" stroke-dasharray="8,4" opacity="0.85" marker-end="url(#arrowhead-green)"/>
<text x="490" y="555" fill="#69F0AE" font-size="9.5" font-weight="700">Lead III (120°)</text>
<!-- aVR: toward RA (-150°) -->
<line x1="411" y1="450" x2="225" y2="400" stroke="#FFD740" stroke-width="2.2" stroke-dasharray="5,4" opacity="0.8" marker-end="url(#arrowhead-gold)"/>
<text x="290" y="420" fill="#FFD740" font-size="9" font-weight="700" text-anchor="middle">aVR (-150°)</text>
<!-- aVL: toward LA (-30°) -->
<line x1="411" y1="450" x2="597" y2="400" stroke="#FFD740" stroke-width="1.8" stroke-dasharray="5,4" opacity="0.7" marker-end="url(#arrowhead-gold)"/>
<text x="530" y="418" fill="#FFD740" font-size="9" font-weight="700">aVL (-30°)</text>
<!-- aVF: toward LL (+90°) -->
<line x1="411" y1="450" x2="411" y2="640" stroke="#FFD740" stroke-width="1.8" stroke-dasharray="5,4" opacity="0.7" marker-end="url(#arrowhead-gold)"/>
<text x="420" y="570" fill="#FFD740" font-size="9" font-weight="700">aVF (+90°)</text>
<!-- Central terminal marker -->
<circle cx="411" cy="450" r="5" fill="#FFD740" opacity="0.7"/>
<text x="425" y="455" fill="#FFD740" font-size="8" opacity="0.8">Wilson CT</text>
<!-- Precordial vectors (horizontal plane arrows) -->
<line x1="411" y1="310" x2="480" y2="268" stroke="#E040FB" stroke-width="1.6" stroke-dasharray="4,3" opacity="0.7" marker-end="url(#arrowhead-purple)"/>
<line x1="411" y1="310" x2="450" y2="268" stroke="#E040FB" stroke-width="1.6" stroke-dasharray="4,3" opacity="0.65" marker-end="url(#arrowhead-purple)"/>
<line x1="411" y1="310" x2="435" y2="267" stroke="#E040FB" stroke-width="1.6" stroke-dasharray="4,3" opacity="0.6" marker-end="url(#arrowhead-purple)"/>
<line x1="411" y1="310" x2="420" y2="267" stroke="#E040FB" stroke-width="1.6" stroke-dasharray="4,3" opacity="0.55" marker-end="url(#arrowhead-purple)"/>
<line x1="411" y1="310" x2="395" y2="267" stroke="#E040FB" stroke-width="1.6" stroke-dasharray="4,3" opacity="0.5" marker-end="url(#arrowhead-purple)"/>
<line x1="411" y1="310" x2="375" y2="265" stroke="#E040FB" stroke-width="1.6" stroke-dasharray="4,3" opacity="0.45" marker-end="url(#arrowhead-purple)"/>
<text x="455" y="258" fill="#E040FB" font-size="8.5" font-weight="700">V1→V6 vectors</text>
</g>
<!-- ══════════════════════ ELECTRODES ══════════════════ -->
<!-- Each electrode: outer glow circle + inner circle + label -->
<!-- Color convention: RA=red, LA=yellow, RL=black(green here), LL=green, precordial=teal/white -->
<!-- ── LIMB ELECTRODES ── -->
<!-- RA - Right Arm (patient's right = our left in image) -->
<g id="elec-RA" class="electrode" data-lead="RA" transform="translate(225,400)"
style="cursor:pointer" onclick="selectElectrode('RA')">
<circle r="18" fill="rgba(198,40,40,0.15)" class="electrode-pulse" stroke="#C62828" stroke-width="1" stroke-dasharray="4,2"/>
<circle r="11" fill="#C62828" filter="url(#elec-glow)"/>
<circle r="7" fill="#FF5252"/>
<text x="0" y="-20" fill="#FF8A80" font-size="10" font-weight="800" text-anchor="middle">RA</text>
<text x="0" y="28" fill="#EF9A9A" font-size="8" text-anchor="middle">Right Arm</text>
</g>
<!-- LA - Left Arm -->
<g id="elec-LA" class="electrode" data-lead="LA" transform="translate(597,400)"
style="cursor:pointer" onclick="selectElectrode('LA')">
<circle r="18" fill="rgba(230,81,0,0.15)" class="electrode-pulse" stroke="#E65100" stroke-width="1" stroke-dasharray="4,2" style="animation-delay:0.3s"/>
<circle r="11" fill="#E65100" filter="url(#elec-glow)"/>
<circle r="7" fill="#FF9800"/>
<text x="0" y="-20" fill="#FFB74D" font-size="10" font-weight="800" text-anchor="middle">LA</text>
<text x="0" y="28" fill="#FFCC80" font-size="8" text-anchor="middle">Left Arm</text>
</g>
<!-- RL - Right Leg (ground) -->
<g id="elec-RL" class="electrode" data-lead="RL" transform="translate(325,641)"
style="cursor:pointer" onclick="selectElectrode('RL')">
<circle r="15" fill="rgba(55,71,79,0.3)" stroke="#546E7A" stroke-width="1" stroke-dasharray="4,2"/>
<circle r="9" fill="#546E7A"/>
<circle r="5" fill="#90A4AE"/>
<text x="0" y="-18" fill="#B0BEC5" font-size="10" font-weight="800" text-anchor="middle">RL</text>
<text x="0" y="22" fill="#90A4AE" font-size="8" text-anchor="middle">Right Leg (GND)</text>
</g>
<!-- LL - Left Leg -->
<g id="elec-LL" class="electrode" data-lead="LL" transform="translate(495,641)"
style="cursor:pointer" onclick="selectElectrode('LL')">
<circle r="18" fill="rgba(46,125,50,0.15)" class="electrode-pulse" stroke="#2E7D32" stroke-width="1" stroke-dasharray="4,2" style="animation-delay:0.6s"/>
<circle r="11" fill="#2E7D32" filter="url(#elec-glow)"/>
<circle r="7" fill="#66BB6A"/>
<text x="0" y="-20" fill="#81C784" font-size="10" font-weight="800" text-anchor="middle">LL</text>
<text x="0" y="28" fill="#A5D6A7" font-size="8" text-anchor="middle">Left Leg</text>
</g>
<!-- ── PRECORDIAL ELECTRODES ── -->
<!-- V1 - 4th ICS, Right sternal border -->
<g id="elec-V1" class="electrode" data-lead="V1" transform="translate(450,268)"
style="cursor:pointer" onclick="selectElectrode('V1')">
<circle r="14" fill="rgba(0,137,123,0.25)" stroke="#00897B" stroke-width="1.5" style="animation:pulse-ring 2s 0.1s infinite"/>
<circle r="9" fill="#00695C" filter="url(#elec-glow)"/>
<circle r="5" fill="#4DB6AC"/>
<text x="18" y="4" fill="#4DB6AC" font-size="10" font-weight="800">V1</text>
<text x="18" y="15" fill="#80CBC4" font-size="7.5">4th ICS, R sternal</text>
</g>
<!-- V2 - 4th ICS, Left sternal border -->
<g id="elec-V2" class="electrode" data-lead="V2" transform="translate(372,266)"
style="cursor:pointer" onclick="selectElectrode('V2')">
<circle r="14" fill="rgba(0,137,123,0.25)" stroke="#00897B" stroke-width="1.5" style="animation:pulse-ring 2s 0.2s infinite"/>
<circle r="9" fill="#00695C" filter="url(#elec-glow)"/>
<circle r="5" fill="#4DB6AC"/>
<text x="-33" y="4" fill="#4DB6AC" font-size="10" font-weight="800" text-anchor="end">V2</text>
<text x="-34" y="15" fill="#80CBC4" font-size="7.5" text-anchor="end">4th ICS, L sternal</text>
</g>
<!-- V3 - Between V2 and V4 -->
<g id="elec-V3" class="electrode" data-lead="V3" transform="translate(395,293)"
style="cursor:pointer" onclick="selectElectrode('V3')">
<circle r="14" fill="rgba(0,137,123,0.25)" stroke="#00897B" stroke-width="1.5" style="animation:pulse-ring 2s 0.3s infinite"/>
<circle r="9" fill="#00695C" filter="url(#elec-glow)"/>
<circle r="5" fill="#4DB6AC"/>
<text x="-33" y="4" fill="#4DB6AC" font-size="10" font-weight="800" text-anchor="end">V3</text>
<text x="-34" y="15" fill="#80CBC4" font-size="7.5" text-anchor="end">Between V2-V4</text>
</g>
<!-- V4 - 5th ICS, MCL -->
<g id="elec-V4" class="electrode" data-lead="V4" transform="translate(408,325)"
style="cursor:pointer" onclick="selectElectrode('V4')">
<circle r="14" fill="rgba(0,137,123,0.25)" stroke="#00897B" stroke-width="1.5" style="animation:pulse-ring 2s 0.4s infinite"/>
<circle r="9" fill="#00695C" filter="url(#elec-glow)"/>
<circle r="5" fill="#4DB6AC"/>
<text x="-33" y="4" fill="#4DB6AC" font-size="10" font-weight="800" text-anchor="end">V4</text>
<text x="-34" y="15" fill="#80CBC4" font-size="7.5" text-anchor="end">5th ICS, MCL</text>
</g>
<!-- V5 - Anterior axillary line, same level V4 -->
<g id="elec-V5" class="electrode" data-lead="V5" transform="translate(440,338)"
style="cursor:pointer" onclick="selectElectrode('V5')">
<circle r="14" fill="rgba(0,137,123,0.25)" stroke="#00897B" stroke-width="1.5" style="animation:pulse-ring 2s 0.5s infinite"/>
<circle r="9" fill="#00695C" filter="url(#elec-glow)"/>
<circle r="5" fill="#4DB6AC"/>
<text x="20" y="4" fill="#4DB6AC" font-size="10" font-weight="800">V5</text>
<text x="20" y="15" fill="#80CBC4" font-size="7.5">Ant. axillary line</text>
</g>
<!-- V6 - Mid-axillary line, same level V4 -->
<g id="elec-V6" class="electrode" data-lead="V6" transform="translate(475,345)"
style="cursor:pointer" onclick="selectElectrode('V6')">
<circle r="14" fill="rgba(0,137,123,0.25)" stroke="#00897B" stroke-width="1.5" style="animation:pulse-ring 2s 0.6s infinite"/>
<circle r="9" fill="#00695C" filter="url(#elec-glow)"/>
<circle r="5" fill="#4DB6AC"/>
<text x="20" y="4" fill="#4DB6AC" font-size="10" font-weight="800">V6</text>
<text x="20" y="15" fill="#80CBC4" font-size="7.5">Mid-axillary line</text>
</g>
<!-- ── LEAD WIRES (dashed lines from electrodes) ── -->
<!-- RA wire → machine (left) -->
<line x1="225" y1="400" x2="80" y2="400" stroke="#C62828" stroke-width="1.5" stroke-dasharray="6,3" opacity="0.5"/>
<text x="44" y="396" fill="#EF9A9A" font-size="8" text-anchor="middle">RED</text>
<!-- LA wire → machine (right) -->
<line x1="597" y1="400" x2="740" y2="380" stroke="#E65100" stroke-width="1.5" stroke-dasharray="6,3" opacity="0.5"/>
<text x="762" y="376" fill="#FFCC80" font-size="8">YEL</text>
<!-- LL wire → machine (right) -->
<line x1="495" y1="641" x2="740" y2="620" stroke="#2E7D32" stroke-width="1.5" stroke-dasharray="6,3" opacity="0.5"/>
<text x="762" y="616" fill="#A5D6A7" font-size="8">GRN</text>
<!-- RL wire -->
<line x1="325" y1="641" x2="80" y2="620" stroke="#546E7A" stroke-width="1.5" stroke-dasharray="6,3" opacity="0.4"/>
<text x="44" y="616" fill="#B0BEC5" font-size="8" text-anchor="middle">BLK</text>
<!-- V1-V6 wires to machine hint -->
<path d="M450,268 Q600,250 740,260" stroke="#00897B" stroke-width="1.2" stroke-dasharray="5,4" fill="none" opacity="0.35"/>
<path d="M372,266 Q350,240 300,240 Q250,240 200,250 Q150,260 100,265" stroke="#00897B" stroke-width="1.2" stroke-dasharray="5,4" fill="none" opacity="0.25"/>
<!-- ── ECG MACHINE BOX ── -->
<rect x="30" y="435" width="110" height="60" rx="8" fill="#1B2A4A" stroke="#4DB6AC" stroke-width="1.5" opacity="0.9"/>
<text x="85" y="457" fill="#4DB6AC" font-size="8.5" font-weight="700" text-anchor="middle">ECG MACHINE</text>
<text x="85" y="471" fill="#80CBC4" font-size="7" text-anchor="middle">12-lead recorder</text>
<rect x="40" y="478" width="90" height="10" rx="3" fill="#0D1B2A"/>
<!-- Mini ECG wave in machine -->
<polyline points="42,483 48,483 51,477 55,489 59,483 65,483 68,479 72,487 76,483 90,483 93,479 97,487 101,483 128,483"
stroke="#4DB6AC" stroke-width="1.2" fill="none"/>
<!-- Right machine -->
<rect x="680" y="435" width="110" height="60" rx="8" fill="#1B2A4A" stroke="#4DB6AC" stroke-width="1.5" opacity="0.9"/>
<text x="735" y="457" fill="#4DB6AC" font-size="8.5" font-weight="700" text-anchor="middle">ECG MACHINE</text>
<text x="735" y="471" fill="#80CBC4" font-size="7" text-anchor="middle">Chest leads V1–V6</text>
<rect x="690" y="478" width="90" height="10" rx="3" fill="#0D1B2A"/>
<polyline points="692,483 698,483 701,477 705,489 709,483 715,483 718,479 722,487 726,483 740,483 743,479 747,487 751,483 778,483"
stroke="#4DB6AC" stroke-width="1.2" fill="none"/>
<!-- ── HEXAXIAL REFERENCE SYSTEM (bottom-left) ── -->
<g transform="translate(100,525)" id="hexaxial">
<text x="0" y="-40" fill="#FFD740" font-size="10" font-weight="700" text-anchor="middle">HEXAXIAL SYSTEM</text>
<circle cx="0" cy="0" r="60" fill="none" stroke="#2a3a5a" stroke-width="1.2"/>
<circle cx="0" cy="0" r="60" fill="none" stroke="#FFD740" stroke-width="0.5" stroke-dasharray="3,4" opacity="0.4"/>
<!-- Axis lines with labels -->
<!-- Lead I: 0° -->
<line x1="-60" y1="0" x2="60" y2="0" stroke="#FF5252" stroke-width="1.8"/>
<text x="65" y="4" fill="#FF5252" font-size="8.5" font-weight="700">I (0°)</text>
<text x="-82" y="4" fill="#FF5252" font-size="8.5" font-weight="700" text-anchor="end">aVR (-150°)</text>
<!-- Lead II: 60° -->
<line x1="-30" y1="-52" x2="30" y2="52" stroke="#448AFF" stroke-width="1.8"/>
<text x="34" y="60" fill="#448AFF" font-size="8.5" font-weight="700">II (60°)</text>
<text x="-40" y="-60" fill="#448AFF" font-size="8.5" font-weight="700" text-anchor="end">aVL (-30°)</text>
<!-- Lead III: 120° -->
<line x1="30" y1="-52" x2="-30" y2="52" stroke="#69F0AE" stroke-width="1.8"/>
<text x="-38" y="62" fill="#69F0AE" font-size="8.5" font-weight="700" text-anchor="end">III (120°)</text>
<text x="38" y="-58" fill="#69F0AE" font-size="8.5" font-weight="700">aVR (-60°)</text>
<!-- aVF: 90° -->
<line x1="0" y1="-60" x2="0" y2="60" stroke="#FFD740" stroke-width="1.5" stroke-dasharray="5,3"/>
<text x="5" y="74" fill="#FFD740" font-size="8.5" font-weight="700">aVF (+90°)</text>
<text x="5" y="-65" fill="#FFD740" font-size="8.5" font-weight="700">aVR (-90°)</text>
<!-- Normal axis marker -->
<path d="M0,0 L52,30" stroke="white" stroke-width="2.5" marker-end="url(#arrowhead)"/>
<text x="30" y="10" fill="white" font-size="7.5" font-weight="700">Normal axis</text>
<text x="30" y="20" fill="#80CBC4" font-size="7">(0° to +90°)</text>
<!-- Center dot -->
<circle cx="0" cy="0" r="4" fill="#FFD740"/>
<!-- Quadrant labels -->
<text x="40" y="50" fill="#90A4AE" font-size="7" opacity="0.7">Normal</text>
<text x="-62" y="50" fill="#FF8A80" font-size="7" opacity="0.7">RAD</text>
<text x="30" y="-40" fill="#FFCC80" font-size="7" opacity="0.7">LAD</text>
<text x="-55" y="-40" fill="#CE93D8" font-size="7" opacity="0.7">Extreme</text>
</g>
<!-- ── PRECORDIAL CROSS-SECTION (right side) ── -->
<g transform="translate(680,525)" id="cross-section">
<text x="0" y="-55" fill="#E040FB" font-size="10" font-weight="700" text-anchor="middle">PRECORDIAL LEADS</text>
<text x="0" y="-44" fill="#B0BEC5" font-size="7.5" text-anchor="middle">Horizontal plane cross-section</text>
<!-- Torso cross-section oval -->
<ellipse cx="0" cy="0" rx="65" ry="52" fill="rgba(245,203,167,0.08)" stroke="#C49A6C" stroke-width="1.2"/>
<!-- Spine -->
<circle cx="0" cy="30" r="8" fill="rgba(100,80,60,0.5)" stroke="#8D6E63" stroke-width="1"/>
<text x="0" cy="33" fill="#A1887F" font-size="6.5" text-anchor="middle" dy="13">Spine</text>
<!-- Sternum -->
<rect x="-6" y="-52" width="12" height="24" rx="3" fill="rgba(200,180,160,0.3)" stroke="#A1887F" stroke-width="1"/>
<!-- Heart cross-section -->
<ellipse cx="-12" cy="-5" rx="18" ry="15" fill="rgba(183,28,28,0.3)" stroke="#C62828" stroke-width="1.5"/>
<text x="-12" y="-1" fill="#EF9A9A" font-size="6.5" text-anchor="middle" font-weight="700">LV</text>
<ellipse cx="10" cy="-8" rx="12" ry="10" fill="rgba(183,28,28,0.2)" stroke="#C62828" stroke-width="1"/>
<text x="10" y="-5" fill="#EF9A9A" font-size="6" text-anchor="middle">RV</text>
<!-- V1-V6 electrode positions on cross-section -->
<!-- V1: right sternal border -->
<circle cx="22" cy="-45" r="5" fill="#C62828" stroke="#FF5252" stroke-width="1.5" style="cursor:pointer" onclick="selectElectrode('V1')"/>
<text x="30" y="-47" fill="#4DB6AC" font-size="8" font-weight="700">V1</text>
<!-- V2: left sternal border -->
<circle cx="-20" cy="-45" r="5" fill="#00695C" stroke="#4DB6AC" stroke-width="1.5" style="cursor:pointer" onclick="selectElectrode('V2')"/>
<text x="-30" y="-47" fill="#4DB6AC" font-size="8" font-weight="700" text-anchor="end">V2</text>
<!-- V3: between V2 and V4 -->
<circle cx="-40" cy="-30" r="5" fill="#00695C" stroke="#4DB6AC" stroke-width="1.5" style="cursor:pointer" onclick="selectElectrode('V3')"/>
<text x="-50" y="-28" fill="#4DB6AC" font-size="8" font-weight="700" text-anchor="end">V3</text>
<!-- V4: MCL -->
<circle cx="-55" cy="-8" r="5" fill="#00695C" stroke="#4DB6AC" stroke-width="1.5" style="cursor:pointer" onclick="selectElectrode('V4')"/>
<text x="-65" y="-5" fill="#4DB6AC" font-size="8" font-weight="700" text-anchor="end">V4</text>
<!-- V5: anterior axillary -->
<circle cx="-58" cy="15" r="5" fill="#00695C" stroke="#4DB6AC" stroke-width="1.5" style="cursor:pointer" onclick="selectElectrode('V5')"/>
<text x="-68" y="17" fill="#4DB6AC" font-size="8" font-weight="700" text-anchor="end">V5</text>
<!-- V6: mid-axillary -->
<circle cx="-55" cy="30" r="5" fill="#00695C" stroke="#4DB6AC" stroke-width="1.5" style="cursor:pointer" onclick="selectElectrode('V6')"/>
<text x="-65" y="32" fill="#4DB6AC" font-size="8" font-weight="700" text-anchor="end">V6</text>
<!-- Lines from V electrodes to heart -->
<line x1="22" y1="-45" x2="10" y2="-8" stroke="#4DB6AC" stroke-width="0.8" stroke-dasharray="3,3" opacity="0.5"/>
<line x1="-20" y1="-45" x2="-12" y2="-5" stroke="#4DB6AC" stroke-width="0.8" stroke-dasharray="3,3" opacity="0.5"/>
<line x1="-40" y1="-30" x2="-12" y2="-5" stroke="#4DB6AC" stroke-width="0.8" stroke-dasharray="3,3" opacity="0.45"/>
<line x1="-55" y1="-8" x2="-12" y2="-5" stroke="#4DB6AC" stroke-width="0.8" stroke-dasharray="3,3" opacity="0.4"/>
<line x1="-58" y1="15" x2="-12" y2="-5" stroke="#4DB6AC" stroke-width="0.8" stroke-dasharray="3,3" opacity="0.35"/>
<line x1="-55" y1="30" x2="-12" y2="-5" stroke="#4DB6AC" stroke-width="0.8" stroke-dasharray="3,3" opacity="0.3"/>
</g>
<!-- ── ORIENTATION LABELS ── -->
<text x="410" y="55" fill="#546E7A" font-size="10" text-anchor="middle" opacity="0.8">SUPERIOR</text>
<text x="410" y="665" fill="#546E7A" font-size="10" text-anchor="middle" opacity="0.8">INFERIOR</text>
<text x="30" y="345" fill="#546E7A" font-size="10" text-anchor="middle" opacity="0.8" transform="rotate(-90,30,345)">RIGHT SIDE</text>
<text x="790" y="345" fill="#546E7A" font-size="10" text-anchor="middle" opacity="0.8" transform="rotate(90,790,345)">LEFT SIDE</text>
</svg>
</div>
<!-- ── INFO PANEL ──────────────────────────────────────────── -->
<div class="card" id="info-panel">
<div class="card-header"><span class="dot"></span>Lead Information</div>
<div id="info-content">
<div id="lead-name">Select a Lead</div>
<span id="lead-type-badge" style="background:#37474F;color:#B0BEC5">Click any electrode</span>
<div class="info-section" id="info-desc">
<h4>About This Poster</h4>
<p>Click any <span class="highlight">electrode dot</span> on the body diagram or use the <span class="highlight">lead buttons</span> below to explore each of the 12 ECG leads.</p>
<p style="margin-top:6px">Use the <strong>Vectors</strong> button to toggle lead direction arrows, and the filter badges to highlight lead groups.</p>
</div>
<div class="info-section">
<h4>Quick Reference</h4>
<div class="tag-row">
<span class="tag active">4 Limb Electrodes</span>
<span class="tag active">6 Chest Electrodes</span>
<span class="tag active">12 Lead Traces</span>
</div>
</div>
<div id="ecg-strip-wrap" style="display:none">
<canvas id="ecg-strip-canvas" width="320" height="60"></canvas>
<div class="strip-label" id="strip-label">Representative ECG waveform</div>
</div>
<div class="info-section" id="info-anatomy" style="display:none">
<h4>Anatomical Location</h4>
<p id="info-anatomy-text"></p>
</div>
<div class="info-section" id="info-vector" style="display:none">
<h4>Vector / Polarity</h4>
<p id="info-vector-text"></p>
</div>
<div class="info-section" id="info-clinical" style="display:none">
<h4>Clinical Significance</h4>
<ul id="info-clinical-list"></ul>
</div>
<div class="info-section" id="info-normal" style="display:none">
<h4>Normal Waveform</h4>
<p id="info-normal-text"></p>
</div>
</div>
</div>
<!-- ── LEADS GRID ──────────────────────────────────────────── -->
<div class="card" id="leads-panel">
<div class="card-header"><span class="dot"></span>All 12 Leads — Click to Select</div>
<div id="leads-grid">
<!-- Limb -->
<button class="lead-btn lead-limb" onclick="selectLead('I')" data-lead="I">Lead I<span class="lead-sub">0°</span></button>
<button class="lead-btn lead-limb" onclick="selectLead('II')" data-lead="II">Lead II<span class="lead-sub">60°</span></button>
<button class="lead-btn lead-limb" onclick="selectLead('III')" data-lead="III">Lead III<span class="lead-sub">120°</span></button>
<!-- Aug -->
<button class="lead-btn lead-aug" onclick="selectLead('aVR')" data-lead="aVR">aVR<span class="lead-sub">-150°</span></button>
<button class="lead-btn lead-aug" onclick="selectLead('aVL')" data-lead="aVL">aVL<span class="lead-sub">-30°</span></button>
<button class="lead-btn lead-aug" onclick="selectLead('aVF')" data-lead="aVF">aVF<span class="lead-sub">+90°</span></button>
<!-- Precordial -->
<button class="lead-btn lead-precord" onclick="selectLead('V1')" data-lead="V1">V1<span class="lead-sub">R sternal</span></button>
<button class="lead-btn lead-precord" onclick="selectLead('V2')" data-lead="V2">V2<span class="lead-sub">L sternal</span></button>
<button class="lead-btn lead-precord" onclick="selectLead('V3')" data-lead="V3">V3<span class="lead-sub">Transitional</span></button>
<button class="lead-btn lead-precord" onclick="selectLead('V4')" data-lead="V4">V4<span class="lead-sub">Apex MCL</span></button>
<button class="lead-btn lead-precord" onclick="selectLead('V5')" data-lead="V5">V5<span class="lead-sub">Ant. axillary</span></button>
<button class="lead-btn lead-precord" onclick="selectLead('V6')" data-lead="V6">V6<span class="lead-sub">Mid-axillary</span></button>
</div>
<!-- Legend -->
<div id="legend">
<div class="legend-item"><div class="legend-color" style="background:#C62828"></div> Limb leads (I, II, III)</div>
<div class="legend-item"><div class="legend-color" style="background:#E65100"></div> Augmented leads (aVR/L/F)</div>
<div class="legend-item"><div class="legend-color" style="background:#00897B"></div> Precordial leads (V1-V6)</div>
<div class="legend-item"><div class="legend-color" style="background:#546E7A;border:1px solid #78909C"></div> Ground (RL)</div>
</div>
</div>
</main>
<footer>
Interactive 12-Lead ECG Anatomy Poster | Based on standard clinical electrode placement (AHA/ISHNE guidelines)
| For educational use only
</footer>
<!-- ══════════════════════════════════════════ JAVASCRIPT -->
<script>
// ─── LEAD DATA ────────────────────────────────────────────────────────────────
const LEAD_DATA = {
'I': {
name: 'Lead I',
type: 'limb',
typeLabel: 'Bipolar Limb Lead',
typeColor: '#C62828',
angle: '0°',
anatomy: 'Measures potential difference between Left Arm (+) and Right Arm (-). Horizontal axis of the heart.',
vector: 'Directed from right to left (0°). Positive electrode on Left Arm, negative on Right Arm. Records lateral wall activity.',
clinical: [
'Lateral ST elevation / depression → Lateral MI or ischaemia',
'Deep S wave → Right ventricular hypertrophy, right axis deviation',
'S wave in I + Q wave in III + T inversion in III = S1Q3T3 (Pulmonary Embolism)',
'Monitors left ventricular lateral wall',
'Left axis deviation: predominant S in I is absent or small'
],
normal: 'Upright P wave, upright QRS with R > S, upright T wave. R wave typically 5-10mm.',
waveform: 'normal_tall'
},
'II': {
name: 'Lead II',
type: 'limb',
typeLabel: 'Bipolar Limb Lead',
typeColor: '#C62828',
angle: '60°',
anatomy: 'Left Leg (+) to Right Arm (-). Oriented at 60° — closest to the normal mean cardiac axis.',
vector: 'Directed inferiorly and to the left (60°). Parallel to mean QRS axis in most normal hearts. Best lead for rhythm assessment.',
clinical: [
'Best lead for P wave morphology and rhythm analysis',
'ST elevation in II, III, aVF → Inferior STEMI (RCA/LCx)',
'Tall peaked P waves (P pulmonale) → Right atrial enlargement / PE',
'Broad notched P waves (P mitrale) → Left atrial enlargement',
'Used as the continuous monitoring lead in most clinical settings'
],
normal: 'Tallest P wave, tallest R wave in limb leads. QRS predominantly positive. T wave upright.',
waveform: 'normal_tall'
},
'III': {
name: 'Lead III',
type: 'limb',
typeLabel: 'Bipolar Limb Lead',
typeColor: '#C62828',
angle: '120°',
anatomy: 'Left Leg (+) to Left Arm (-). Oriented at 120°, looking at the inferior wall from the right.',
vector: 'Directed at 120° (inferior-right). Part of Einthoven\'s triangle: Lead III = Lead II - Lead I.',
clinical: [
'ST elevation in III + II + aVF = Inferior STEMI',
'ST elevation in III > II suggests RCA occlusion (RV involvement)',
'Isolated Q wave in III alone can be normal (common variant)',
'Q3T3 pattern with S1 → Pulmonary embolism S1Q3T3',
'Tall R in III → Right axis deviation, RVH'
],
normal: 'Variable — can have small Q, inverted T and is less reliable alone. Context with II and aVF required.',
waveform: 'normal_small'
},
'aVR': {
name: 'aVR',
type: 'aug',
typeLabel: 'Augmented Unipolar Lead',
typeColor: '#E65100',
angle: '-150°',
anatomy: 'Augmented lead from Right Arm (+). Looks at the heart from the right shoulder — cavity/base of heart. Positive electrode on RA.',
vector: 'Directed at -150° (rightward, upward). Views the base of the heart and outflow tracts. All normal waves are inverted/negative.',
clinical: [
'ST elevation in aVR → Left main or proximal LAD occlusion (global subendocardial ischaemia)',
'ST elevation aVR > V1 → Left main disease (Sgarbossa-like)',
'Tall R wave in aVR → Ventricular tachycardia (Brugada criterion), tricyclic toxicity',
'PR elevation in aVR → Pericarditis (reciprocal to diffuse PR depression)',
'"Opposite" lead — all normal deflections are inverted vs Lead II'
],
normal: 'All waves normally inverted: negative P, mainly negative QRS (rS or QS), negative T. Any upright wave is abnormal.',
waveform: 'inverted'
},
'aVL': {
name: 'aVL',
type: 'aug',
typeLabel: 'Augmented Unipolar Lead',
typeColor: '#E65100',
angle: '-30°',
anatomy: 'Augmented lead from Left Arm (+). Looks at the lateral/high-lateral wall of the heart from the left shoulder.',
vector: 'Directed at -30°. Views the high lateral wall. Reciprocal to inferior leads (II, III, aVF).',
clinical: [
'ST elevation in I + aVL → High lateral STEMI (Circumflex or diagonal)',
'Reciprocal ST depression in aVL during inferior STEMI — confirms inferior event',
'R wave in aVL ≥11mm → LVH (Cornell criteria component)',
'Tall R in aVL → Left axis deviation',
'Monitors high lateral wall of LV'
],
normal: 'Variable morphology. May have small positive or negative P. QRS varies by axis. Important in context of inferior leads.',
waveform: 'normal_small'
},
'aVF': {
name: 'aVF',
type: 'aug',
typeLabel: 'Augmented Unipolar Lead',
typeColor: '#E65100',
angle: '+90°',
anatomy: 'Augmented lead from Left Foot (+). Looks straight down at the inferior wall of the heart (diaphragmatic surface).',
vector: 'Directed at +90° (straight down). Unipolar — measures absolute potential at left foot vs Wilson central terminal.',
clinical: [
'ST elevation in aVF + II + III → Inferior STEMI (RCA 80%, LCx 20%)',
'ST elevation aVF ≥ III → Proximal RCA occlusion with RV involvement',
'Q wave in aVF + other inferior leads → Inferior MI (old or acute)',
'Useful for axis determination: positive QRS = no left axis deviation',
'Right axis deviation: tall R in aVF with right-ward axis'
],
normal: 'Upright P wave, upright QRS (positive R wave), upright T wave. Similar to Lead II.',
waveform: 'normal_tall'
},
'V1': {
name: 'V1',
type: 'precord',
typeLabel: 'Precordial Lead',
typeColor: '#00897B',
placement: '4th intercostal space, Right sternal border',
anatomy: '4th intercostal space, immediately to the RIGHT of the sternum. Closest precordial lead to the right ventricle.',
vector: 'Anterior and rightward — faces the right ventricle, interventricular septum, and posterior wall (via R/S ratio).',
clinical: [
'rSR\' pattern (RSR\') → Right bundle branch block (RBBB)',
'QS or rS pattern → Posterior MI (tall R in V1 = posterior MI equivalent)',
'ST elevation in V1 → Anterior STEMI, RBBB with acute MI, Brugada pattern',
'Right atrial enlargement: peaked P wave in V1 >1.5mm',
'Dominant R in V1 (R>S) → Posterior MI, RVH, WPW (Type A), RBBB'
],
normal: 'Small r wave, deep S wave (rS pattern). QRS mainly negative. Transition zone V3/V4. T wave inverted or flat.',
waveform: 'v1_v2'
},
'V2': {
name: 'V2',
type: 'precord',
typeLabel: 'Precordial Lead',
typeColor: '#00897B',
placement: '4th intercostal space, Left sternal border',
anatomy: '4th intercostal space, immediately to the LEFT of the sternum. Faces the septal/anterior wall.',
vector: 'Anterior — faces the interventricular septum. Septal Q waves start here.',
clinical: [
'ST elevation V1-V2 → Anterior STEMI, Brugada pattern, RBBB',
'De Winter T waves: upsloping ST depression + tall peaked T → Proximal LAD occlusion',
'Wellens sign: deep symmetric T inversions in V1-V4 → Critical LAD stenosis',
'Posterior MI: tall R + ST depression in V2 (mirror image)',
'Left atrial enlargement: deep negative terminal P deflection in V1 >1mm × 1mm'
],
normal: 'Small r, deep S (rS). Slightly more R than V1. T wave may be inverted in women (normal variant up to V3).',
waveform: 'v1_v2'
},
'V3': {
name: 'V3',
type: 'precord',
typeLabel: 'Precordial Lead',
typeColor: '#00897B',
placement: 'Between V2 and V4 (diagonal from left sternal border to V4)',
anatomy: 'Between the 4th ICS left sternal border and the cardiac apex (5th ICS MCL). Transitional zone electrode.',
vector: 'Faces anterior LV wall and transitional zone — neither predominantly positive nor negative.',
clinical: [
'Transitional zone: R/S ratio = 1 normally at V3 or V4',
'Poor R-wave progression (PRWP): small R persisting V3/V4 → anterior scar/MI, LVH, LBBB',
'ST elevation V3-V4 → Anterior or anteroseptal STEMI (LAD)',
'Anterior ischaemia pattern with T inversions',
'Part of Wellens syndrome territory (V1-V4)'
],
normal: 'R/S ratio approaching 1 (transition zone). QRS may be isoelectric or biphasic. T wave upright.',
waveform: 'v3_v4'
},
'V4': {
name: 'V4',
type: 'precord',
typeLabel: 'Precordial Lead',
typeColor: '#00897B',
placement: '5th intercostal space, Mid-clavicular line (cardiac apex)',
anatomy: '5th intercostal space at the mid-clavicular line — directly over the cardiac apex. Key anatomical landmark.',
vector: 'Faces the cardiac apex and anterior LV wall. Largest R wave territory begins here.',
clinical: [
'R wave becomes dominant here (R>S = transition zone for most patients)',
'ST elevation V3-V5 → Anterior/apical STEMI',
'Apical HCM: giant T inversions in V3-V6 (Yamaguchi syndrome)',
'Used as reference for V5 and V6 height placement',
'Important for Q-wave assessment (apical MI)'
],
normal: 'R wave > S wave (positive QRS). Tall R wave begins. T wave upright. Represents cardiac apex.',
waveform: 'v3_v4'
},
'V5': {
name: 'V5',
type: 'precord',
typeLabel: 'Precordial Lead',
typeColor: '#00897B',
placement: 'Anterior axillary line, same horizontal level as V4',
anatomy: 'Anterior axillary line at same level as V4 (5th ICS). Faces lateral LV wall.',
vector: 'Faces the lateral wall of the LV. Part of the lateral lead group with I, aVL, V6.',
clinical: [
'LVH: R in V5 or V6 + S in V1 ≥35mm (Sokolow-Lyon criterion)',
'ST elevation V4-V6 → Lateral extension of anterior STEMI',
'ST elevation I + aVL + V5-V6 → Pure lateral STEMI (circumflex)',
'Lateral strain pattern: ST depression + T inversion in V5-V6 with LVH',
'Used for exercise stress testing monitoring (alongside V4)'
],
normal: 'Tall R wave (often tallest). T wave upright. R > S (positive QRS). Small q wave can be normal.',
waveform: 'v5_v6'
},
'V6': {
name: 'V6',
type: 'precord',
typeLabel: 'Precordial Lead',
typeColor: '#00897B',
placement: 'Mid-axillary line, same horizontal level as V4',
anatomy: 'Mid-axillary line at same level as V4-V5. Most lateral precordial electrode. Faces lateral/basal LV.',
vector: 'Most lateral precordial view. Similar to Lead I — both face the lateral LV wall.',
clinical: [
'LBBB: broad notched R wave in V5-V6 (with no preceding Q wave)',
'Lateral STEMI territory: V5-V6 with I and aVL',
'LVH: Sokolow-Lyon criterion includes RV5 or RV6',
'Lateral strain: ST depression + asymmetric T inversion',
'WPW: positive delta wave in V5-V6 suggests posterior/left accessory pathway'
],
normal: 'Tall R wave, small S, upright T wave. Small septal q wave (1-2mm) can be physiological. Similar to V5.',
waveform: 'v5_v6'
},
'RA': {
name: 'Right Arm (RA)',
type: 'electrode',
typeLabel: 'Limb Electrode',
typeColor: '#C62828',
anatomy: 'Placed on the right wrist or right forearm (distal). Color: RED (UK: Red). Standard AHA color code: White in US.',
vector: 'Negative terminal for Lead I. Negative terminal for Lead II. Component of augmented lead aVR (positive terminal).',
clinical: [
'Forms negative pole of Lead I (RA- → LA+)',
'Forms negative pole of Lead II (RA- → LL+)',
'Positive terminal of augmented lead aVR',
'One of three vertices of Einthoven\'s triangle',
'Electrode artifact: poor contact → noisy baseline in I, II, aVR simultaneously'
],
normal: 'Electrode placement: proximal to wrist on inner forearm. Bony landmarks used in amputees (shoulder).',
waveform: null
},
'LA': {
name: 'Left Arm (LA)',
type: 'electrode',
typeLabel: 'Limb Electrode',
typeColor: '#E65100',
anatomy: 'Placed on the left wrist or left forearm (distal). Color: YELLOW (UK). US color code: Black.',
vector: 'Positive terminal for Lead I. Component of Lead III (negative). Positive terminal of augmented lead aVL.',
clinical: [
'Forms positive pole of Lead I (RA- → LA+)',
'Forms negative pole of Lead III (LA- → LL+)',
'Positive terminal of augmented lead aVL',
'One of three vertices of Einthoven\'s triangle',
'Electrode reversal with RA → all limb leads mirror-flipped (Lead I inverted)'
],
normal: 'Placed on inner left forearm proximal to wrist. Must be same level as RA electrode for symmetry.',
waveform: null
},
'LL': {
name: 'Left Leg (LL)',
type: 'electrode',
typeLabel: 'Limb Electrode',
typeColor: '#2E7D32',
anatomy: 'Placed on left ankle or lower left leg. Color: GREEN (UK). US color code: Red.',
vector: 'Positive terminal for both Lead II and Lead III. Positive terminal of augmented lead aVF.',
clinical: [
'Forms positive pole of Lead II (RA- → LL+)',
'Forms positive pole of Lead III (LA- → LL+)',
'Positive terminal of augmented lead aVF',
'Third vertex of Einthoven\'s triangle',
'Artifact: poor LL contact → noisy II, III, aVF simultaneously'
],
normal: 'Lower leg, medial aspect. Can be placed at any level on the leg in practice.',
waveform: null
},
'RL': {
name: 'Right Leg (RL) — Ground',
type: 'electrode',
typeLabel: 'Ground Electrode',
typeColor: '#546E7A',
anatomy: 'Placed on right ankle or lower right leg. Color: BLACK (UK). US color code: Green. Purely a ground/reference.',
vector: 'NOT part of any lead vector. Pure electrical ground. Reduces common-mode noise (60 Hz interference).',
clinical: [
'Does NOT contribute to any of the 12 lead traces',
'Acts as electrical ground to eliminate baseline artifact',
'Poor contact → common-mode noise/AC hum in ALL leads',
'Wilson central terminal uses RA + LA + LL (not RL)',
'Some modern ECG machines use driven right leg circuit for noise reduction'
],
normal: 'Ground only. No waveform contribution. Can be placed anywhere on the right side of the body.',
waveform: null
}
};
// ─── ELECTRODE → LEADS MAP ───────────────────────────────────────────────────
const ELEC_TO_LEAD = {
'RA': 'I', 'LA': 'I', 'LL': 'II', 'RL': null,
'V1': 'V1', 'V2': 'V2', 'V3': 'V3', 'V4': 'V4', 'V5': 'V5', 'V6': 'V6'
};
// ─── STATE ────────────────────────────────────────────────────────────────────
let currentLead = null;
let vectorsVisible = false;
// ─── SELECT LEAD ──────────────────────────────────────────────────────────────
function selectLead(leadKey) {
currentLead = leadKey;
const d = LEAD_DATA[leadKey];
if (!d) return;
// Update buttons
document.querySelectorAll('.lead-btn').forEach(b => {
b.classList.toggle('active', b.dataset.lead === leadKey);
});
// Update info panel
document.getElementById('lead-name').textContent = d.name;
const badge = document.getElementById('lead-type-badge');
badge.textContent = d.typeLabel;
badge.style.background = d.typeColor + '33';
badge.style.color = d.typeColor;
badge.style.border = `1px solid ${d.typeColor}66`;
const show = (id, txt) => {
const el = document.getElementById(id);
if (el) { el.style.display = 'block'; }
if (txt !== undefined) {
const p = document.getElementById(id + '-text') || document.getElementById(id + '-list');
if (p) {
if (typeof txt === 'string') p.innerHTML = txt;
}
}
};
document.getElementById('info-desc').style.display = 'none';
show('info-anatomy', d.anatomy.replace(/\n/g,'<br>'));
document.getElementById('info-anatomy-text').textContent = d.anatomy;
show('info-vector');
document.getElementById('info-vector-text').textContent = d.vector;
show('info-clinical');
const ul = document.getElementById('info-clinical-list');
ul.innerHTML = '';
(d.clinical || []).forEach(item => {
const li = document.createElement('li');
li.textContent = item;
ul.appendChild(li);
});
show('info-normal');
document.getElementById('info-normal-text').textContent = d.normal;
// Draw ECG strip
if (d.waveform) {
document.getElementById('ecg-strip-wrap').style.display = 'block';
document.getElementById('strip-label').textContent = `Representative ${d.name} waveform`;
drawECGStrip(d.waveform, d.typeColor);
} else {
document.getElementById('ecg-strip-wrap').style.display = 'none';
}
}
function selectElectrode(elecKey) {
const d = LEAD_DATA[elecKey];
if (!d) return;
document.querySelectorAll('.lead-btn').forEach(b => b.classList.remove('active'));
document.getElementById('lead-name').textContent = d.name;
const badge = document.getElementById('lead-type-badge');
badge.textContent = d.typeLabel;
badge.style.background = d.typeColor + '33';
badge.style.color = d.typeColor;
badge.style.border = `1px solid ${d.typeColor}66`;
document.getElementById('info-desc').style.display = 'none';
document.getElementById('info-anatomy').style.display = 'block';
document.getElementById('info-anatomy-text').textContent = d.anatomy;
document.getElementById('info-vector').style.display = 'block';
document.getElementById('info-vector-text').textContent = d.vector;
document.getElementById('info-clinical').style.display = 'block';
const ul = document.getElementById('info-clinical-list');
ul.innerHTML = '';
(d.clinical || []).forEach(item => {
const li = document.createElement('li'); li.textContent = item; ul.appendChild(li);
});
document.getElementById('info-normal').style.display = 'block';
document.getElementById('info-normal-text').textContent = d.normal;
if (d.waveform) {
document.getElementById('ecg-strip-wrap').style.display = 'block';
document.getElementById('strip-label').textContent = `Representative ECG strip`;
drawECGStrip(d.waveform, d.typeColor);
} else {
document.getElementById('ecg-strip-wrap').style.display = 'none';
}
// If it's a precordial electrode, also highlight the corresponding lead button
if (['V1','V2','V3','V4','V5','V6'].includes(elecKey)) {
const btn = document.querySelector(`.lead-btn[data-lead="${elecKey}"]`);
if (btn) btn.classList.add('active');
}
}
// ─── FILTER LEADS ─────────────────────────────────────────────────────────────
function filterLeads(type) {
document.querySelectorAll('.lead-btn').forEach(btn => {
if (type === 'all') {
btn.style.opacity = '1';
} else if (type === 'limb') {
btn.style.opacity = btn.classList.contains('lead-limb') ? '1' : '0.3';
} else if (type === 'aug') {
btn.style.opacity = btn.classList.contains('lead-aug') ? '1' : '0.3';
} else if (type === 'precord') {
btn.style.opacity = btn.classList.contains('lead-precord') ? '1' : '0.3';
}
});
}
function toggleVectors() {
vectorsVisible = !vectorsVisible;
const vg = document.getElementById('vectors-group');
vg.style.opacity = vectorsVisible ? '1' : '0';
}
function resetAll() {
filterLeads('all');
document.querySelectorAll('.lead-btn').forEach(b => b.classList.remove('active'));
currentLead = null;
document.getElementById('lead-name').textContent = 'Select a Lead';
const badge = document.getElementById('lead-type-badge');
badge.textContent = 'Click any electrode';
badge.style.background = '#37474F';
badge.style.color = '#B0BEC5';
badge.style.border = '';
document.getElementById('info-desc').style.display = 'block';
document.getElementById('info-anatomy').style.display = 'none';
document.getElementById('info-vector').style.display = 'none';
document.getElementById('info-clinical').style.display = 'none';
document.getElementById('info-normal').style.display = 'none';
document.getElementById('ecg-strip-wrap').style.display = 'none';
if (vectorsVisible) toggleVectors();
}
// ─── ECG WAVEFORM DRAWING ─────────────────────────────────────────────────────
function drawECGStrip(type, traceColor) {
const canvas = document.getElementById('ecg-strip-canvas');
const ctx = canvas.getContext('2d');
const W = canvas.width, H = canvas.height;
// Grid
ctx.fillStyle = '#1a0a0a';
ctx.fillRect(0, 0, W, H);
ctx.strokeStyle = 'rgba(200,50,50,0.25)';
ctx.lineWidth = 0.5;
for (let x = 0; x < W; x += 10) { ctx.beginPath(); ctx.moveTo(x,0); ctx.lineTo(x,H); ctx.stroke(); }
for (let y = 0; y < H; y += 10) { ctx.beginPath(); ctx.moveTo(0,y); ctx.lineTo(W,y); ctx.stroke(); }
// Thicker every 50px
ctx.strokeStyle = 'rgba(200,50,50,0.5)';
ctx.lineWidth = 0.8;
for (let x = 0; x < W; x += 50) { ctx.beginPath(); ctx.moveTo(x,0); ctx.lineTo(x,H); ctx.stroke(); }
for (let y = 0; y < H; y += 30) { ctx.beginPath(); ctx.moveTo(0,y); ctx.lineTo(W,y); ctx.stroke(); }
// Baseline
const baseline = H * 0.6;
ctx.strokeStyle = traceColor || '#4DB6AC';
ctx.lineWidth = 2;
ctx.lineJoin = 'round';
ctx.lineCap = 'round';
function gauss(x, mu, sigma, amp) {
return amp * Math.exp(-0.5 * Math.pow((x-mu)/sigma, 2));
}
function drawBeat(startX, beatW, options) {
const {rAmp=1, stElev=0, stDep=0, tInv=false, tAmp=0.5, prDep=0,
widePR=false, deltaWave=false, narrowQ=false, wideQRS=false, noP=false} = options || {};
const scaleY = H * 0.35;
const points = [];
const N = 200;
for (let i = 0; i < N; i++) {
const t = i / N; // 0..1
let x = startX + t * beatW;
let y = baseline;
// Isoelectric with PR depression
if (t < 0.08 || (t > 0.27 && t < 0.35)) {
y += prDep * scaleY * 0.4;
}
// P wave
if (!noP) {
const pCenter = widePR ? 0.06 : 0.07;
y -= gauss(t, pCenter, 0.022, 0.4) * scaleY;
}
// Delta wave
if (deltaWave && t > 0.12 && t < 0.22) {
y -= ((t - 0.12) / 0.10) * 0.55 * scaleY;
}
// QRS
const qrsC = widePR ? 0.36 : 0.25;
y -= gauss(t, qrsC - 0.018, 0.01, wideQRS ? 0.22 : 0.18) * scaleY; // Q
y -= gauss(t, qrsC, wideQRS ? 0.022 : 0.016, rAmp) * scaleY; // R
if (wideQRS) {
y -= gauss(t, qrsC + 0.04, 0.016, rAmp * 0.5) * scaleY; // R' notch for LBBB
}
y -= gauss(t, qrsC + (wideQRS?0.06:0.02), wideQRS?0.02:0.012, -(wideQRS?0.6:0.35)) * scaleY; // S
// ST elevation / depression
const stC = widePR ? 0.55 : 0.42;
if (stElev > 0) y -= gauss(t, stC + 0.03, 0.05, stElev * 0.9) * scaleY;
if (stDep > 0) y += gauss(t, stC + 0.02, 0.045, stDep * 0.9) * scaleY;
// T wave
const tC = widePR ? 0.68 : 0.56;
const tW = wideQRS ? 0.08 : 0.065;
if (tInv)
y += gauss(t, tC, tW, tAmp * 0.7) * scaleY;
else
y -= gauss(t, tC, tW, tAmp) * scaleY;
points.push([x, y]);
}
ctx.beginPath();
ctx.moveTo(points[0][0], points[0][1]);
for (let i = 1; i < points.length; i++) ctx.lineTo(points[i][0], points[i][1]);
ctx.stroke();
}
const beatW = W / 3.5;
const beats = 3;
const startX = 10;
const opts = {};
if (type === 'normal_tall') {
for (let b = 0; b < beats; b++) drawBeat(startX + b*beatW, beatW, {rAmp:1.0, tAmp:0.5});
} else if (type === 'normal_small') {
for (let b = 0; b < beats; b++) drawBeat(startX + b*beatW, beatW, {rAmp:0.6, tAmp:0.35});
} else if (type === 'inverted') {
// aVR - all inverted
ctx.save();
ctx.translate(0, H);
ctx.scale(1, -1);
for (let b = 0; b < beats; b++) drawBeat(startX + b*beatW, beatW, {rAmp:0.7, tAmp:0.4});
ctx.restore();
} else if (type === 'v1_v2') {
// rS pattern
for (let b = 0; b < beats; b++) drawBeat(startX + b*beatW, beatW, {rAmp:-0.7, tAmp:-0.2, tInv:true});
// Correct: draw rS manually
ctx.clearRect(0, 0, W, H);
ctx.fillStyle = '#1a0a0a'; ctx.fillRect(0,0,W,H);
ctx.strokeStyle = 'rgba(200,50,50,0.25)'; ctx.lineWidth = 0.5;
for (let x = 0; x < W; x += 10) { ctx.beginPath(); ctx.moveTo(x,0); ctx.lineTo(x,H); ctx.stroke(); }
for (let y = 0; y < H; y += 10) { ctx.beginPath(); ctx.moveTo(0,y); ctx.lineTo(W,y); ctx.stroke(); }
ctx.strokeStyle = traceColor || '#4DB6AC'; ctx.lineWidth = 2;
for (let b = 0; b < beats; b++) {
const sx = startX + b * beatW;
// Draw V1-like: small r, deep S
drawBeat(sx, beatW, {rAmp: 0.28, tAmp:0.2, tInv: true});
}
} else if (type === 'v3_v4') {
for (let b = 0; b < beats; b++) drawBeat(startX + b*beatW, beatW, {rAmp:0.75, tAmp:0.45});
} else if (type === 'v5_v6') {
for (let b = 0; b < beats; b++) drawBeat(startX + b*beatW, beatW, {rAmp:1.1, tAmp:0.55});
}
}
// ─── TOOLTIP ──────────────────────────────────────────────────────────────────
const tooltip = document.getElementById('tooltip');
const tooltipData = {
'elec-RA': {title:'Right Arm (RA)', body:'RED electrode. Negative terminal for leads I & II. Positive for aVR.'},
'elec-LA': {title:'Left Arm (LA)', body:'YELLOW electrode. Positive for lead I. Negative for lead III. Positive for aVL.'},
'elec-LL': {title:'Left Leg (LL)', body:'GREEN electrode. Positive for leads II & III. Positive for aVF.'},
'elec-RL': {title:'Right Leg (RL)', body:'BLACK/Ground electrode. Not part of any lead vector. Reduces noise.'},
'elec-V1': {title:'V1', body:'4th ICS, right sternal border. Faces RV. Normally rS pattern.'},
'elec-V2': {title:'V2', body:'4th ICS, left sternal border. Septal view. rS or RS pattern.'},
'elec-V3': {title:'V3', body:'Between V2 and V4. Transitional zone. R/S ≈ 1.'},
'elec-V4': {title:'V4', body:'5th ICS, mid-clavicular line (cardiac apex). R > S.'},
'elec-V5': {title:'V5', body:'Anterior axillary line, level of V4. Lateral LV wall.'},
'elec-V6': {title:'V6', body:'Mid-axillary line, level of V4. Lateral LV wall. Similar to V5.'},
};
document.querySelectorAll('.electrode').forEach(el => {
const id = el.id;
el.addEventListener('mouseenter', (e) => {
const d = tooltipData[id];
if (!d) return;
document.getElementById('tt-title').textContent = d.title;
document.getElementById('tt-body').textContent = d.body;
tooltip.classList.add('show');
});
el.addEventListener('mousemove', (e) => {
tooltip.style.left = (e.clientX + 14) + 'px';
tooltip.style.top = (e.clientY - 10) + 'px';
});
el.addEventListener('mouseleave', () => tooltip.classList.remove('show'));
});
// ─── DEFAULT SELECTION ────────────────────────────────────────────────────────
// Auto-select Lead II on load to demonstrate
setTimeout(() => selectLead('II'), 400);
</script>
</body>
</html>
# Verify the HTML file is valid and check for any obvious issues node -e " const fs = require('fs'); const html = fs.readFileSync('/home/daytona/workspace/ecg-poster/ECG_Lead_Anatomy_Poster.html','utf8'); console.log('File size:', (html.length/1024).toFixed(1), 'KB'); console.log('Has DOCTYPE:', html.includes('<!DOCTYPE')); console.log('Has SVG:', html.includes('<svg')); console.log('Has Canvas:', html.includes('<canvas')); console.log('Has LEAD_DATA:', html.includes('LEAD_DATA')); console.log('Lead entries:', (html.match(/'[IV][0-9a-zA-Z]+'\s*:/g)||[]).length); console.log('Interactive functions:', (html.match(/function /g)||[]).length); console.log('Electrode groups:', (html.match(/id=\"elec-/g)||[]).length); console.log('Script syntax check...'); // Extract and check script const scriptMatch = html.match(/<script>([\s\S]+)<\/script>/); if(scriptMatch) { try { new Function(scriptMatch[1]); console.log('JS syntax: OK'); } catch(e) { console.log('JS syntax error:', e.message); } } "
ECG Lead Anatomy Poster
HTML File · HTML
What's interactive in the poster
- Full body silhouette with torso, limbs, head, and rib cage hints
- Animated heart icon in anatomical position
- 10 clickable pulsing electrode dots (RA, LA, RL, LL in color-coded positions + V1-V6 on chest)
- Hover tooltips on every electrode showing placement and polarity
- ECG machine boxes on both sides with mini trace animations
- Lead wires as color-coded dashed lines (red=RA, yellow=LA, green=LL, black=RL)
- Limb Leads - highlights I, II, III buttons
- Augmented - highlights aVR, aVL, aVF
- Precordial - highlights V1-V6
- Vectors - toggles animated directional arrows showing Einthoven triangle (I/II/III + aVR/L/F) and precordial horizontal vectors
- Reset - clears all selections
- Updates dynamically on click with: anatomy location, lead vector/angle, clinical significance list, normal waveform description
- Live ECG mini-strip drawn on Canvas with realistic waveforms per lead type (rS pattern for V1/V2, transitional for V3/V4, tall R for V5/V6, inverted for aVR)
- Hexaxial system (bottom-left): color-coded reference wheel with I/II/III/aVR/aVL/aVF axes at their correct angles, normal axis arrow, quadrant labels (Normal/LAD/RAD/Extreme)
- Precordial cross-section (bottom-right): horizontal plane thorax view showing V1-V6 electrode positions relative to RV, LV, and spine