
Most common ecg changes.along with images
Reading File
Now let me search the medical library for ECG changes content and images in parallel.
Finding Sources
Finding Sources
Finding Sources
Finding Sources
Reading File
Finding Sources
Reading File
Reading File
Good, found an image. Now let me search for ECG images and more comprehensive ECG pattern content from Harrison's and Braunwald's.
Finding Sources
Finding Sources
Finding Sources
Reading File
Excellent! Found key ECG images and content in Harrison's. Let me read more of this block to gather the comprehensive ECG changes section, and fetch the images in parallel.
Reading File
Loading Image
Loading Image
Loading Image
Reading File
Excellent content! Let me fetch more key ECG images from Harrison's in parallel.
Loading Image
Loading Image
Reading File
Loading Image
Reading File
Loading Image
Reading File
Loading Image
Loading Image
I now have all the key images and content needed for a comprehensive answer. Let me compile everything.
Most Common ECG Changes
A systematic approach to ECG interpretation requires analyzing rhythm, rate, PR/QRS/QT intervals, P waves, QRS axis & voltage, R-wave progression, Q waves, ST segments, T waves, and U waves. Below are the major ECG abnormalities with images from authoritative textbooks.
1. Normal ECG - Reference
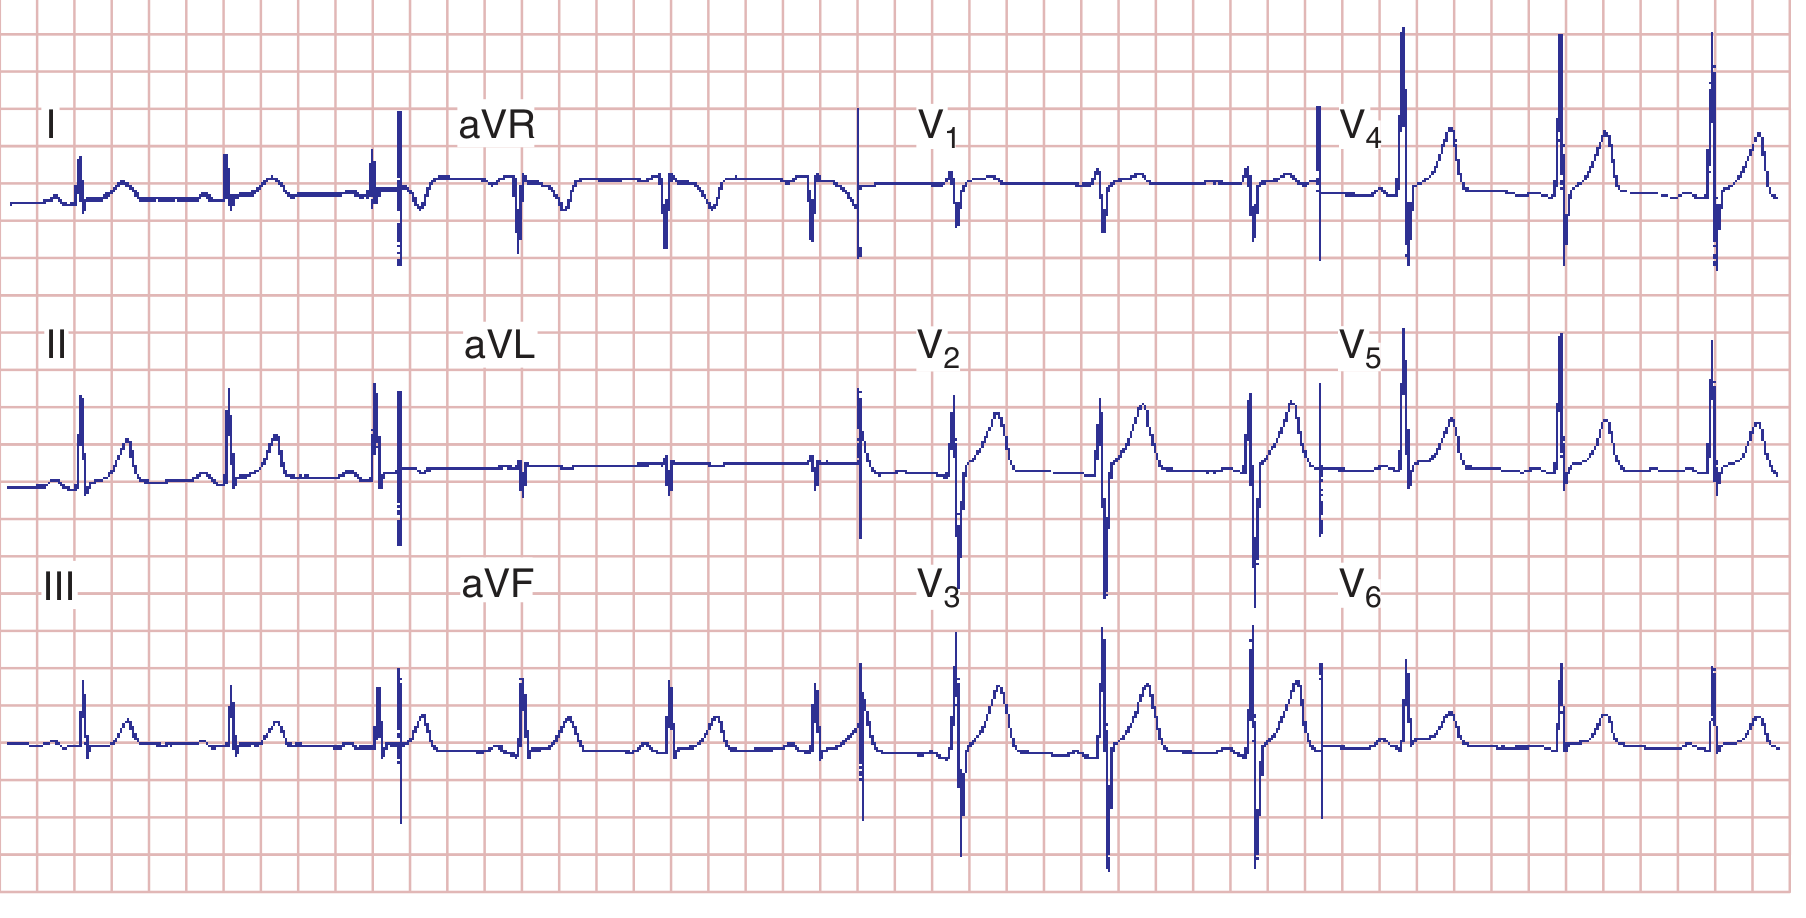
Normal 12-lead ECG showing sinus rhythm at 75 bpm with normal R-wave progression (transition zone at V3/V4).
(Harrison's Principles of Internal Medicine, 22E - Fig. 247-7)
2. P Wave Changes - Atrial Abnormalities
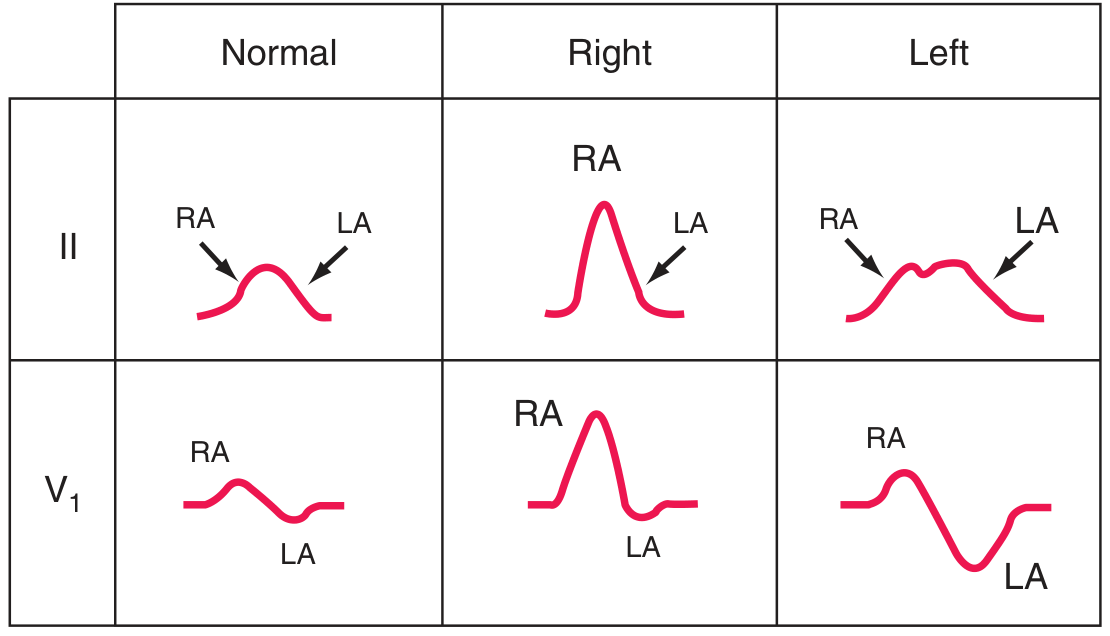
Normal P wave vs. Right atrial overload ("P-pulmonale": peaked P ≥2.5 mm) vs. Left atrial abnormality ("P-mitrale": broad, notched P ≥120 ms in limb leads, biphasic with deep negative component in V1).
(Harrison's Principles of Internal Medicine, 22E - Fig. 247-8)
| Change | Appearance | Cause |
|---|---|---|
| Right atrial overload | Tall, peaked P wave ≥2.5 mm (lead II) | Pulmonary hypertension, COPD, tricuspid stenosis |
| Left atrial abnormality | Broad (≥120 ms), notched P in limb leads; biphasic P in V1 | Mitral valve disease, hypertension, LVH |
| Absent P waves | Irregular baseline (fibrillation) or absent (junctional rhythm) | Atrial fibrillation, junctional rhythm |
3. PR Interval Changes
| Change | Normal = 120-200 ms | Cause |
|---|---|---|
| Short PR (<120 ms) | Delta wave present | WPW syndrome (accessory pathway) |
| Short PR, no delta wave | - | LGL syndrome, junctional rhythm |
| Prolonged PR (>200 ms) | 1st degree AV block | Digoxin, inferior MI, vagal tone |
| Progressive PR lengthening until dropped beat | 2nd degree Mobitz I (Wenckebach) | AV nodal disease |
| Fixed PR with dropped beats | 2nd degree Mobitz II | Bundle branch / His-Purkinje disease |
| No P-QRS relationship | 3rd degree (complete) AV block | Severe AV nodal or infranodal disease |
4. QRS Changes - Axis, Voltage & Hypertrophy
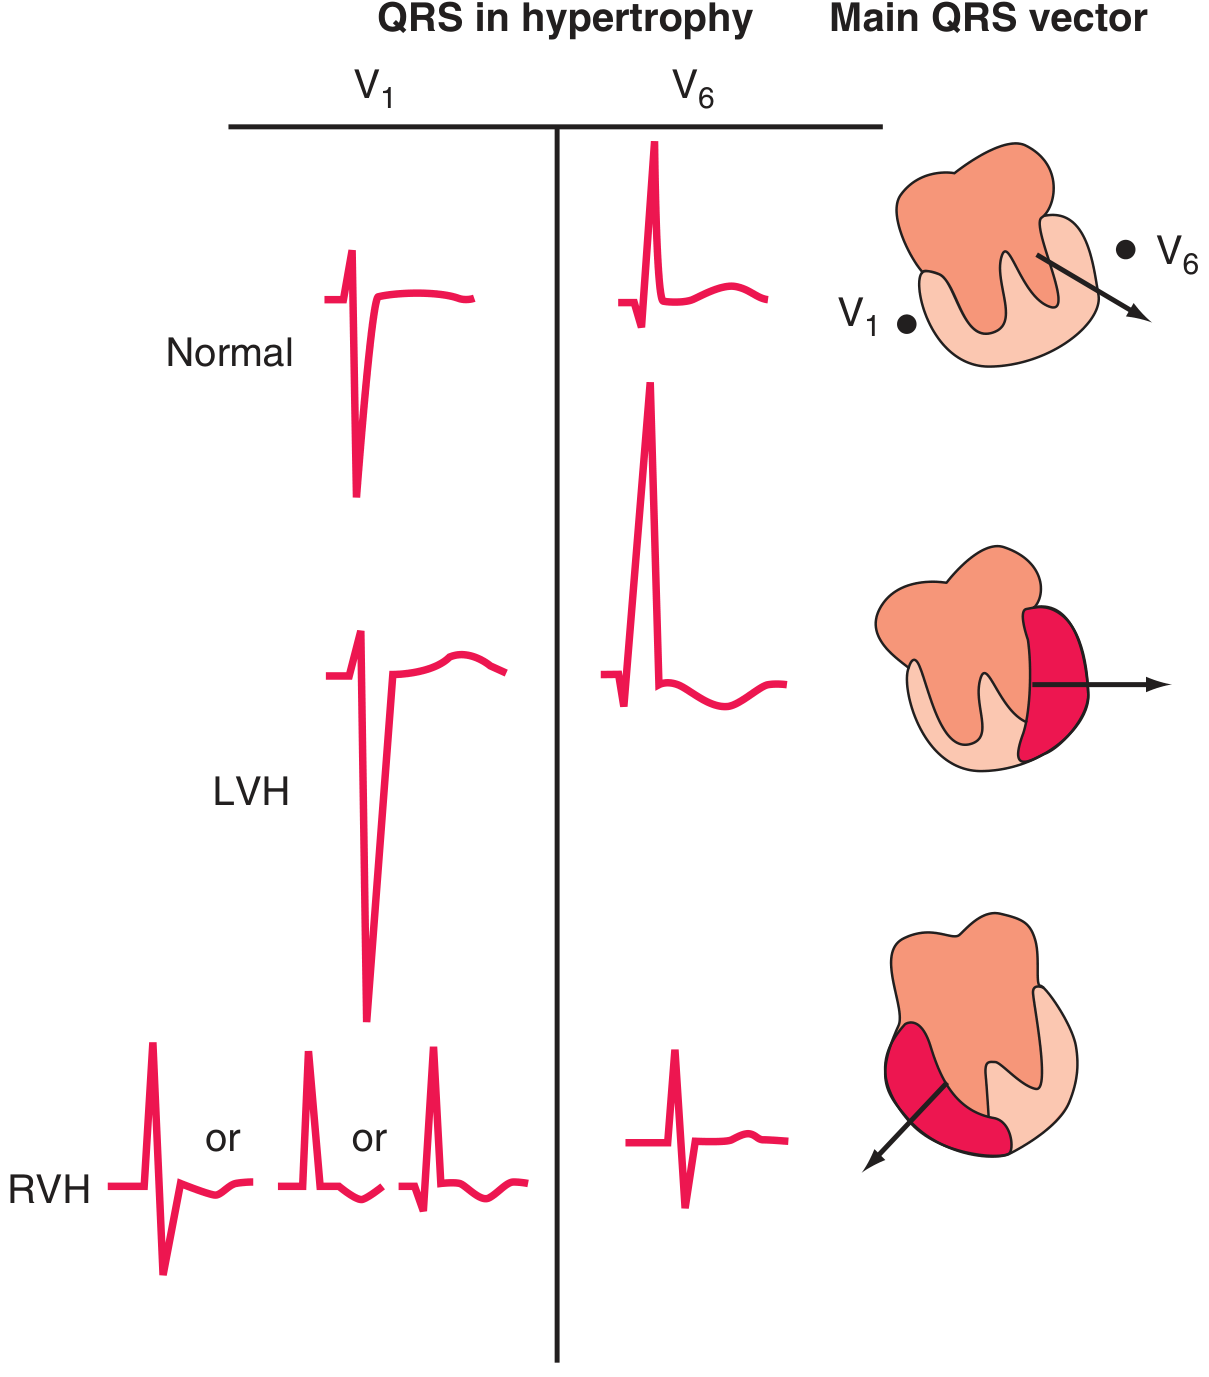
QRS in hypertrophy. LVH: tall precordial voltages (SV1 + RV5 or RV6 >35 mm), ST depression and T-wave inversion in lateral leads ("strain" pattern). RVH: tall R in V1, right axis deviation, ST-T changes in right precordial leads.
(Harrison's Principles of Internal Medicine, 22E - Fig. 247-9)
Key voltage criteria:
- LVH: SV1 + RV5 or RV6 >35 mm; RaVL >20 mm (women) or >28 mm (men)
- RVH: R ≥ S wave in V1 with right axis deviation; qR pattern in V1
- Low voltage: QRS <5 mm in all limb leads - think pericardial effusion, emphysema, infiltrative disease
5. Bundle Branch Blocks
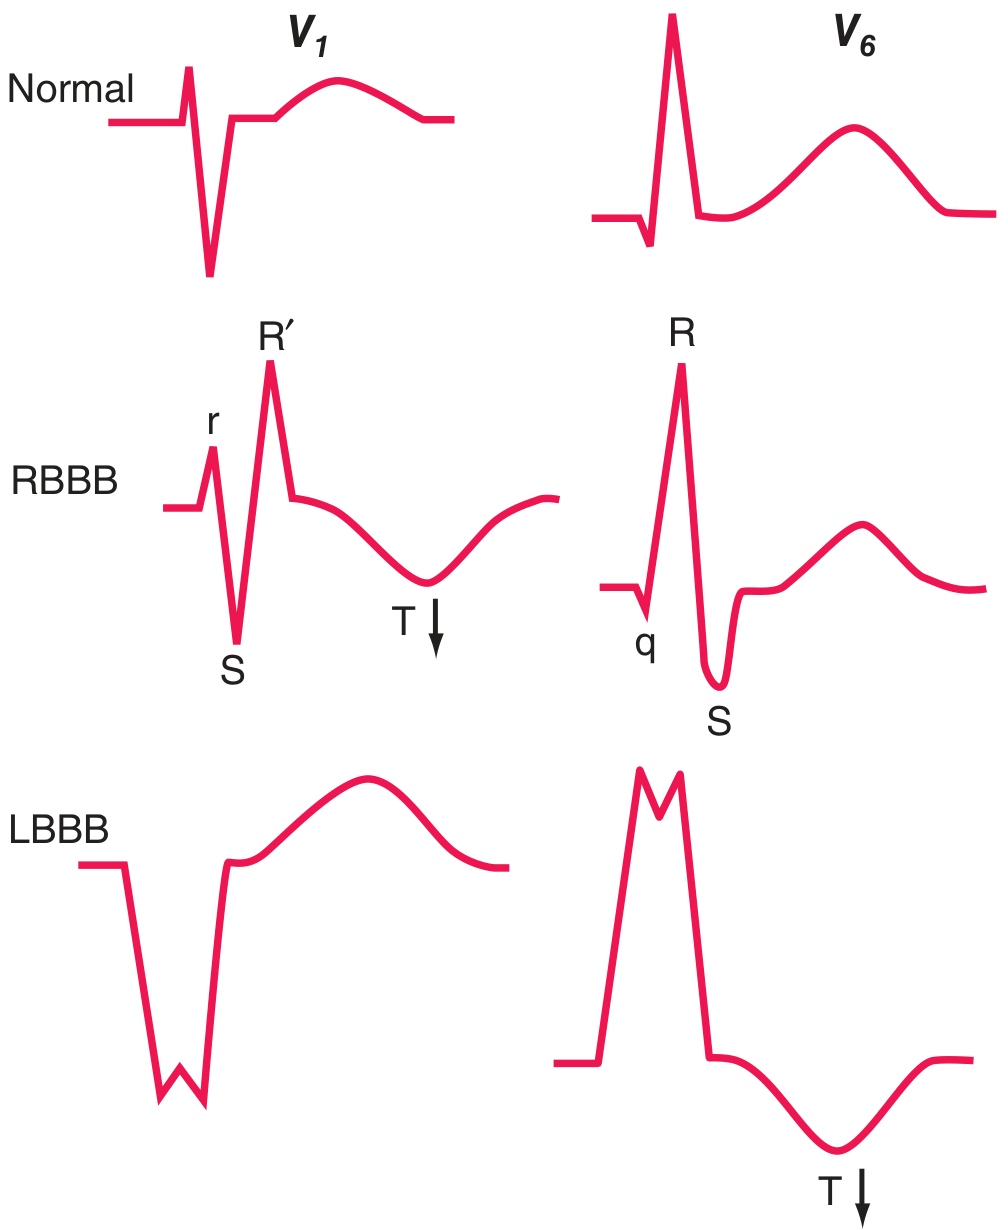
RBBB vs. LBBB in leads V1 and V5/V6. Arrows show secondary T-wave inversions - discordant (opposite to last QRS deflection), which is expected. Concordant T-wave changes suggest primary ischemia superimposed on bundle branch block.
(Harrison's Principles of Internal Medicine, 22E - Fig. 247-10)
| Block | QRS Width | V1 Pattern | V5/V6 Pattern | T wave |
|---|---|---|---|---|
| RBBB | ≥120 ms | rSR' ("rabbit ears") | qRS (deep S) | Inverted in V1-V2 (secondary) |
| LBBB | ≥120 ms | Wide QS (entirely negative) | Broad, monophasic R | Inverted in V5-V6 (secondary) |
| RBBB + LAD | ≥120 ms | rSR' | - | Bifascicular block (right bundle + left anterior fascicle) |
6. ST Segment Changes - Ischemia and Infarction
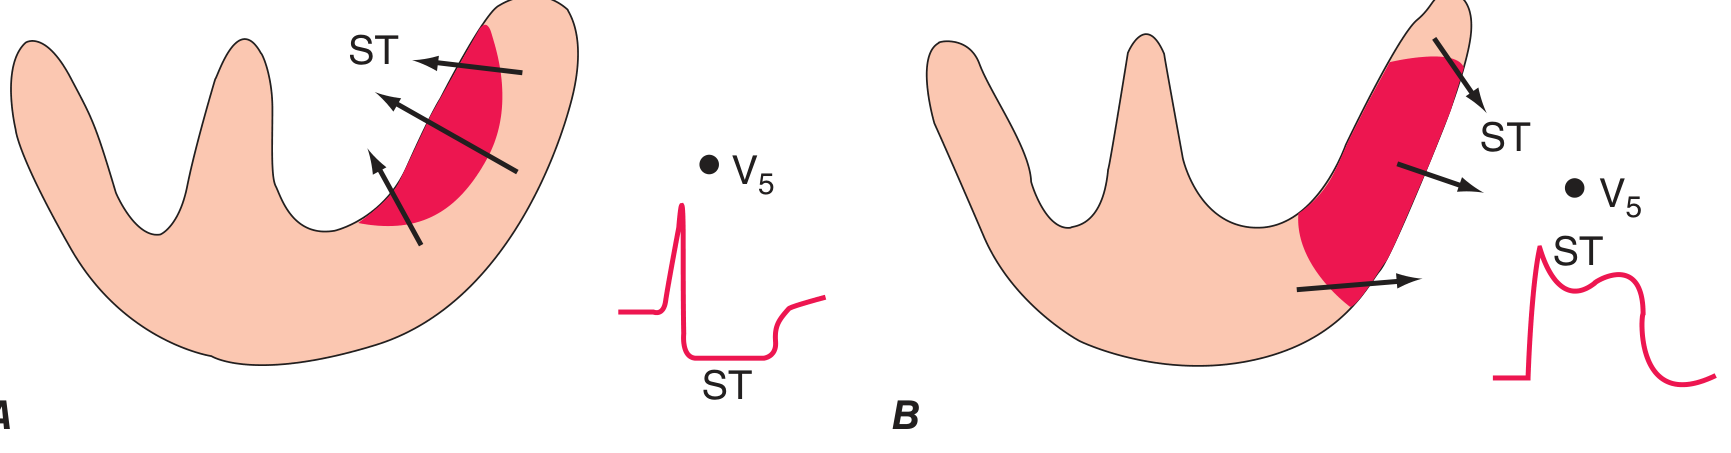
Current-of-injury concept. A: Subendocardial ischemia causes ST depression in overlying leads (and ST elevation in aVR). B: Transmural (epicardial) ischemia causes ST elevation.
(Harrison's Principles of Internal Medicine, 22E - Fig. 247-11)
ST Elevation Causes (Tintinalli's differential):
- Acute STEMI (most important - urgent reperfusion)
- Pericarditis (diffuse, saddle-shaped; accompanied by PR depression)
- Early repolarization (common benign variant, concave up)
- LVH strain pattern
- LBBB / ventricular paced rhythm (discordant ST)
- Brugada pattern (coved-type in V1-V2)
- Takotsubo cardiomyopathy
- Hypertrophic cardiomyopathy
- Hypercalcemia / hyperkalemia (right precordial)
- Hypothermia (with J/Osborn waves)
ST Depression Causes:
- NSTEMI / subendocardial ischemia
- Reciprocal changes in STEMI
- Digoxin effect (classically "reverse tick" or "hockey stick")
- Hypokalemia (with prominent U waves)
- Right ventricular strain / cor pulmonale
- LVH strain
7. Anterior Wall Ischemia - T Wave Inversions (Wellens' Pattern)
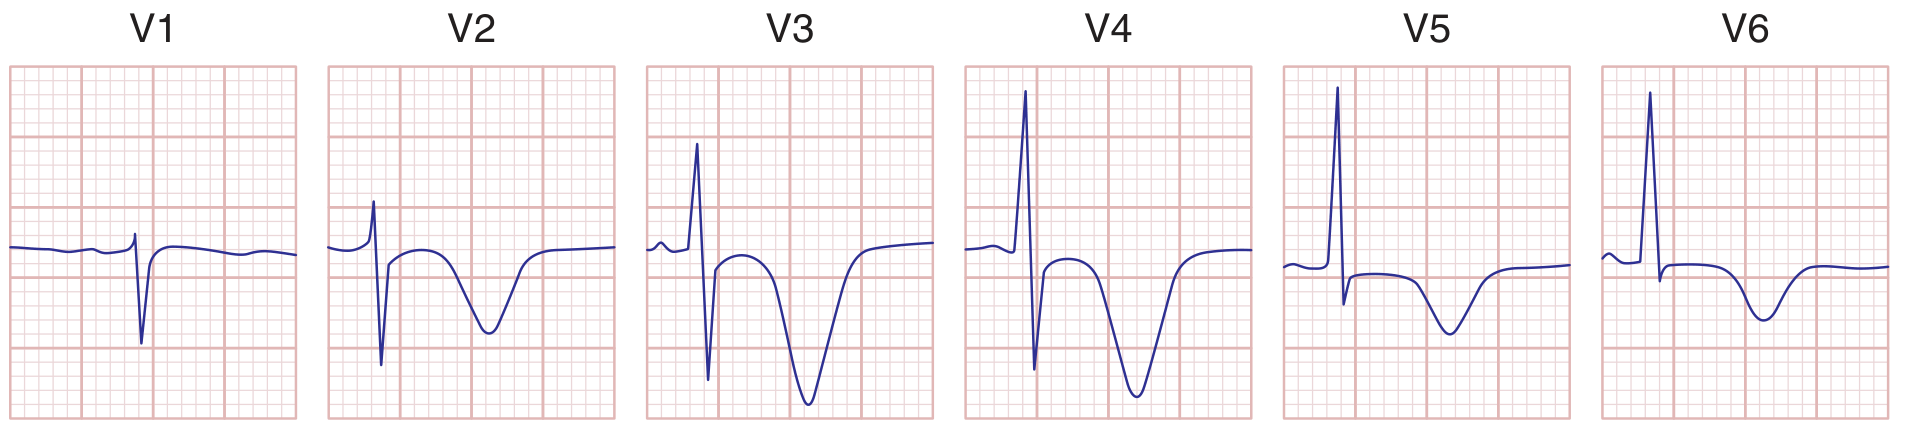
Severe anterior wall ischemia showing deep, symmetric T-wave inversions across V1-V6 (Wellens' syndrome - critical LAD stenosis). Present in ~15% of unstable angina patients.
(Harrison's Principles of Internal Medicine, 22E - Fig. 247-12)
8. Evolving MI - Q Waves and ST Sequence
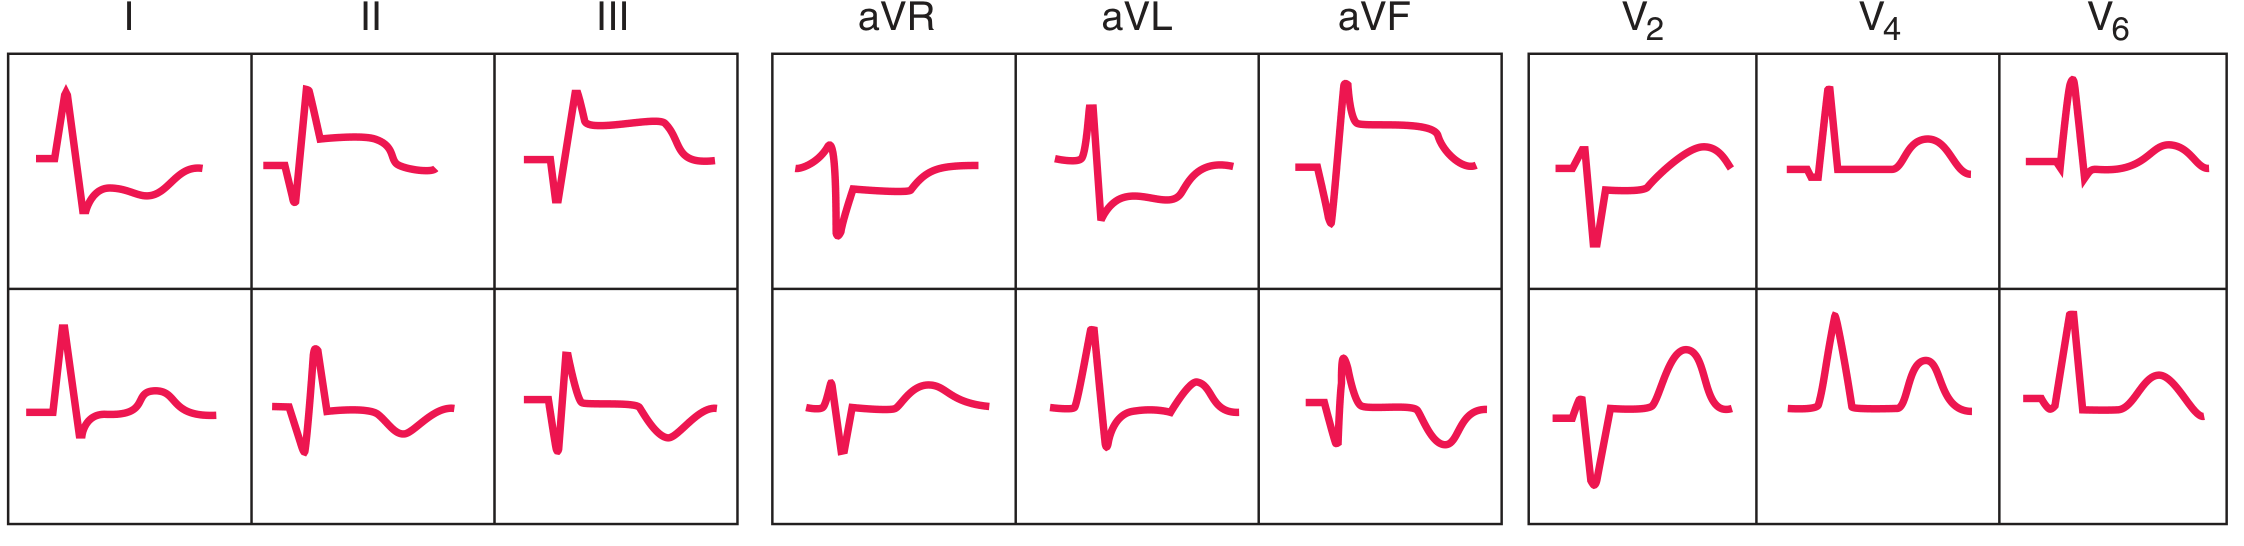
Sequence of changes in anterior (top) and inferior (bottom) ST-elevation Q-wave infarction. Anterior STEMI: ST elevation in I, aVL, V1-V6 with reciprocal depressions in II, III, aVF. Inferior STEMI: ST elevation in II, III, aVF with reciprocal depressions in V1-V3.
(Harrison's Principles of Internal Medicine, 22E - Fig. 247-13)
Q wave criteria for infarction:
- Width ≥40 ms (one small square)
- Depth ≥25% of the R wave in that lead
- Present in ≥2 contiguous leads
9. ST-T Changes in LBBB (Sgarbossa Criteria)
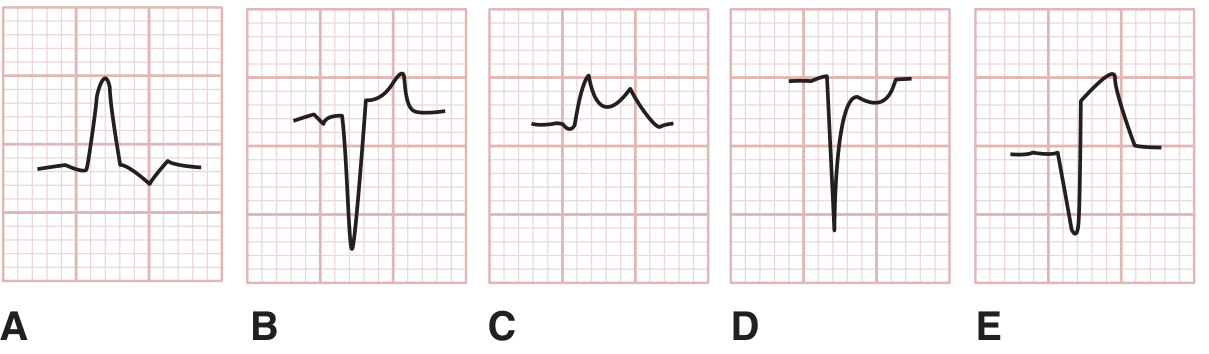
Sgarbossa criteria in LBBB: A=discordant ST depression (normal), B=discordant ST elevation (normal), C=concordant ST elevation (strongly suggests AMI), D=concordant ST depression (suggests AMI), E=>5 mm discordant ST elevation (weakly suggests AMI).
(Tintinalli's Emergency Medicine)
10. QT Interval Changes
Normal QTc (corrected): <440 ms in men, <460 ms in women (Bazett formula)
| Change | Causes |
|---|---|
| Prolonged QTc | Hypokalemia, hypomagnesemia, hypocalcemia; drugs (sotalol, amiodarone, quinidine, haloperidol, erythromycin); congenital long QT syndrome; hypothyroidism |
| Short QTc (<360 ms) | Hypercalcemia, digoxin effect, short QT syndrome |
| Torsades de pointes | Runs of polymorphic VT in the setting of long QT - characteristic twisting of QRS around baseline |
11. Common Electrolyte & Metabolic ECG Patterns
| Condition | ECG Changes |
|---|---|
| Hyperkalemia | Peaked, tent-shaped T waves → Prolonged PR → Widened QRS → Sine wave → Asystole |
| Hypokalemia | Flattened T waves, prominent U waves, ST depression, QT prolongation |
| Hypercalcemia | Short QT interval, shortened ST segment |
| Hypocalcemia | Prolonged QT (lengthened ST segment) |
| Digoxin effect | "Reversed tick" or "hockey stick" ST depression, short QT, PR prolongation |
| Hypothermia | J (Osborn) waves at QRS-ST junction, bradycardia, long QT |
| Pulmonary embolism | Sinus tachycardia (most common), S1Q3T3 pattern, new RBBB, right axis deviation, T inversions V1-V4 |
| Pericarditis | Diffuse saddle-shaped ST elevation + PR depression in most leads; PR elevation in aVR |
Quick Reference Summary
| ECG Component | Key Abnormality | Think of |
|---|---|---|
| P wave | Peaked (≥2.5 mm) | Right atrial overload |
| P wave | Broad, notched; biphasic V1 | Left atrial abnormality |
| PR interval | Short + delta wave | WPW |
| PR interval | Prolonged / varying | AV blocks |
| QRS | Wide rSR' in V1 | RBBB |
| QRS | Wide QS in V1, monophasic R in V6 | LBBB |
| QRS | High voltage + strain | LVH |
| ST segment | Elevation (convex up) + chest pain | STEMI - emergent! |
| ST segment | Diffuse saddle-shaped elevation | Pericarditis |
| ST segment | Depression | NSTEMI, digoxin, strain |
| T wave | Deep symmetric inversions V1-V6 | Wellens' (critical LAD stenosis) |
| T wave | Peaked, tent-shaped | Hyperkalemia |
| Q wave | Wide, deep, ≥2 contiguous leads | Prior MI |
| QT | Prolonged | Drug effect, electrolytes, long QT syndrome |
| U wave | Prominent | Hypokalemia, antiarrhythmics |
Sources: Harrison's Principles of Internal Medicine 22E (2025), Tintinalli's Emergency Medicine, Goldberger AL et al: Goldberger's Clinical Electrocardiography, Tintinalli's ECG figures.
Show images of entire ecg and compare each condition with normal ecg
Finding Sources
Finding Sources
Reading File
Finding Sources
Reading File
Reading File
Reading File
Found excellent images. Now let me search for more full ECG images - hyperkalemia, pericarditis, complete heart block, VT, PE, pulmonary patterns in parallel.
Finding Sources
Finding Sources
Finding Sources
Reading File
Finding Sources
Finding Sources
Reading File
Reading File
You've run out of free credits. Sign up for a free account to continue using Orris.
This is a shared conversation. Sign in to Orris to start your own chat.