
Explain me 10 common heart disease with ECG changes and ECG images of these disease
ECG showing ST elevation myocardial infarction (STEMI)
ECG showing atrial fibrillation irregular rhythm absent P waves
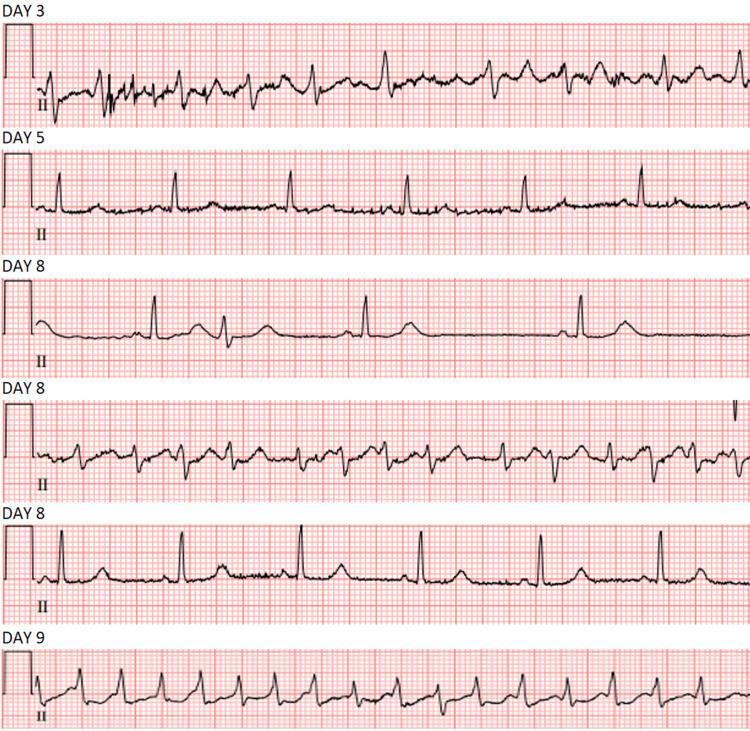
A series of sequential electrocardiogram (ECG) rhythm strips showing Lead II tracings over a seven-day clinical course, illustrating fluctuating cardiac rhythms and conduction disturbances. Day 3 displays a rapid, irregularly irregular rhythm with absent P-waves and undulating fibrillatory baseline, diagnostic of atrial fibrillation with rapid ventricular response (RVR). Day 5 shows spontaneous conversion to sinus rhythm with identifiable P-waves and a more regular rate. Tracings from Day 8 highlight significant rhythm instability, including a slow escape rhythm with widened, unusual QRS morphologies and ST-segment deviations, followed by a transition back to a tachycardic, irregular wide-complex rhythm. Day 9 demonstrates a return to a more regular sinus rhythm with distinct P-waves preceding each QRS complex. This timeline serves as a clinical illustration of paroxysmal atrial fibrillation, conversion pauses, and the management of rhythm and rate control in a symptomatic patient.
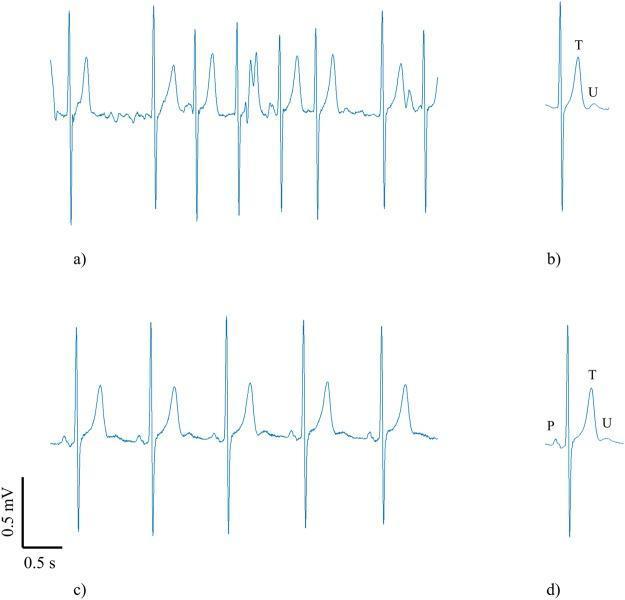
This Comparison Chart illustrates electrocardiography (ECG) waveforms in a single patient during both atrial fibrillation (AF) and sinus rhythm (SR). (a) A 5-second ECG strip showing AF characterized by an irregularly irregular rhythm, absent P waves, and fine fibrillatory oscillations of the baseline. (b) An extracted average beat from the AF strip, revealing a clear T wave and a subsequent U wave that was previously obscured by fibrillatory noise. (c) A 5-second ECG strip showing SR with a regular rhythm, identifiable P waves preceding each QRS complex, and visible U waves. (d) An extracted average beat from the SR strip showing clear P, T, and U wave morphologies. The comparison demonstrates that U waves maintain similar morphology across both rhythms, though they are often indistinguishable in raw AF recordings without signal processing. Scale bars indicate 0.5 mV and 0.5 s. This image is relevant for cardiology students and clinicians studying ventricular repolarization and advanced ECG signal analysis.
ECG showing atrial flutter sawtooth pattern
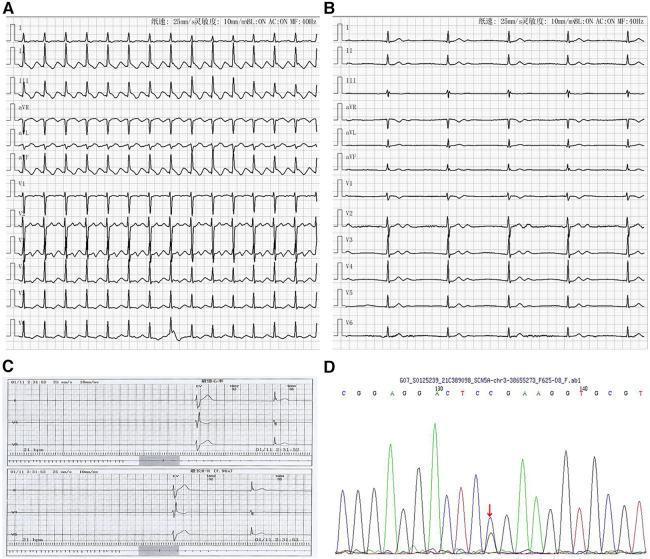
This composite diagnostic image illustrates cardiac electrophysiology findings and genetic analysis associated with Sick Sinus Syndrome (SSS). Panel A displays a 12-lead electrocardiogram (ECG) showing atrial flutter with a characteristic 'sawtooth' pattern of flutter waves (F-waves), most prominent in inferior leads, and a 2:1 conduction ratio resulting in a regular ventricular rate. Panel B shows a follow-up ECG demonstrating atrial standstill, characterized by the complete absence of P waves, and a slow, regular junctional escape rhythm. Panel C contains Holter monitoring strips exhibiting severe bradycardia and a prolonged sinus arrest with a maximum R-R interval of 7.96 seconds. Panel D provides a DNA sequencing chromatogram (Sanger sequencing) identifying a heterozygous SCN5A gene mutation (c.664C>G), which underlies the clinical presentation of familial SSS. The image serves as an educational resource for cardiology and medical genetics, linking phenotypic arrhythmia manifestations (atrial tachyarrhythmia followed by sinus arrest/atrial standstill) to a specific molecular genetic etiology.
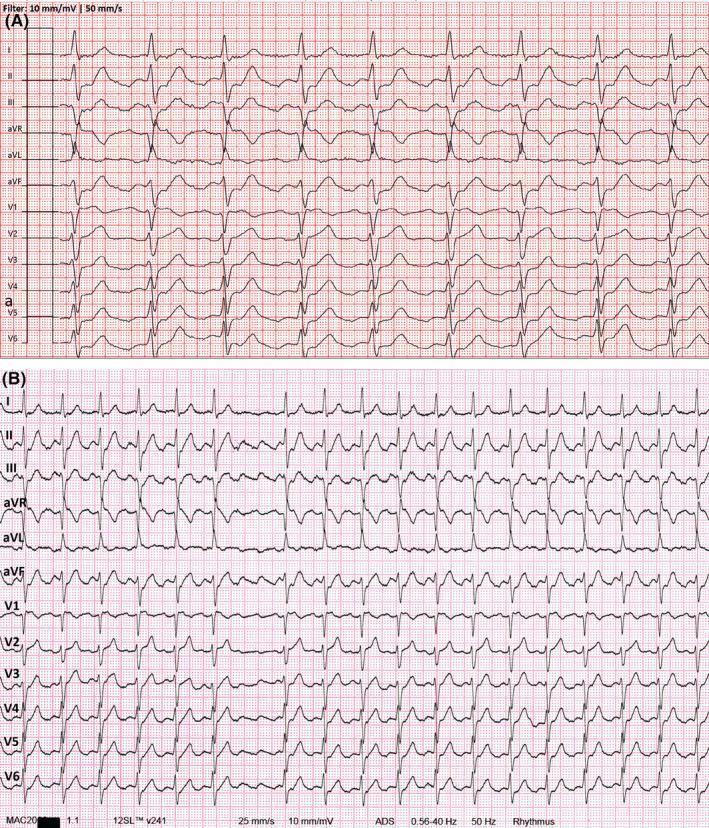
This diagnostic image displays a comparative twelve-lead electrocardiogram (ECG) split into two panels, labeled (A) and (B), showing the progression of a supraventricular arrhythmia. Panel (A) exhibits a broad-complex tachycardia with a ventricular rate of approximately 120 bpm. Notable features include prominent ST-segment elevation in the precordial leads (V1-V6) and inferior leads (II, III, aVF), which can mimic acute myocardial infarction. Careful observation reveals negative P waves in the inferior leads and positive P waves in V1-V2, suggesting an ectopic atrial origin. Panel (B) demonstrates the results of an adenosine test, which unmasks a characteristic 'sawtooth' baseline pattern of cavotricuspid isthmus (CTI)-dependent atrial flutter with 2:1 conduction. Following the decrease in ventricular rate and diagnosis of atrial flutter, panel (B) shows near-complete normalization of the previous ST-segment elevations. This comparison serves as a clinical teaching tool for recognizing rate-related ST-segment changes (tachycardia-induced ischemia) and the diagnostic utility of adenosine in differentiating complex supraventricular tachyarrhythmias.
ECG showing ventricular tachycardia wide complex
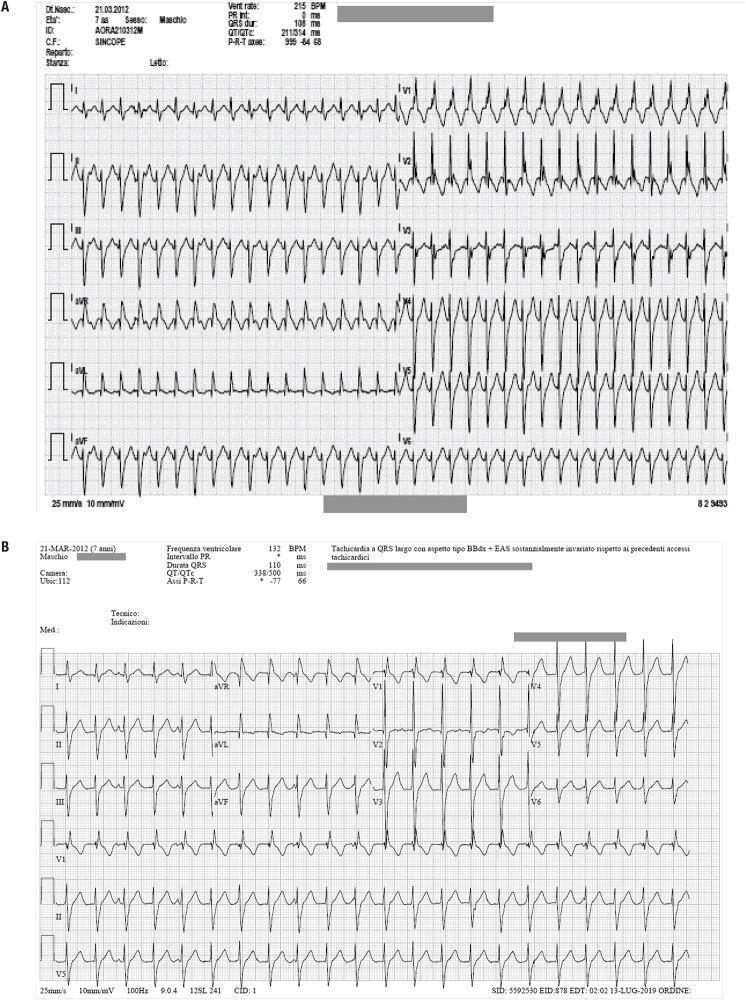
Two diagnostic 12-lead electrocardiogram (ECG) tracings (labeled A and B) from a 7-year-old male patient showing wide-complex tachyarrhythmias. Figure 1A demonstrates a regular, wide QRS tachycardia at a rate of approximately 215 BPM. The morphology exhibits features consistent with a right bundle branch block (RBBB) pattern and a superior axis, suggestive of left anterior fascicular block. Figure 1B shows a subsequent episode of wide-complex tachycardia at a slower rate of 132 BPM, maintaining the RBBB-like morphology and superior QRS axis deviation. Key diagnostic parameters provided in the ECG headers include a QRS duration of 110 ms in Figure 1B and a markedly shifted P-R-T axis between the two recordings. Both tracings represent ventricular fascicular tachycardia (VFT), a specific type of idiopathic ventricular tachycardia often characterized by a RBBB pattern and axis deviation. The images serve as educational materials for distinguishing fascicular ventricular tachycardia from other forms of supraventricular or ventricular arrhythmias based on QRS morphology, axis, and rate.
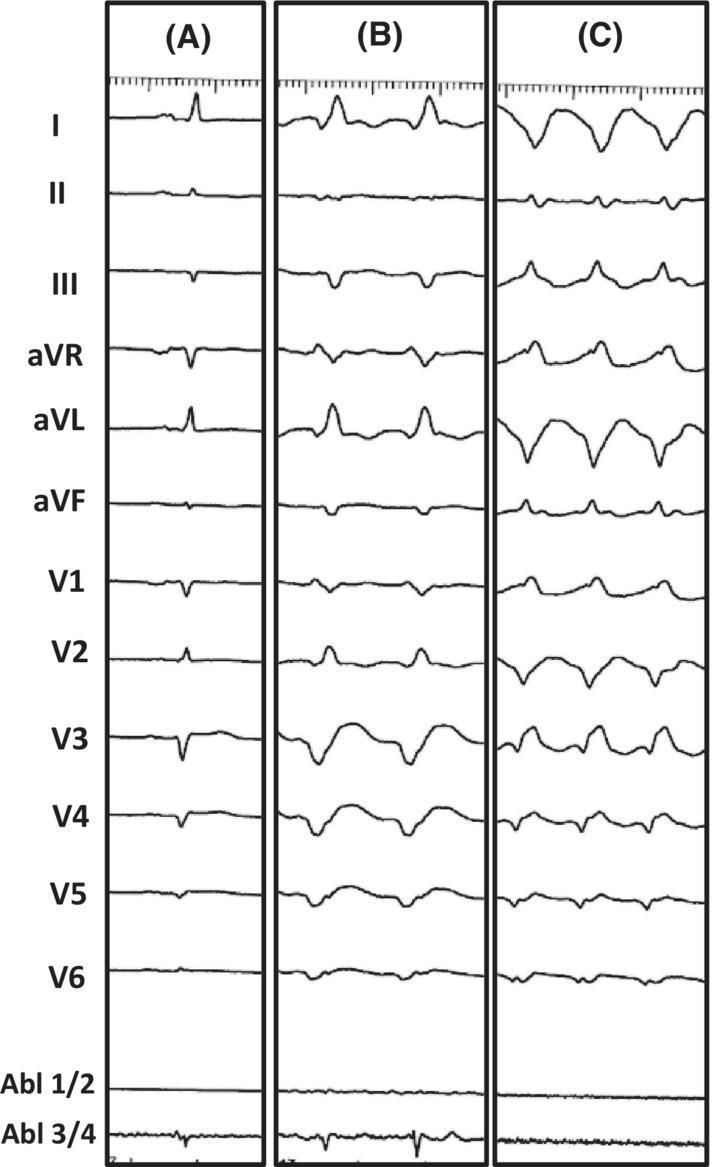
This diagnostic image consists of three vertical panels (A, B, and C) displaying 12-lead electrocardiogram (ECG) tracings alongside intracardiac ablation catheter signals (Abl 1/2, Abl 3/4). Panel A represents the patient's baseline ECG, showing narrow QRS complexes and normal sinus rhythm. Panel B illustrates Ventricular Tachycardia (VT) Morphology 1, characterized by a wide-complex tachycardia with a right bundle branch block (RBBB) morphology in V1 and a predominantly positive axis in lead I. Panel C displays VT Morphology 2, which shows a different wide-complex tachycardia pattern with a more discordant QRS morphology across the precordial leads and higher frequency compared to Panel B. The image serves as an educational tool for comparing baseline cardiac rhythms with different morphologies of monomorphic ventricular tachycardia in the context of electrophysiology studies and catheter ablation. It demonstrates clinical features such as QRS widening, secondary ST-T wave changes, and morphology shifts indicative of different ventricular exit sites during a VT storm.
ECG showing ventricular fibrillation chaotic waveform
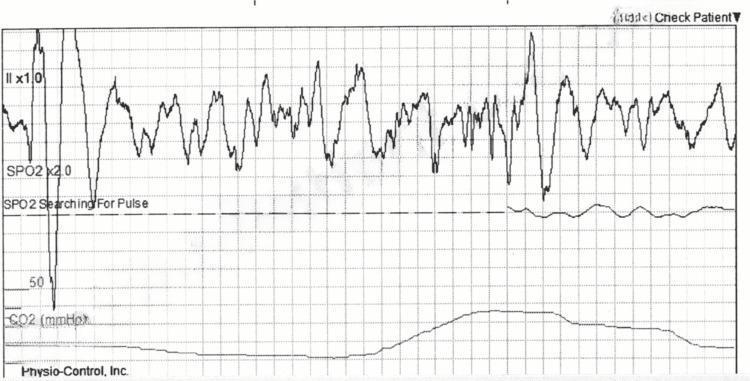
This diagnostic image shows a multi-parameter monitor strip capturing a critical cardiac event. The top tracing (Lead II x1.0) demonstrates a classic Ventricular Fibrillation (VF) pattern, characterized by a chaotic, disorganized, and erratic rhythm with varying amplitudes and frequencies. There are no identifiable P waves, QRS complexes, or T waves, representing the absence of coordinated ventricular depolarization. Below the ECG, the SpO2 plethysmography channel (SpO2 x2.0) initially shows a significant artifact followed by a flatline with a 'Searching For Pulse' status indicator, consistent with a loss of mechanical output and perfusion during VF. The bottom tracing displays capnography (CO2 mmHg), showing a low, relatively flat waveform that suggests minimal to absent ventilation or circulation during the arrest. The image serves as a clinical illustration of sudden cardiac arrest and the associated loss of physiological monitoring signals. The visual data is critical for training in Advanced Cardiac Life Support (ACLS), emphasizing the immediate need for defibrillation.
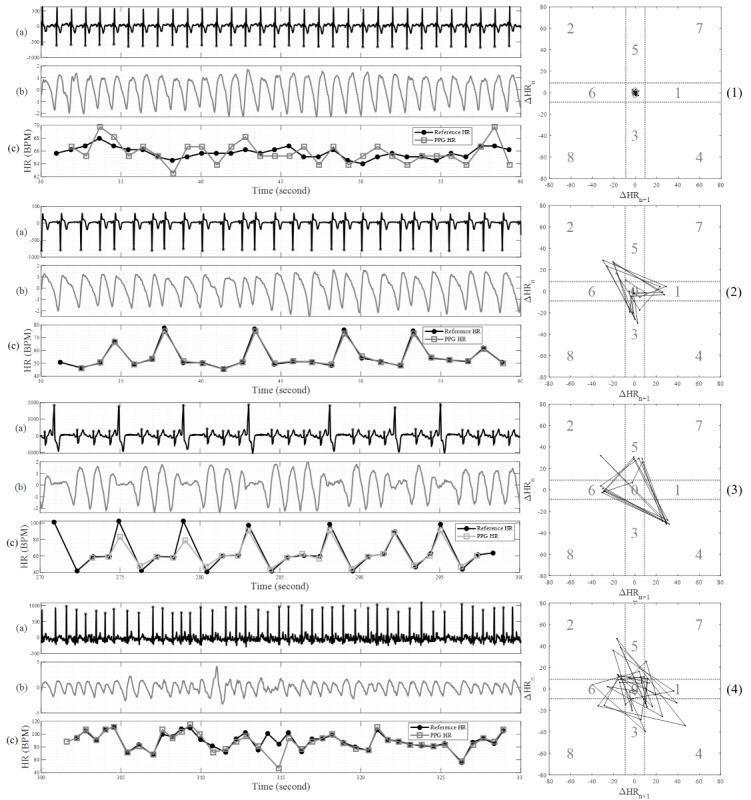
A multi-panel clinical diagnostic chart comparing four cardiac rhythm states using data from a smartwatch. The panels represent: (1) Normal Sinus Rhythm (NSR), (2) Premature Atrial Contractions (PAC), (3) Premature Ventricular Contractions (PVC), and (4) Atrial Fibrillation (AF). Each panel consists of three synchronized physiological signal segments: (a) a single-lead electrocardiogram (ECG) trace showing QRS morphology, (b) a photoplethysmogram (PPG) pulse waveform, and (c) a heart rate (BPM) over time graph comparing reference HR vs. PPG HR. To the right of each panel is a Poincaré plot, which visualizes pulse interval variability. The NSR panel shows high regularity with a tight central cluster on the Poincaré plot. The PAC and PVC panels demonstrate ectopic beats with corresponding disruptions in the PPG amplitude and wider dispersion on the Poincaré plots (distinct triangular shapes for PVCs). The AF panel exhibits a chaotic ECG baseline with irregularly irregular QRS intervals, reflected by a highly scattered, amorphous cloud of points on the Poincaré plot, indicating significant heart rate variability.
ECG showing complete heart block third degree AV block
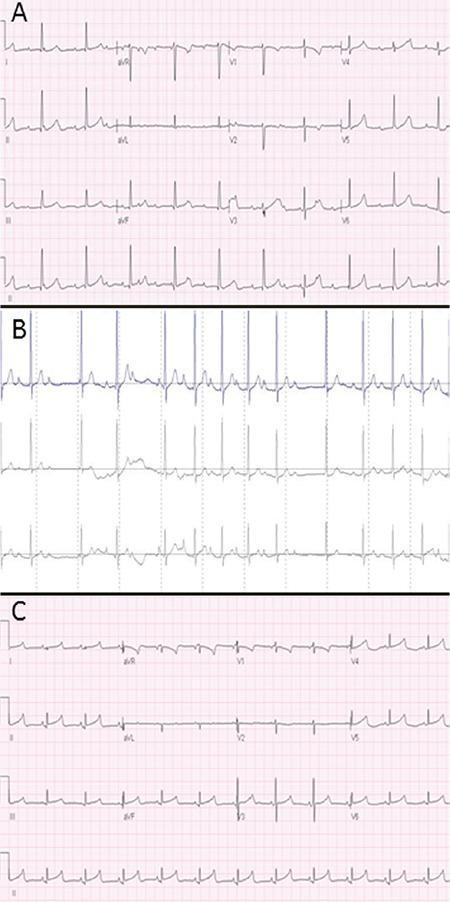
A comparison of three sequential electrocardiographic (ECG) tracings demonstrating the evolution and resolution of atrioventricular (AV) conduction abnormalities. Panel A displays a standard 12-lead ECG from Day 1 showing complete AV dissociation (Third-degree AV block). Key findings include a regular atrial rate (P waves) significantly faster than the regular ventricular rate (narrow QRS complexes), indicating no relationship between atrial and ventricular activity. Panel B presents a rhythm strip from a 24-hour Holter monitor on Day 15, illustrating a Mobitz Type I (Wenckebach) AV block. The tracing shows characteristic progressive prolongation of the PR interval followed by a non-conducted P wave (dropped QRS complex). Panel C shows a follow-up 12-lead ECG from sixteen months later, demonstrating a normal sinus rhythm with stable 1:1 AV conduction, consistent P wave morphology, and a normal PR interval. This visual progression is used to educate on the clinical spectrum of congenital heart block and its potential for recovery.
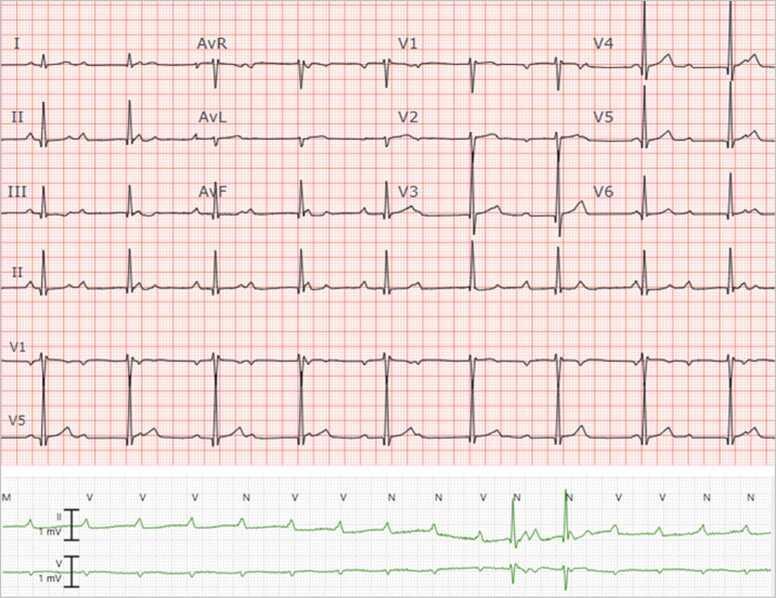
This diagnostic image contains a standard 12-lead electrocardiogram (ECG) and a continuous rhythm strip demonstrating complete (third-degree) atrioventricular (AV) block. The 12-lead ECG at the top displays narrow QRS complexes with a relatively slow ventricular rate. A critical finding is AV dissociation, where P-waves and QRS complexes occur independently of each other, indicating no electrical communication between the atria and ventricles. The rhythm strip at the bottom provides a detailed view of this pathology, showing regular sinus P-waves (atrial activity) that are frequently non-conducted, resulting in significant ventricular pauses and an irregular ventricular rhythm. The preservation of narrow QRS morphology suggests a proximal escape pacemaker, likely located in the AV junction. This visual material is a classic representation of high-grade conduction system disease, used in cardiology and emergency medicine education to illustrate the criteria for complete heart block and the identification of non-conducted P-waves.
ECG showing left bundle branch block pattern
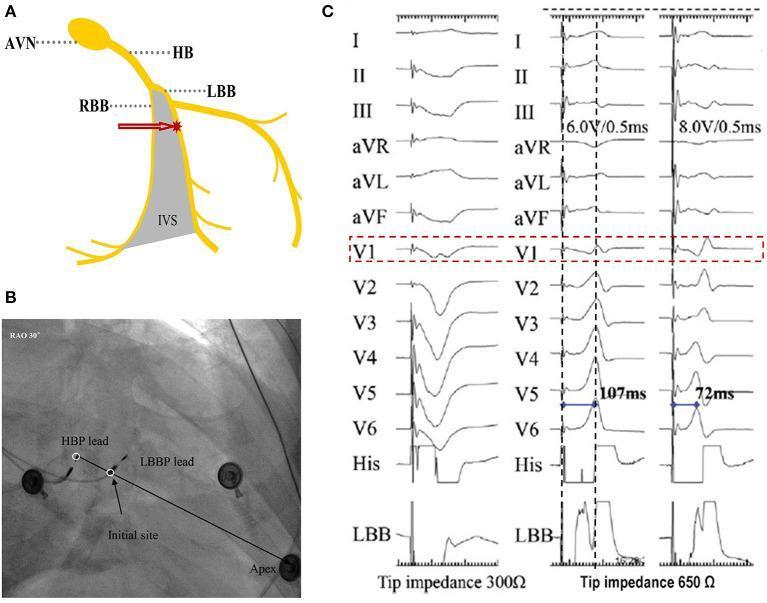
This composite educational image illustrates the localization and electrophysiological characteristics of left bundle branch pacing (LBBP). Panel A is an anatomical diagram showing the atrioventricular node (AVN), His bundle (HB), and the branching into the right bundle branch (RBB) and left bundle branch (LBB) along the interventricular septum (IVS). Panel B is a fluoroscopic image in the right anterior oblique (RAO) 30° view, demonstrating lead placement for His-bundle pacing (HBP) and LBBP relative to the cardiac apex. Panel C displays 12-lead ECG tracings and intracardiac electrograms demonstrating the progression of LBB capture. Key features include the transformation of lead V1 morphology from a 'W' pattern with a nadir notch (unipolar tip pacing at 300 Ω) to an R wave as the lead is advanced deeper into the septum (650 Ω). The rightmost tracings show the shift to a right bundle branch block (RBBB) pattern when output is increased from 6.0 V to 8.0 V, with a corresponding shortening of the peak left ventricular activation time (pLVAT) from 107 ms to 72 ms, indicating definitive LBB capture.
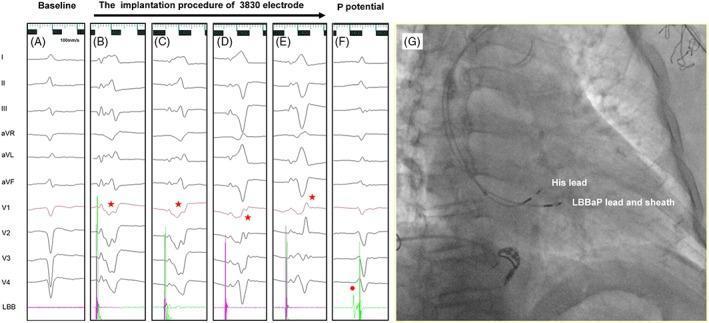
This composite educational image illustrates the procedure for left bundle branch area pacing (LBBaP) using a 3830 lead. Panels A–F present 12-lead electrocardiogram (ECG) and intracardiac electrogram (EGM) tracings. Panel A shows baseline ECG. Panels B–E demonstrate the dynamic evolution of the QRS morphology in lead V1 as the electrode is screwed into the interventricular septum. Initially, a 'W-shaped' QRS with a mid-notch is observed (red star, panel B). As the lead advances, this notch migrates toward the end of the QRS complex (panels C–D) until a terminal R' wave emerges (panel E), creating a right bundle branch block (RBBB) pattern indicative of successful capture of the left bundle branch system. Panel F identifies the Purkinje (P) potential (red dot) on the local EGM. Panel G is a fluoroscopic image in a right anterior oblique (RAO) view showing the anatomical positioning of the 'His lead' and the 'LBBaP lead and sheath,' demonstrating the LBBaP lead's location slightly inferior and distal to the His-bundle region.
ECG showing right bundle branch block pattern
This composite educational image illustrates the localization and electrophysiological characteristics of left bundle branch pacing (LBBP). Panel A is an anatomical diagram showing the atrioventricular node (AVN), His bundle (HB), and the branching into the right bundle branch (RBB) and left bundle branch (LBB) along the interventricular septum (IVS). Panel B is a fluoroscopic image in the right anterior oblique (RAO) 30° view, demonstrating lead placement for His-bundle pacing (HBP) and LBBP relative to the cardiac apex. Panel C displays 12-lead ECG tracings and intracardiac electrograms demonstrating the progression of LBB capture. Key features include the transformation of lead V1 morphology from a 'W' pattern with a nadir notch (unipolar tip pacing at 300 Ω) to an R wave as the lead is advanced deeper into the septum (650 Ω). The rightmost tracings show the shift to a right bundle branch block (RBBB) pattern when output is increased from 6.0 V to 8.0 V, with a corresponding shortening of the peak left ventricular activation time (pLVAT) from 107 ms to 72 ms, indicating definitive LBB capture.
This composite educational image illustrates the procedure for left bundle branch area pacing (LBBaP) using a 3830 lead. Panels A–F present 12-lead electrocardiogram (ECG) and intracardiac electrogram (EGM) tracings. Panel A shows baseline ECG. Panels B–E demonstrate the dynamic evolution of the QRS morphology in lead V1 as the electrode is screwed into the interventricular septum. Initially, a 'W-shaped' QRS with a mid-notch is observed (red star, panel B). As the lead advances, this notch migrates toward the end of the QRS complex (panels C–D) until a terminal R' wave emerges (panel E), creating a right bundle branch block (RBBB) pattern indicative of successful capture of the left bundle branch system. Panel F identifies the Purkinje (P) potential (red dot) on the local EGM. Panel G is a fluoroscopic image in a right anterior oblique (RAO) view showing the anatomical positioning of the 'His lead' and the 'LBBaP lead and sheath,' demonstrating the LBBaP lead's location slightly inferior and distal to the His-bundle region.
ECG showing left ventricular hypertrophy high voltage
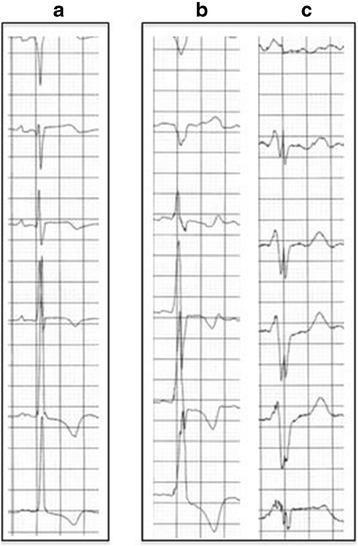
Diagnostic Image: This figure displays three vertical panels (a, b, and c) of electrocardiogram (ECG) rhythm strips comparing different clinical presentations and temporal progressions. Panel a shows a regular sinus rhythm with narrow QRS complexes and relatively normal morphology in an asymptomatic patient. Panel b illustrates high-voltage R waves and deep S waves, which are characteristic findings of left ventricular hypertrophy (LVH) in a patient later diagnosed with Fabry disease. Panel c demonstrates further pathological progression over two years, showing widened QRS complexes with notching, slurred segments, and pronounced T-wave inversions, suggesting worsening conduction delay and ventricular strain. The comparison highlights the transition from subtle electrical signs of hypertrophy to significant cardiomyopathy-related ECG abnormalities, including high voltage, repolarization disturbances, and morphological changes associated with progressive non-ischemic dilated cardiomyopathy.
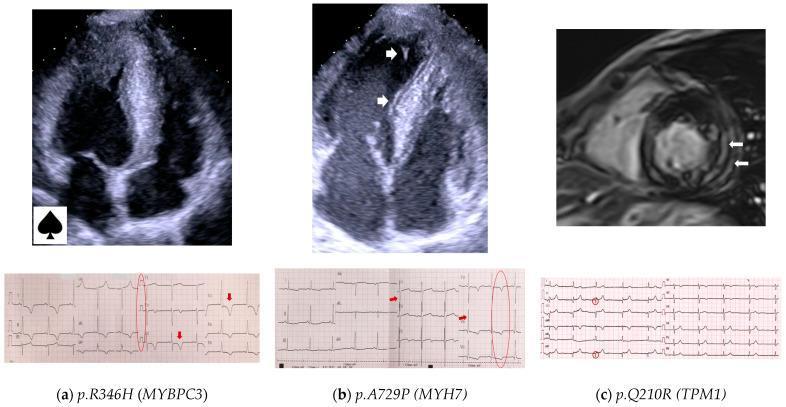
This composite figure presents clinical imaging and electrocardiogram (ECG) data for Hypertrophic Cardiomyopathy (HCM) associated with specific genetic variants.
ECG showing acute pericarditis diffuse ST elevation PR depression
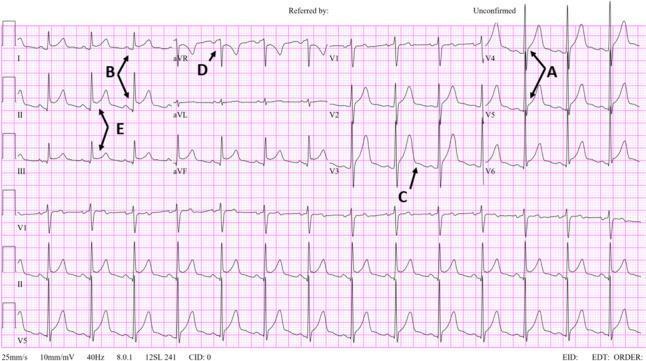
A 12-lead electrocardiogram (ECG) demonstrating pathognomonic findings of acute pericarditis. Key diagnostic features are annotated throughout the tracing: (A) widespread concave ST-segment elevations, most prominent in the lateral precordial leads V4-V6; (B) PR-segment depression, particularly visible in leads I and II; (C) Spodick's sign, indicated by a downsloping T-P segment in lead V3; (D) the 'knuckle sign' in lead aVR, characterized by PR-segment elevation and reciprocal ST-segment depression; and (E) a comparison showing ST-segment elevation in lead II being greater than in lead III, a feature that helps differentiate pericarditis from inferior wall myocardial infarction. The image illustrates Stage 1 of the classical ECG evolution of pericarditis, emphasizing the diffuse nature of the ST-segment changes and the clinical significance of PR-segment shifts and specific morphology signs in diagnosing inflammatory pericardial disease.
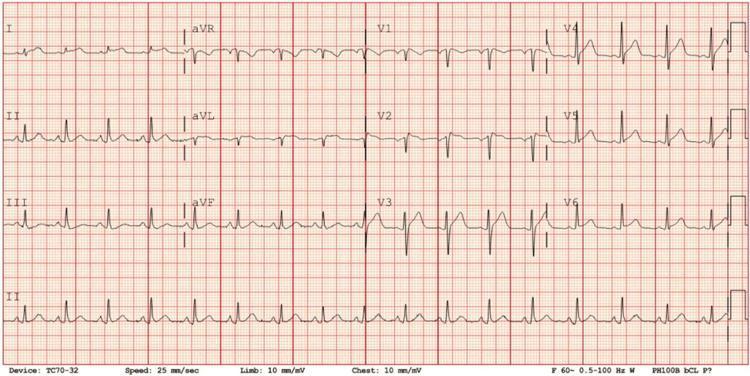
A 12-lead electrocardiogram (ECG) showing sinus tachycardia at approximately 101 beats per minute. The tracing displays the standard limb leads (I, II, III, aVR, aVL, aVF) and precordial leads (V1-V6) on standard red grid paper. Key diagnostic findings include diffuse, concave-upward ST-segment elevation visible in multiple leads (specifically leads I, II, aVF, and V2-V6), accompanied by reciprocal ST-segment depression in lead aVR. Additionally, there is characteristic PR-segment depression, most prominent in lead II, and reciprocal PR-segment elevation in lead aVR. These findings are classically indicative of acute pericarditis. The QRS complexes appear normal in duration and morphology, and there is a consistent P-wave before every QRS complex, confirming the sinus origin of the tachycardia.
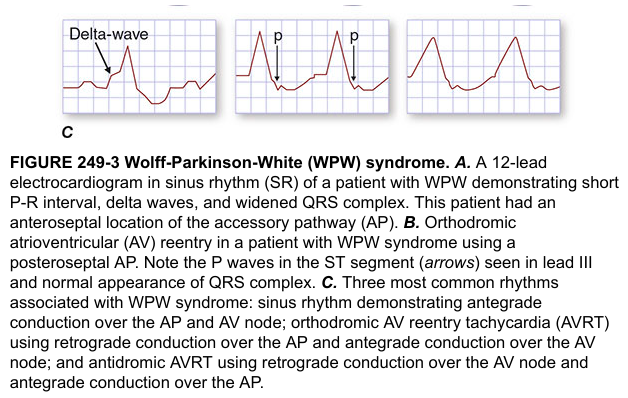
ECG showing Wolff-Parkinson-White syndrome delta wave
"electrocardiography"[MeSH Terms] AND "arrhythmias, cardiac"[MeSH Terms]
10 Common Heart Diseases with Characteristic ECG Changes
1. Myocardial Infarction (STEMI/NSTEMI)
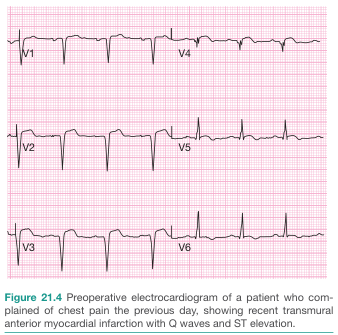
2. Atrial Fibrillation
3. Atrial Flutter
4. Ventricular Tachycardia (VT)
5. Ventricular Fibrillation (VF)
6. Third-Degree (Complete) Heart Block
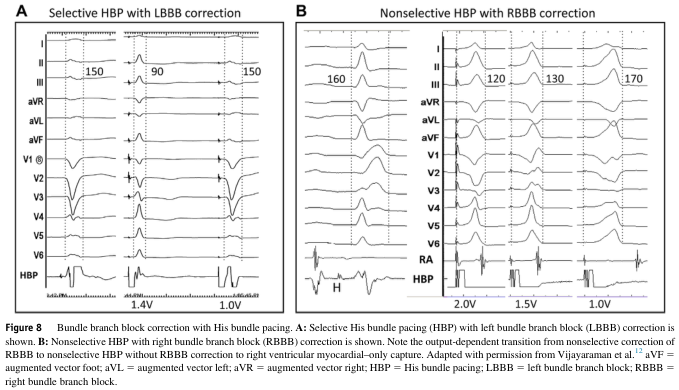
7. Bundle Branch Block (RBBB/LBBB)
- RBBB: "rabbit-ear" RSR' pattern in V1-V2, wide slurred S wave in I and V6.
- LBBB: broad, notched/monophasic R wave in I, aVL, V5-V6, absent Q waves laterally, discordant ST-T changes. New LBBB in the setting of chest pain is treated as an MI-equivalent - Goldman-Cecil Medicine; Textbook of Family Medicine 9e.
8. Left Ventricular Hypertrophy (LVH)
9. Acute Pericarditis
10. Wolff-Parkinson-White (WPW) Syndrome
Create a quick reference PDF guide for ECG changes in these 10 cardiac conditions
mkdir -p /tmp/workspace/ecg-guide/assets /tmp/workspace/ecg-guide/output && ls -la /tmp/workspace/
cd /tmp/workspace/ecg-guide/assets && \ curl -sL -o 01_mi.png "https://cdn.orris.care/cdss_images/BAILY_1760538582892_e1fdf7cd-2bc0-4164-9a75-cc5ee72a55fa.png" && \ curl -sL -o 02_afib.jpg "https://cdn.orris.care/cdss_images/pmc_clinical_VQA_60b5f22fa9e0916dd71f6e8b9264cbada980d724ae3e9a4cf2e005a109990db9.jpg" && \ curl -sL -o 03_aflutter.jpg "https://cdn.orris.care/cdss_images/pmc_clinical_VQA_0ad1909aaee51a7a27a478ab3de08e610882dab9acd8624c96d737d6a34a8528.jpg" && \ curl -sL -o 04_vt.jpg "https://cdn.orris.care/cdss_images/pmc_clinical_VQA_4343c69340d1e8a5ddddca038b1ed9ae1eccd256c076e9f61c3c8a0fe1fa5370.jpg" && \ curl -sL -o 05_vf.jpg "https://cdn.orris.care/cdss_images/pmc_clinical_VQA_303b1514f70a8e82ef939698574a16f7386749256bab2fcaeccc9f8da40639f4.jpg" && \ curl -sL -o 06_chb.jpg "https://cdn.orris.care/cdss_images/pmc_clinical_VQA_571325ed86bbb9dfa79ed56a22d537416173bc2440356f3e1794433789e1fea5.jpg" && \ curl -sL -o 07_bbb.png "https://cdn.orris.care/cdss_images/GLGCA_2774942_1766813822169_4c8d0f7f-946a-426e-b5a2-bc6d8407fa2a_63c721d9-0ea8-493d-9c1c-cbc2457b1f6a.png" && \ curl -sL -o 08_lvh.jpg "https://cdn.orris.care/cdss_images/pmc_clinical_VQA_6f67088cf6232727bc06592afb7212051256e193f6ce6c0cacabc85cae5e16d9.jpg" && \ curl -sL -o 09_pericarditis.jpg "https://cdn.orris.care/cdss_images/pmc_clinical_VQA_550a74c11c6ca88307bb3a5a9f8c75af6ec6940529fbcd4176676549c936f725.jpg" && \ curl -sL -o 10_wpw.png "https://cdn.orris.care/cdss_images/HARRISON_1763033426339_c969f249-cd80-455b-947a-a404d937cec3.png" && \ ls -la /tmp/workspace/ecg-guide/assets/ && file /tmp/workspace/ecg-guide/assets/*
~/ecg-guide/build_pdf.py
#!/usr/bin/env python3
"""Build ECG Quick Reference Guide PDF for 10 common cardiac conditions."""
from reportlab.lib.pagesizes import letter
from reportlab.lib.units import inch
from reportlab.lib import colors
from reportlab.lib.styles import getSampleStyleSheet, ParagraphStyle
from reportlab.platypus import (
SimpleDocTemplate, Paragraph, Spacer, Image, Table, TableStyle,
PageBreak, HRFlowable, KeepTogether
)
from reportlab.lib.enums import TA_CENTER, TA_LEFT
import os
ASSETS = "/tmp/workspace/ecg-guide/assets"
OUTPUT = "/tmp/workspace/ecg-guide/output/ECG_Quick_Reference_Guide.pdf"
# ---------- Styles ----------
styles = getSampleStyleSheet()
title_style = ParagraphStyle(
"TitleStyle", parent=styles["Title"], fontSize=22, textColor=colors.HexColor("#7a1f1f"),
spaceAfter=4, alignment=TA_CENTER
)
subtitle_style = ParagraphStyle(
"SubtitleStyle", parent=styles["Normal"], fontSize=11, textColor=colors.HexColor("#555555"),
alignment=TA_CENTER, spaceAfter=14
)
condition_title_style = ParagraphStyle(
"CondTitle", parent=styles["Heading1"], fontSize=15, textColor=colors.white,
backColor=colors.HexColor("#7a1f1f"), leading=20, spaceAfter=0, spaceBefore=0,
leftIndent=6, borderPadding=(6, 6, 6, 6)
)
label_style = ParagraphStyle(
"Label", parent=styles["Normal"], fontSize=9.5, textColor=colors.HexColor("#7a1f1f"),
fontName="Helvetica-Bold", spaceAfter=2
)
body_style = ParagraphStyle(
"Body", parent=styles["Normal"], fontSize=9.5, leading=13, alignment=TA_LEFT,
spaceAfter=6
)
caption_style = ParagraphStyle(
"Caption", parent=styles["Normal"], fontSize=7.5, leading=9.5,
textColor=colors.HexColor("#666666"), alignment=TA_CENTER, spaceBefore=3
)
source_style = ParagraphStyle(
"Source", parent=styles["Normal"], fontSize=7.5, leading=9,
textColor=colors.HexColor("#888888"), fontName="Helvetica-Oblique"
)
toc_style = ParagraphStyle(
"TOC", parent=styles["Normal"], fontSize=10.5, leading=16
)
# ---------- Data ----------
conditions = [
{
"num": "1",
"name": "Myocardial Infarction (STEMI / NSTEMI)",
"img": "01_mi.png",
"key_changes": [
"Hyperacute T waves (earliest change)",
"ST-segment elevation (convex/\u201ctombstone\u201d) in the leads overlying the infarct territory",
"Pathologic Q waves develop as infarction evolves (necrosis)",
"Reciprocal ST depression in opposite leads",
"NSTEMI: ST depression / T-wave inversion, no ST elevation",
],
"pearl": "Localize the infarct by lead territory: V1-V4 anterior, II/III/aVF inferior, I/aVL/V5-V6 lateral.",
"source": "Braunwald's Heart Disease; Fuster and Hurst's The Heart, 15th Ed.",
},
{
"num": "2",
"name": "Atrial Fibrillation",
"img": "02_afib.jpg",
"key_changes": [
"Irregularly irregular ventricular rhythm",
"Absent discrete P waves",
"Fine fibrillatory baseline oscillations replace P waves",
"Variable, often rapid ventricular rate",
],
"pearl": "Look for an irregularly irregular rhythm with no consistent P wave before each QRS - the single most reliable clue.",
"source": "Guyton and Hall Textbook of Medical Physiology.",
},
{
"num": "3",
"name": "Atrial Flutter",
"img": "03_aflutter.jpg",
"key_changes": [
"Regular \u201csawtooth\u201d flutter (F) waves, best seen in inferior leads",
"Atrial rate typically 250-350/min (classically 300/min)",
"Fixed conduction ratios common (e.g. 2:1) giving a regular ventricular rate",
"Adenosine can transiently unmask flutter waves by increasing AV block",
],
"pearl": "A ventricular rate of exactly ~150/min should raise suspicion for atrial flutter with 2:1 block.",
"source": "Fuster and Hurst's The Heart, 15th Ed.; Rosen's Emergency Medicine.",
},
{
"num": "4",
"name": "Ventricular Tachycardia (VT)",
"img": "04_vt.jpg",
"key_changes": [
"Wide QRS complex (>120 ms), rate >100/min",
"Monomorphic: regular, uniform QRS morphology",
"Polymorphic (e.g. Torsades de Pointes): varying QRS morphology, often with prolonged QT",
"AV dissociation and fusion/capture beats support the diagnosis",
],
"pearl": "Any wide-complex tachycardia in a patient with known structural heart disease should be treated as VT until proven otherwise.",
"source": "Tintinalli's Emergency Medicine; Goldman-Cecil Medicine.",
},
{
"num": "5",
"name": "Ventricular Fibrillation (VF)",
"img": "05_vf.jpg",
"key_changes": [
"Chaotic, disorganized, irregular waveform",
"No identifiable P waves, QRS complexes, or T waves",
"Varying amplitude and frequency",
"Represents cardiac arrest - requires immediate defibrillation",
],
"pearl": "No organized electrical activity = no cardiac output. Start CPR and defibrillate immediately; do not delay for further ECG analysis.",
"source": "Guyton and Hall Textbook of Medical Physiology; Tintinalli's Emergency Medicine.",
},
{
"num": "6",
"name": "Third-Degree (Complete) Heart Block",
"img": "06_chb.jpg",
"key_changes": [
"Complete AV dissociation: P waves and QRS complexes march independently",
"Atrial rate faster than ventricular escape rate",
"Narrow QRS if escape focus is junctional; wide QRS if ventricular escape",
"Regular P-P and regular R-R intervals, but no fixed PR relationship",
],
"pearl": "P waves that seem to \u201cwander\u201d in and out of QRS complexes without any consistent PR interval is the hallmark.",
"source": "Goldman-Cecil Medicine; Morgan and Mikhail's Clinical Anesthesiology.",
},
{
"num": "7",
"name": "Bundle Branch Block (RBBB / LBBB)",
"img": "07_bbb.png",
"key_changes": [
"QRS duration \u2265120 ms (complete block)",
"RBBB: RSR' (\u201crabbit-ear\u201d) pattern in V1-V2; wide slurred S wave in I and V6",
"LBBB: broad, notched/monophasic R wave in I, aVL, V5-V6; absent lateral Q waves",
"Discordant, secondary ST-T wave changes accompany both patterns",
],
"pearl": "New LBBB with chest pain is managed as an MI-equivalent; RBBB does not typically obscure ST-elevation MI diagnosis.",
"source": "Goldman-Cecil Medicine; Textbook of Family Medicine, 9th Ed.",
},
{
"num": "8",
"name": "Left Ventricular Hypertrophy (LVH)",
"img": "08_lvh.jpg",
"key_changes": [
"Increased QRS voltage (Sokolow-Lyon: S in V1 + R in V5/V6 > 35 mm)",
"\u201cStrain\u201d pattern: ST depression with asymmetric T-wave inversion in I, aVL, V5-V6",
"Left atrial enlargement often coexists (broad notched P wave in II)",
"Left axis deviation may be present",
],
"pearl": "Voltage criteria alone are neither very sensitive nor specific - correlate with clinical context (e.g. hypertension, aortic stenosis).",
"source": "Fuster and Hurst's The Heart, 15th Ed.",
},
{
"num": "9",
"name": "Acute Pericarditis",
"img": "09_pericarditis.jpg",
"key_changes": [
"Diffuse, concave (\u201csaddle-shaped\u201d) ST elevation across multiple leads (not localized)",
"PR-segment depression, most marked in lead II",
"Reciprocal PR elevation and ST depression in aVR (\u201cknuckle sign\u201d)",
"Spodick's sign: downsloping T-P segment",
"ST elevation in lead II > lead III helps distinguish from inferior MI",
],
"pearl": "Diffuse (not regional) ST elevation plus PR depression = pericarditis, not MI.",
"source": "Goldman-Cecil Medicine; Symptom to Diagnosis: An Evidence-Based Guide.",
},
{
"num": "10",
"name": "Wolff-Parkinson-White (WPW) Syndrome",
"img": "10_wpw.png",
"key_changes": [
"Short PR interval (<120 ms)",
"Delta wave: slurred initial upstroke of the QRS complex",
"Widened QRS (>110 ms) from ventricular pre-excitation",
"Predisposes to AVRT; AF with WPW can cause dangerously rapid ventricular rates",
],
"pearl": "Avoid AV-nodal blocking agents (e.g. adenosine, verapamil) in pre-excited AF with WPW - they can accelerate conduction down the accessory pathway.",
"source": "Harrison's Principles of Internal Medicine, 22nd Ed.",
},
]
# ---------- Build story ----------
story = []
# Cover / Title
story.append(Spacer(1, 0.4 * inch))
story.append(Paragraph("ECG QUICK REFERENCE GUIDE", title_style))
story.append(Paragraph("10 Common Cardiac Conditions & Their Characteristic ECG Changes", subtitle_style))
story.append(HRFlowable(width="100%", thickness=1.2, color=colors.HexColor("#7a1f1f")))
story.append(Spacer(1, 0.25 * inch))
# TOC
toc_data = [[Paragraph(f"<b>{c['num']}.</b> {c['name']}", toc_style)] for c in conditions]
toc_table = Table(toc_data, colWidths=[6.4 * inch])
toc_table.setStyle(TableStyle([
("BOTTOMPADDING", (0, 0), (-1, -1), 6),
("TOPPADDING", (0, 0), (-1, -1), 6),
("LINEBELOW", (0, 0), (-1, -2), 0.4, colors.HexColor("#dddddd")),
]))
story.append(toc_table)
story.append(Spacer(1, 0.3 * inch))
story.append(Paragraph(
"This guide summarizes the classic ECG findings, clinical pearls, and reference images for 10 "
"common cardiac conditions frequently tested and encountered in clinical practice. It is intended "
"as a rapid-review study aid, not a substitute for full clinical evaluation.",
body_style
))
story.append(PageBreak())
# Condition pages (2 per page roughly, using KeepTogether blocks)
for c in conditions:
block = []
block.append(Paragraph(f"{c['num']}. {c['name']}", condition_title_style))
block.append(Spacer(1, 8))
img_path = os.path.join(ASSETS, c["img"])
img = Image(img_path)
# Scale image to fit width while preserving aspect ratio
max_w, max_h = 2.6 * inch, 2.3 * inch
ratio = min(max_w / img.imageWidth, max_h / img.imageHeight)
img.drawWidth = img.imageWidth * ratio
img.drawHeight = img.imageHeight * ratio
changes_list = "".join(f"<bullet>•</bullet> {ch}<br/>" for ch in c["key_changes"])
left_cell = [
Paragraph("KEY ECG CHANGES", label_style),
Paragraph(changes_list, body_style),
Spacer(1, 4),
Paragraph("CLINICAL PEARL", label_style),
Paragraph(c["pearl"], body_style),
]
right_cell = [img, Paragraph("Representative ECG", caption_style)]
row_table = Table([[left_cell, right_cell]], colWidths=[3.9 * inch, 2.7 * inch])
row_table.setStyle(TableStyle([
("VALIGN", (0, 0), (-1, -1), "TOP"),
("LEFTPADDING", (0, 0), (0, 0), 4),
("RIGHTPADDING", (1, 0), (1, 0), 4),
]))
block.append(row_table)
block.append(Spacer(1, 4))
block.append(Paragraph(f"Source: {c['source']}", source_style))
block.append(Spacer(1, 10))
block.append(HRFlowable(width="100%", thickness=0.6, color=colors.HexColor("#cccccc")))
block.append(Spacer(1, 10))
story.append(KeepTogether(block))
# Footer disclaimer on last page
story.append(Spacer(1, 10))
story.append(Paragraph(
"Disclaimer: For educational/quick-reference use only. Always correlate ECG findings with clinical "
"presentation and confirm with a qualified clinician before making diagnostic or treatment decisions.",
ParagraphStyle("Disclaimer", parent=body_style, fontSize=8, textColor=colors.HexColor("#888888"))
))
# ---------- Page template with header/footer ----------
def add_page_decorations(canvas, doc):
canvas.saveState()
canvas.setFont("Helvetica", 8)
canvas.setFillColor(colors.HexColor("#999999"))
canvas.drawString(0.6 * inch, 0.5 * inch, "ECG Quick Reference Guide")
canvas.drawRightString(letter[0] - 0.6 * inch, 0.5 * inch, f"Page {doc.page}")
canvas.restoreState()
doc = SimpleDocTemplate(
OUTPUT, pagesize=letter,
leftMargin=0.6 * inch, rightMargin=0.6 * inch,
topMargin=0.6 * inch, bottomMargin=0.7 * inch,
title="ECG Quick Reference Guide - 10 Common Cardiac Conditions",
author="Orris"
)
doc.build(story, onFirstPage=add_page_decorations, onLaterPages=add_page_decorations)
print("PDF built at", OUTPUT)
cd /tmp/workspace/ecg-guide && python3 build_pdf.py
~/ecg-guide/build_pdf.py
Successfully replaced 1 instance(s) of the string in '/tmp/workspace/ecg-guide/build_pdf.py'
cd /tmp/workspace/ecg-guide && python3 build_pdf.py
cd /tmp/workspace/ecg-guide/output && python3 -c " from pypdf import PdfReader r = PdfReader('ECG_Quick_Reference_Guide.pdf') print('Pages:', len(r.pages)) " && ls -la /tmp/workspace/ecg-guide/output/
ECG Quick Reference Guide
PDF Document · PDF
- Cover page with table of contents
- One dedicated section per condition (10 total), each with:
- Key ECG changes (bulleted)
- A clinical pearl for quick recall
- A representative ECG image
- Source citation