
Prevalence of different thyroid diseases
"thyroid disease" AND prevalence AND epidemiology
prevalence thyroid diseases worldwide epidemiology 2024
https://orca.cardiff.ac.uk/id/eprint/112564/1/Global%20epide…
thyroid diseases prevalence chart diagram epidemiology
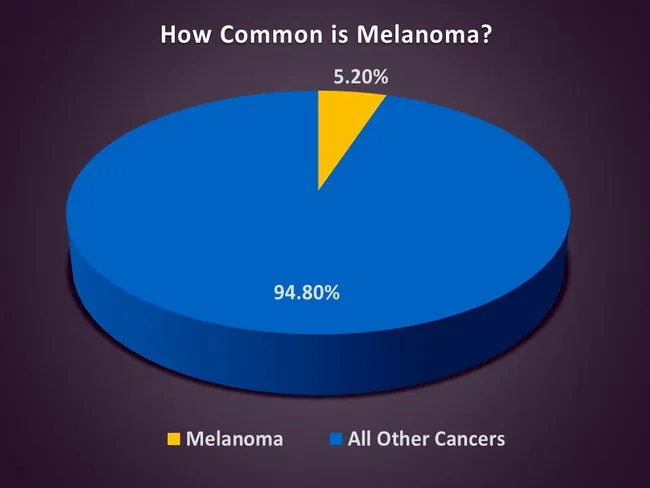
Infographic presenting melanoma prevalence as a population-level epidemiology chart. The image is a pie chart titled How Common is Melanoma?, with melanoma shown in yellow representing 5.20% and all other cancers shown in blue representing 94.80%. It summarizes contemporary United States cancer incidence, focusing on cutaneous melanoma relative burden. The data cited include melanoma’s share of new cancer cases (about five percent) and the 2017 projection of 161,790 new melanoma cases, comprising 74,680 in-situ and 87,110 invasive tumors, derived from National Cancer Institute and American Academy of Dermatology sources. The visualization emphasizes that melanoma, while a minority of total cancers, remains a critical public health concern due to its potential for metastasis, mortality, and survivorship considerations. The image supports dermatology, oncology, and public health education by providing a crisp numeric snapshot suitable for teaching, screening discussions, and patient counseling about risk factors, early detection, and prevention strategies, such as sun protection and skin checks. It is not a diagnostic image but an epidemiologic figure intended to contextualize risk and resource allocation. Clinicians may reference this type of infographic when communicating disease burden, guiding screening programs, or illustrating trends in melanoma incidence across populations and time, for education and research purposes.
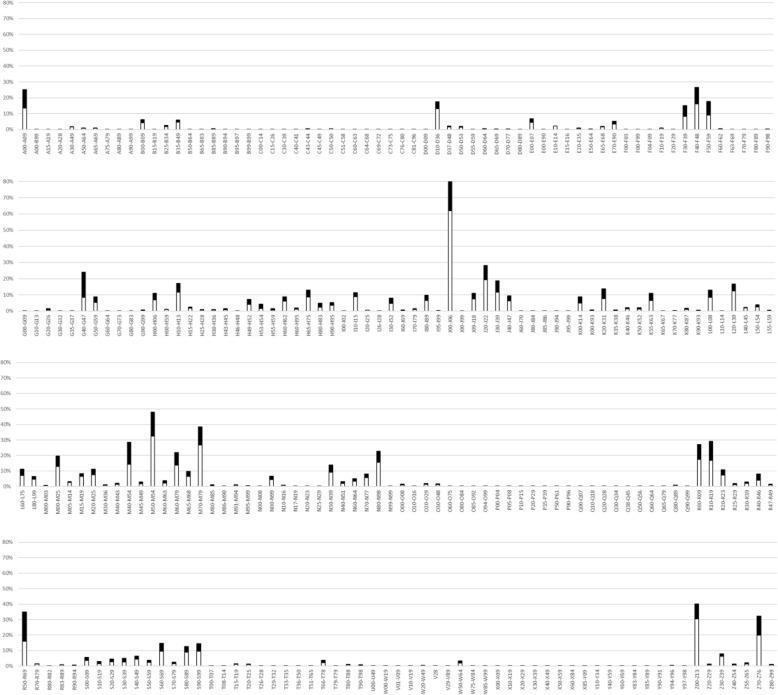
This Comparison Chart illustrates the prevalence of various medical conditions, categorized by ICD-10 blocks, in patients with migraine compared to control subjects. The data is presented in four horizontal panels containing superimposed bar graphs. Black bars represent the migraine cohort, while white bars represent the control group. The y-axis measures prevalence percentage (0% to 80%), and the x-axis lists specific ICD-10 block codes ranging from infectious diseases (A00-A09) to health service encounters (Z70-Z76). The visualization emphasizes multimorbidity patterns, demonstrating that migraine patients consistently exhibit higher prevalence across nearly all diagnostic categories compared to controls. Key educational concepts include the 1.5-fold enrichment of comorbid conditions in migraineurs, with significant differences noted in visual disturbances (H53-H54), neurotic and stress-related disorders (F40-F48), episodic paroxysmal disorders (G40-G47), and musculoskeletal dorsopathies (M40-M54). This chart serves as a comprehensive tool for medical epidemiology and neurology research to understand the systemic health associations and healthcare utilization patterns of migraine patients.
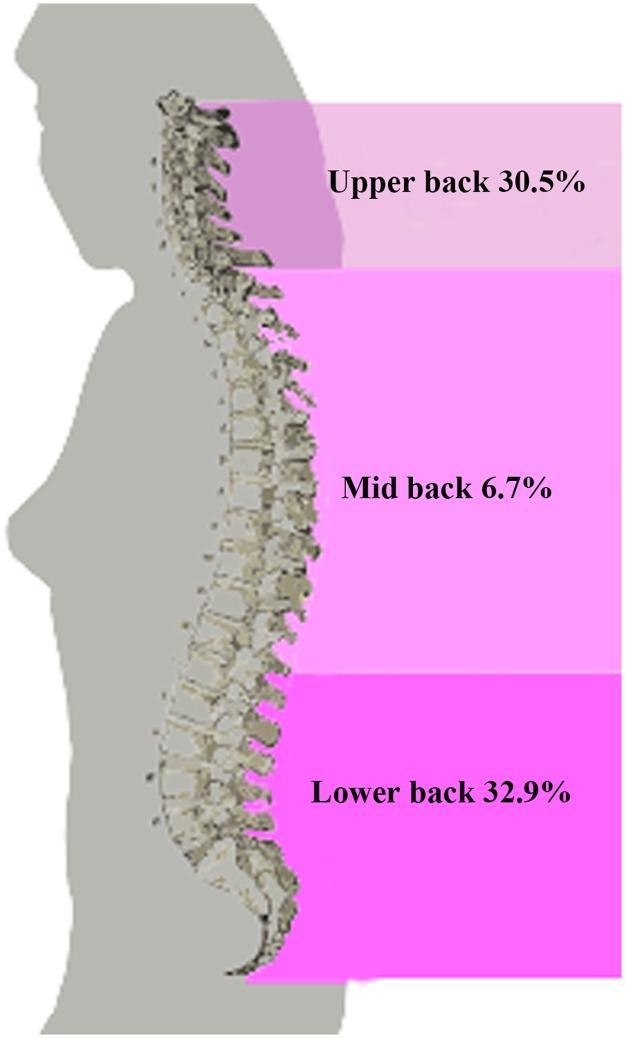
This infographic presents a medical diagram focused on the epidemiology of spinal pain. It features a lateral silhouette of a female human body in gray, with a detailed anatomical rendering of the vertebral column in a sagittal view. The diagram is partitioned into three distinct color-coded horizontal regions overlaid on the back to demonstrate the baseline prevalence of regional back pain. The upper back region, corresponding to the cervical and upper thoracic spine, indicates a prevalence of 30.5%. The mid-back region, covering the middle to lower thoracic vertebrae, shows a significantly lower prevalence of 6.7%. The lower back region, encompassing the lumbar and sacral spine, shows the highest prevalence at 32.9%. The visual educational focus is to illustrate the anatomical distribution and clinical frequency of back pain across the different segments of the spine, highlighting the high incidence of lower back pain (LBP) compared to other spinal regions.
Prevalence of Thyroid Diseases
1. Hypothyroidism
- Affects ~2% of women and <0.1% of men in the general population
- Annual incidence: up to 4 per 1,000 women and 1 per 1,000 men (autoimmune type)
- In iodine-replete populations, ~1-2% overall prevalence; Hashimoto thyroiditis accounts for ~85% of these cases
- Prevalence rises steeply with age; mean age at diagnosis is ~60 years
- In Down syndrome, nearly 25% have thyroid disease, most commonly primary hypothyroidism; in Turner syndrome, prevalence is ~13% but rises further by the third decade
- In pregnancy: overt hypothyroidism in 0.3-0.5% of pregnancies
- Found in 6-8% of women (up to 10% of women over 60) and 3% of men
- Postmenopausal women: prevalence approaches 20%
- Progresses to overt hypothyroidism at ~4-5% per year if TPO antibodies are positive
- In pregnancy: SCH occurs in 3-5% of pregnancies
2. Hyperthyroidism / Thyrotoxicosis
- Prevalence: 0.2-1.3% in iodine-sufficient populations
- Europe/US: approximately 0.5-0.7%
- Australia: slightly lower, ~0.3%
- Iodine-deficient areas: higher, e.g. 2.9% in one Italian iodine-deficient village (mostly toxic nodular goiter in the elderly)
- Meta-analysis of European studies: mean prevalence 0.75%, incidence 51 per 100,000 per year
- In Asia: prevalence ranges from 0.43% to 3.9%
- Overall prevalence ~1.3% in iodine-sufficient populations
- Ethnic variation: Blacks 0.4%, Mexican Americans 0.3%, Whites 0.1%
- In iodine-deficient areas: 6-10% (mainly from toxic nodular goiters)
- Female predominance, with prevalence increasing with age
- Graves disease: 60-90% of all thyrotoxicosis cases
- Thyroiditis: ~10%
- In iodine-deficient areas: thyroidal autonomy (toxic nodular goiter) predominates
3. Autoimmune Thyroid Disease (AITD)
- Overall prevalence: ~5% of the general population
- Thyroid autoantibodies (TPO-Ab or TG-Ab) detected in 10-20% of the general population, even in euthyroid individuals
- Strong female predominance (approximately 5:1 to 10:1, female:male)
- ~50% of adult Turner syndrome patients have anti-TPO or anti-TG autoantibodies
- Most common cause of hyperthyroidism in iodine-sufficient regions (60-90% of thyrotoxicosis)
- About ~50 million prevalent cases of Hashimoto thyroiditis estimated in the major world markets (US, EU4+UK, Japan) in 2024
- Occurs in 5-9% of postpartum women, usually self-limiting
- 20-40% of affected women develop permanent hypothyroidism
- The American Thyroid Association recommends TSH/free T4/TPO screening for women with postpartum depression
4. Goiter (Thyroid Enlargement)
- Endemic goiter: defined when goiter affects >5% of the population in a region; caused by iodine deficiency. This is the most common cause of thyroid disease worldwide when considering all countries.
- Palpable goiter: found in ~15% of persons in an iodine-replete region (Whickham Survey)
- Visible goiter: ~7% in the Whickham Survey
- In iodine-deficient areas: much higher - one study in Pomerania (before iodine supplementation) found goiter in 35.9% of individuals without known thyroid disease
- With high-resolution ultrasound: goiter/thyroid enlargement detected in 19-67% of imaged individuals
- Higher frequencies in women and the elderly
- Iodine supplementation programs have significantly reduced endemic goiter globally
5. Thyroid Nodules
- Palpable thyroid nodules: ~5% of adults (varies considerably worldwide)
- Lifetime risk of developing a thyroid nodule: 5-10% (US Framingham study)
- Ultrasound-detected nodules: found in up to 50% of individuals aged >50 years, reflecting the high prevalence of incidentalomas
- More common in women, the elderly, and iodine-deficient populations
- ~10-15% of nodules biopsied with FNA are found to be malignant
6. Thyroid Cancer
- Accounts for only ~1% of all new malignant diagnoses globally, but incidence is rising (mainly due to increased detection of small papillary cancers)
- Prevalence in nodular thyroid disease: 0.4-1.8% for medullary thyroid cancer; overall malignancy rate in nodules is much higher depending on ultrasound features
| Type | Proportion |
|---|---|
| Papillary thyroid carcinoma (PTC) | ~80% of all thyroid cancers |
| Follicular thyroid carcinoma (FTC) | ~10-20% |
| Medullary thyroid carcinoma (MTC) | ~1.7-5% |
| Anaplastic carcinoma | <1-5% |
| Thyroid lymphoma | Rare |
- PTC is the most common in children as well (~85% of childhood thyroid cancer)
- Incidence of thyroid cancer has been rising globally since the 1990s, primarily due to detection of small (<1 cm) papillary cancers; cancer mortality from advanced-stage disease has also been rising in parallel
Summary Table
| Disease | Prevalence (General Population) | Key Notes |
|---|---|---|
| Overt hypothyroidism | ~2% women, <0.1% men | Hashimoto's in 85%; iodine deficiency worldwide |
| Subclinical hypothyroidism | 6-8% women, 3% men (up to 20% in older women) | Common in postmenopausal women |
| Overt hyperthyroidism | 0.2-1.3% (iodine-sufficient) | Graves disease = 60-90% of cases |
| Subclinical hyperthyroidism | ~1.3% | Up to 6-10% in iodine-deficient areas |
| Autoimmune thyroid disease | ~5% (antibodies in 10-20%) | Strong female predominance |
| Goiter (palpable) | 15% (iodine-replete); much higher iodine-deficient | Ultrasound: 19-67% |
| Thyroid nodules | 5% palpable; up to 50% on ultrasound (>50 yrs) | Lifetime risk 5-10% |
| Thyroid cancer | ~1% of all cancers | PTC = 80%; incidence rising |
| Postpartum thyroiditis | 5-9% of postpartum women | 20-40% develop permanent hypothyroidism |
- Iodine status is the single most important environmental determinant of thyroid disease burden globally.
- In iodine-sufficient countries, autoimmune disease (Hashimoto/Graves) dominates.
- In iodine-deficient regions, endemic goiter and toxic nodular goiter are most prevalent.
- Women are consistently 5-10 times more affected than men across almost all thyroid conditions.
- Subclinical forms of hypo- and hyperthyroidism are far more prevalent than overt disease.
Thyroid swellings and most common age groups
thyroid swellings types age groups most common clinical features
thyroid swelling goiter classification types diagram
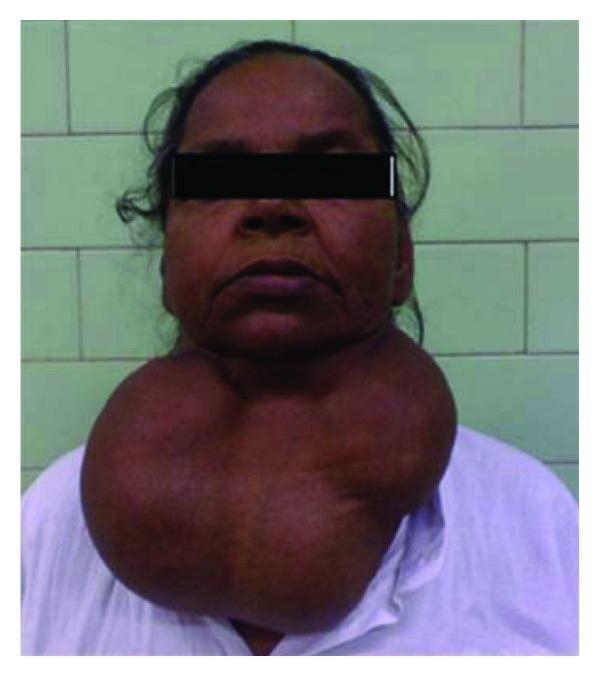
This clinical photograph shows a frontal view of an adult female patient with an exceptionally large multinodular goiter. The thyroid swelling is massive, occupying the entire anterior and lateral aspects of the neck. Anatomically, the mass extends superiorly from the submental region and lower jawline to inferiorly below the level of the sternal notch. The swelling exhibits a distinct lobulated morphology, consistent with a chronic multinodular goiter. The overlying skin appears intact without visible ulceration, significant erythema, or prominent superficial venous distension. The sheer size of the mass relative to the patient's head illustrates significant displacement of local anatomy, which is often associated with obstructive symptoms such as dyspnea or dysphagia. This image serves as a clinical example of severe endocrine pathology and is relevant for studies in endocrinology, general surgery, and anesthesiology regarding airway management and thyroidectomy.
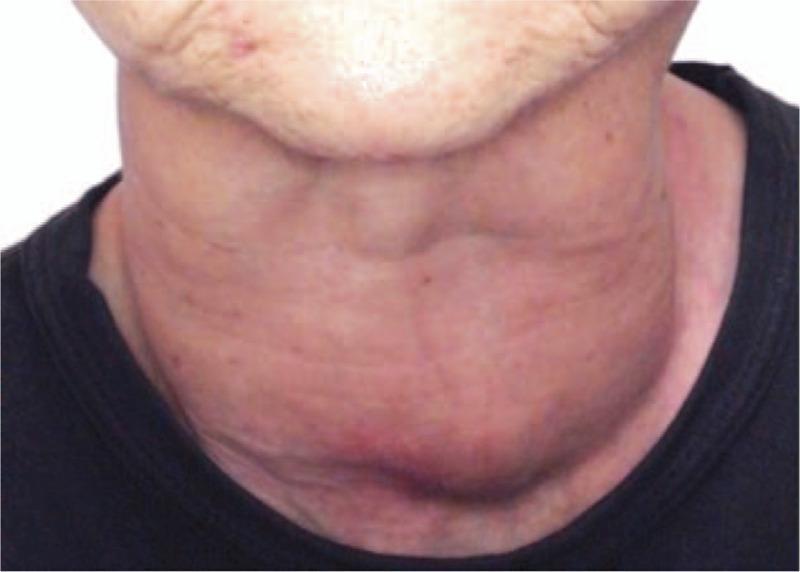
This clinical photograph shows the anterior neck region of a patient with significant, diffuse thyroid gland enlargement, characteristic of a massive goiter. The swelling is centrally located and extends vertically from the submandibular region (lower jawline) down to the suprasternal notch and upper chest. Anatomically, the mass obscures the normal contours of the larynx, trachea, and sternocleidomastoid muscles. The goiter appears lobulated with multiple prominent convexities, particularly on the inferior aspect. The overlying skin is stretched, showing horizontal neck creases and areas of mild erythema, likely due to mechanical pressure and tissue expansion. This visual represents a severe manifestation of thyroid disease, such as Graves' disease or multinodular goiter, illustrating the significant anatomical distortion of the neck structures and its clinical relevance in endocrinology and surgical evaluation.
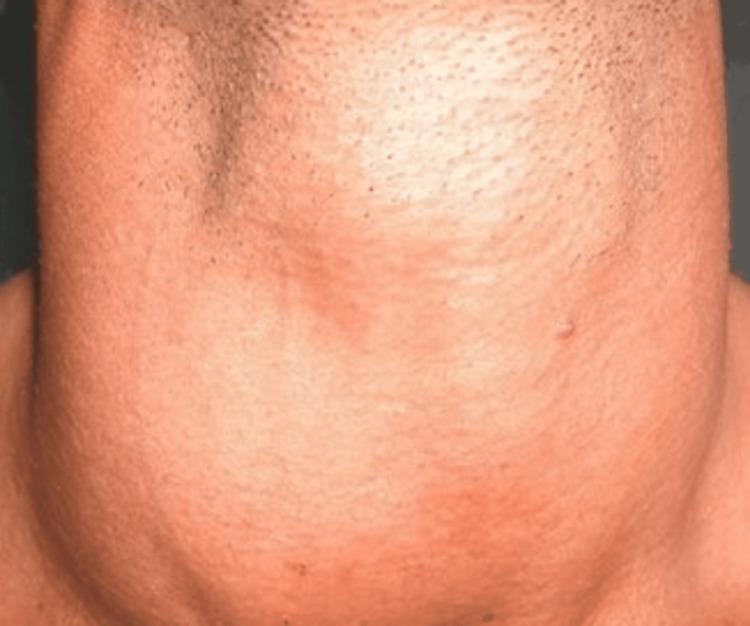
This clinical photograph displays a frontal view of a patient's neck, illustrating a significant and diffuse enlargement of the thyroid gland, clinically referred to as a goiter. The swelling is symmetrical and uniform, extending across the anterior neck and obscuring the typical anatomical contours of the trachea and sternocleidomastoid muscles. The surface of the skin over the mass appears smooth and intact, without visible discrete nodules or localized masses, which is characteristic of diffuse thyroid hyperplasia often seen in Graves' disease. The skin overlying the enlargement exhibits a slight erythematous (reddened) appearance, likely due to increased vascularity or stretching of the integument over the underlying hypertrophied tissue. This visual presentation is a classic physical examination finding in endocrinology for evaluating autoimmune thyroid disorders and thyroid-related mass effects.
Thyroid Swellings - Classification and Most Common Age Groups
- Morphology - diffuse vs. nodular
- Functional state - toxic (hyperthyroid), nontoxic (euthyroid), or hypothyroid
- Cause - inflammatory, autoimmune, neoplastic, physiological, or iodine-related
- Number of nodules - solitary vs. multinodular
1. Simple/Physiological Diffuse Goiter
- Age: Adolescents and young adults (10-25 years), especially at puberty and during pregnancy
- Female predominance
- Caused by transient increased thyroid hormone demand during rapid growth, puberty, or pregnancy
- Typically euthyroid; often regresses spontaneously
- Referred to as "juvenile goiter" in teenagers
2. Endemic Goiter (Diffuse, Iodine-Deficient)
- Age: All age groups, but incidence increases with age due to cumulative environmental exposure
- Female predominance (2-3x higher than males)
- Affects populations in iodine-deficient regions (mountainous areas, inland territories)
- In severely iodine-deficient areas, a palpable goiter can be found in 40-90% of individuals
- Over 2 billion people worldwide are exposed to iodine-deficient diets
3. Sporadic Multinodular Goiter (MNG / Nontoxic)
- Age: Middle-aged and older adults (40-60+ years); incidence increases with age
- Most common cause of nontoxic goiter in iodine-rich countries (~5% incidence)
- Strong female predominance
- Cause largely unknown in iodine-sufficient populations
- The incidence parallels the age-related rise in thyroid nodules generally
- Clinically: anterior neck mass, often bilateral, may cause compressive symptoms (dysphagia, hoarseness, stridor) as it grows
4. Toxic Multinodular Goiter (Plummer Disease)
- Age: Adults over 50 years, especially in iodine-deficient regions
- Most common cause of hyperthyroidism in the elderly and in iodine-deficient populations (second most common overall in the US after Graves' disease)
- Female predominance (~5:1 female:male ratio)
- Constitutively activating TSH receptor mutations in autonomous nodules
5. Graves' Disease (Diffuse Toxic Goiter)
- Age: Young adults, 20-40 years (peak onset); can occur in children and elderly too
- Female predominance: 7-8:1 female:male ratio - the most female-dominant of all thyroid diseases
- Most common cause of hyperthyroidism in iodine-sufficient countries (60-90% of thyrotoxicosis)
- Presents with diffuse, smooth, firm goiter + features of hyperthyroidism + exophthalmos (in ~25-30%)
- Incidence: ~30 cases per 100,000 persons per year
6. Hashimoto Thyroiditis (Chronic Autoimmune Thyroiditis)
- Age: 30-50 years most commonly; can also occur in children and teenagers (most common thyroid disease in pediatric age group, typically >10 years)
- Female predominance (4-10:1)
- Causes a firm, diffuse, non-tender goiter initially; gland atrophies over time
- In children: strong female predominance (87.7%), most >10 years and pubertal at diagnosis; neck swelling present in ~23%
- Most common cause of hypothyroidism in iodine-replete populations
7. Subacute (De Quervain) Thyroiditis
- Age: 30-50 years, but can occur at any age
- Follows a viral upper respiratory tract infection
- Female predominance (~4:1)
- Presents with painful, tender, firm goiter + fever + raised ESR
- Usually self-limiting; ~10% develop permanent hypothyroidism
8. Solitary Toxic Adenoma
- Age: Median 50-60 years; female predominance (mild)
- A single autonomously functioning "hot" nodule
- Less common than MNG or Graves'; rarely malignant
9. Thyroid Cancer (Malignant Swelling)
| Thyroid Cancer Type | Proportion | Typical Age at Presentation | Key Notes |
|---|---|---|---|
| Papillary carcinoma | ~80% | 20-40 years (mean ~35 yrs); most common in children | Slow-growing; best prognosis; most common in young women |
| Follicular carcinoma | ~10-20% | 40-60 years (mean ~50 yrs); F:M = 3:1 | More aggressive than papillary; hematogenous spread |
| Medullary carcinoma (MTC) | ~5% | Middle-age; sporadic or familial (MEN2A/2B) | Arises from C cells; calcitonin marker |
| Anaplastic carcinoma | <5% | >65 years (elderly) | Most aggressive; rapid growth; poor prognosis |
| Thyroid lymphoma | Rare | Elderly women; often Hashimoto's background |
- Overall thyroid cancer: most common in ages 35-39 or >70 (UK data)
- Women are 2-3x more likely to develop thyroid cancer than men
- In children, papillary carcinoma accounts for ~85% of thyroid cancers
10. Substernal Goiter
- Age: >60 years predominates (60% of cases occur in patients over 60)
- A goiter extending inferiorly into the mediastinum through the thoracic inlet
- Incidence: ~0.02% general population
- May present with compressive symptoms - SVC syndrome, tracheal deviation, stridor
- Almost always an extension of a long-standing cervical goiter
Summary Table: Thyroid Swellings by Age Group
| Age Group | Most Common Thyroid Swelling |
|---|---|
| Children / Adolescents (<18 yrs) | Hashimoto thyroiditis (>10 yrs); physiological/juvenile goiter; papillary carcinoma (rare) |
| Young Adults (20-40 yrs) | Graves' disease (diffuse toxic goiter); papillary thyroid carcinoma; Hashimoto thyroiditis |
| Middle Age (40-60 yrs) | Multinodular goiter; follicular carcinoma; Hashimoto; toxic adenoma; subacute thyroiditis |
| Elderly (>60 yrs) | Toxic multinodular goiter; substernal goiter; anaplastic carcinoma; thyroid lymphoma |
- The 3rd and 4th decades (21-40 years) see the overall highest frequency of thyroid swellings presenting clinically, with females accounting for the large majority (F:M ratios range from 2.8:1 to 10:1 depending on the series)
- 82% of thyroid swellings are euthyroid at presentation (colloid nodule and MNG being most common on ultrasound)
- Colloid nodule is the most common benign finding on imaging; papillary carcinoma is the most common malignant cause
- Any rapidly growing thyroid mass in an elderly patient should raise suspicion for anaplastic carcinoma or lymphoma
Normal thyroid profile ranges
normal thyroid function test reference ranges TSH free T4 free T3 2024
Normal Thyroid Profile Reference Ranges
Important note: Exact reference ranges are assay-specific and laboratory-specific. The values below represent the most widely cited ranges from authoritative sources. Always interpret results against your own laboratory's reference interval.
1. TSH (Thyroid-Stimulating Hormone) - The Master Screening Test
| Population | Normal Range |
|---|---|
| Adults (general) | 0.35 - 5.0 mIU/L (most labs) |
| Adults (commonly reported) | 0.4 - 4.5 mIU/L (Goldman-Cecil Medicine) |
| Adults (Schwartz's Surgery) | 0.5 - 5.0 µU/mL |
| Adults (ATA 2004 expert panel) | 0.4 - 4.5 mIU/mL |
| Elderly (>70 years) | Upper limit may extend to ~6.0 mIU/L (physiological shift with age) |
| Pregnancy - General | 0.1 - 3.9 mIU/L (modified general range) |
| Pregnancy - 1st trimester | 0.1 - 2.5 mIU/L (target TSH goal <2.5 on LT4 therapy) |
| Pregnancy - 2nd trimester | 0.2 - 3.0 mIU/L |
| Pregnancy - 3rd trimester | 0.3 - 3.0 mIU/L |
- Inverse log-linear relationship with free T4 - small changes in T4 cause large shifts in TSH, making it the most sensitive screening test
- Third-generation assays can detect down to 0.005 mIU/L
- TSH <0.1 mIU/L = subclinical hyperthyroidism territory
- TSH <0.01 mIU/L = frank Graves' thyrotoxicosis
- TSH 4-10 mIU/L = subclinical hypothyroidism range
- TSH >10 mIU/L = overt hypothyroidism (symptomatic)
- Suppressed by: glucocorticoids, dopamine, octreotide, severe illness
2. Free T4 (fT4 / Free Thyroxine) - Primary Hormone Assessment
| Reference | Normal Range (SI units) | Normal Range (conventional) |
|---|---|---|
| Schwartz's Principles of Surgery | 12-28 pmol/L | - |
| Textbook of Family Medicine | - | 0.7-2.5 ng/dL |
| LabCorp (US) | - | 0.82-1.77 ng/dL |
| Quest Diagnostics (US) | - | 0.8-1.8 ng/dL |
| NHS (UK) | 8.0-18.0 pmol/L (updated 2024) | - |
- Only the free (unbound) fraction is biologically active (~0.03% of total T4)
- More reliable than total T4 in settings of altered protein binding (pregnancy, estrogen therapy, liver disease, nephrotic syndrome)
- Low fT4 + high TSH = overt primary hypothyroidism
- High fT4 + low TSH = overt hyperthyroidism
- Normal fT4 + high TSH = subclinical hypothyroidism
- Normal fT4 + low TSH = subclinical hyperthyroidism
3. Free T3 (fT3 / Free Triiodothyronine) - Most Biologically Active Hormone
| Reference | Normal Range (SI units) | Normal Range (conventional) |
|---|---|---|
| Schwartz's Principles of Surgery | 3-9 pmol/L | - |
| Textbook of Family Medicine | - | 0.2-0.5 ng/dL |
| Quest Diagnostics / LabCorp | - | 2.0-4.4 pg/mL |
| NHS (UK, adult) | 3.1-6.8 pmol/L | - |
- Most potent thyroid hormone (3-4x more active than T4)
- ~80% of T3 is produced by peripheral conversion from T4 (liver, kidneys)
- Free T3 measurement is technically challenging (very low concentrations)
- Most useful in T3 thyrotoxicosis: TSH suppressed, fT4 normal, fT3 elevated
- Also rises early in hyperthyroidism before total T4 becomes abnormal
4. Total T4 (Thyroxine)
| Reference | Normal Range |
|---|---|
| Schwartz's Principles of Surgery | 55-150 nmol/L |
| Henry's Clinical Diagnosis | - |
| US labs (conventional) | 4.5-12.0 µg/dL |
5. Total T3 (Triiodothyronine)
| Reference | Normal Range |
|---|---|
| Schwartz's Principles of Surgery | 1.5-3.5 nmol/L |
| Henry's Clinical Diagnosis | 60-160 ng/dL (µg/dL) (= 0.9-2.46 nmol/L) |
| US labs (conventional) | 79-165 ng/dL |
6. T3 Resin Uptake (T3-RU) and Free Thyroxine Index (FTI)
| Test | Normal Range |
|---|---|
| T3 Uptake (T3-UP) | 24-39% (LabCorp); 22-35% (Quest) |
| Free Thyroxine Index (FTI / T7) | 1.2-4.9 (LabCorp); 1.4-3.8 (Quest) |
7. Radioactive Iodine Uptake (RAIU)
| Test | Normal Range |
|---|---|
| 24-hour RAIU | 8-30% |
- Elevated in Graves' disease and iodine deficiency
- Low/absent in thyroiditis, factitious thyrotoxicosis, excess iodine
- Not a routine screening test; used primarily in hyperthyroid workup
8. Thyroid Antibodies
| Antibody | Normal (Negative) | Significance if Positive |
|---|---|---|
| Anti-TPO (anti-thyroid peroxidase) | <35 IU/mL (varies by lab) | Hashimoto's thyroiditis; Graves' disease |
| Anti-thyroglobulin (anti-TG) | <20 IU/mL (varies by lab) | Hashimoto's thyroiditis |
| TSH receptor antibody (TRAb/TSI) | Negative | Highly specific for Graves' disease |
| Thyroid-stimulating immunoglobulin (TSI) | <140% of baseline | Diagnostic for Graves' disease |
- Anti-TPO antibodies found in 10-20% of general population (even in euthyroid individuals)
- Positive anti-TPO in subclinical hypothyroidism = ~5% annual risk of progression to overt hypothyroidism
- Calcitonin is a marker for medullary thyroid cancer (normal: <10 pg/mL in most labs)
- Thyroglobulin (Tg): used as tumor marker post-thyroidectomy for differentiated thyroid cancer (should be undetectable after total thyroidectomy)
9. Age- and Condition-Specific Variations
| Special Condition | Key Adjustment |
|---|---|
| Neonates (0-6 days) | TSH 0.7-15.2 mIU/L; fT4 11-32 pmol/L (transiently high) |
| Infants (7-14 days) | TSH 0.72-11.0 mIU/L; fT4 11.5-28.3 pmol/L |
| Children (15 days-16 yrs) | TSH 0.27-4.2 mIU/L; fT4 12-22 pmol/L |
| Elderly (>70 yrs) | TSH upper limit may reach 6.0 mIU/L (normal aging) |
| Pregnancy (1st trimester) | TSH lower due to hCG cross-stimulation of TSH receptor |
| Critically ill (non-thyroidal illness) | TSH unreliable unless <0.1 or >20 mIU/L |
| Biotin supplements | Can falsely elevate fT4 / falsely lower TSH; stop biotin 3-5 days before testing |
| Amiodarone, lithium | Can alter thyroid function - interpret tests carefully |
Quick Interpretation Summary
| TSH | Free T4 | Interpretation |
|---|---|---|
| Normal | Normal | Euthyroid |
| High | Low | Overt primary hypothyroidism |
| High | Normal | Subclinical hypothyroidism |
| Low | High | Overt hyperthyroidism |
| Low | Normal | Subclinical hyperthyroidism |
| Low | Low | Secondary (pituitary) hypothyroidism |
| Normal | High | TSH-secreting pituitary adenoma / thyroid hormone resistance |