
thalassemia major peripheral blood smear microcytic anemia
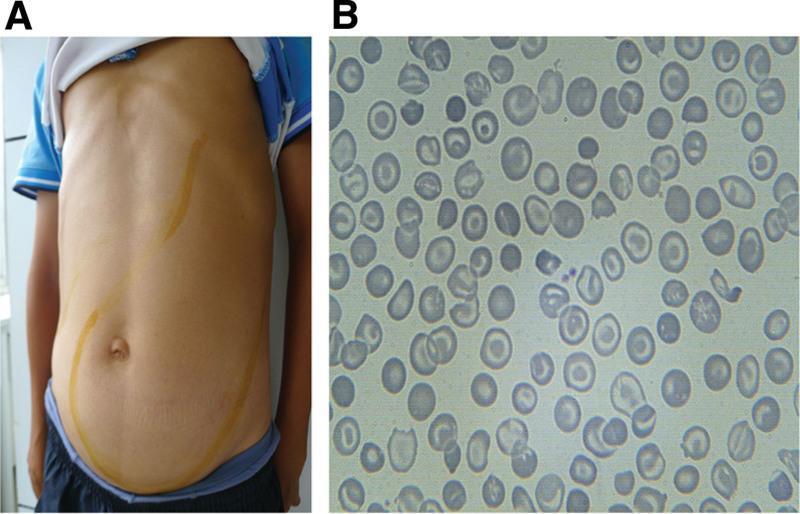
This composite educational image illustrates the clinical signs and laboratory findings of thalassemia intermedia. Panel A is a clinical photograph of a patient's torso showing massive abdominal distention. Yellow skin markings delineate the margins of significant hepatomegaly and massive splenomegaly, with the spleen extending from the left upper quadrant across the midline and deep into the pelvic region, occupying nearly the entire abdominal cavity. Panel B is a peripheral blood smear (light microscopy) demonstrating classic hematological abnormalities associated with thalassemia. The red blood cells exhibit marked microcytosis (small size) and hypochromia (central pallor), along with numerous target cells (codocytes) and irregularly contracted cells (schistocytes). These findings collectively highlight the physical manifestations of extramedullary hematopoiesis and chronic hemolytic anemia characteristic of advanced hemoglobinopathies.
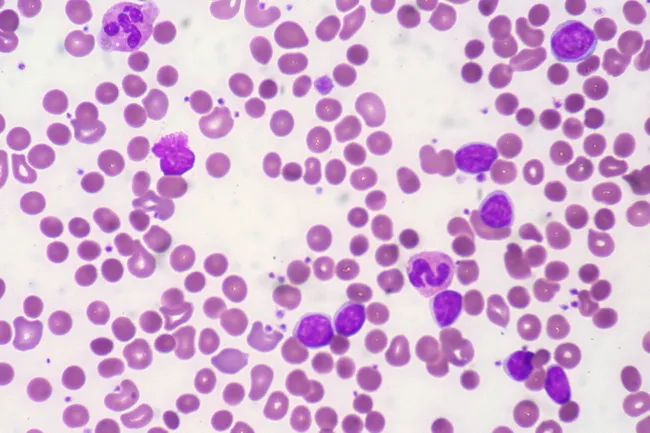
Peripheral blood smear from a patient with known chronic lymphocytic leukemia (CLL) showing autoimmune hemolytic anemia (AIHA). Brightfield microscopy of Wright-Giemsa stained smear at 1000x (oil immersion) reveals two dominant cell populations: numerous small mature lymphocytes typical of CLL and red blood cells showing spherocytic deformation. A smudge cell is evident just left of center, a classical clue for CLL. Red cells display reduced central pallor consistent with spherocytes, indicating intravascular or extravascular hemolysis driven by autoantibodies. The background shows mild polychromasia and rare nucleated RBCs, consistent with a robust reticulocyte response; the corrected reticulocyte count in this case is markedly elevated (>7%). Platelets are not significantly abnormal. These features collectively support autoimmune destruction of erythrocytes in the setting of CLL. Diagnostic significance lies in recognizing AIHA as a common autoimmune complication in CLL, with a clinical picture of sudden Hb decline and compensatory erythropoiesis. Differential considerations include drug-induced hemolysis, other causes of hemolytic anemia, or marrow infiltration by CLL. Clinical correlation includes therapy implications (steroids, rituximab) and close monitoring of hemolysis markers. This image is a valuable teaching resource for hematology morphology, AIHA in CLL, and differential diagnosis in anemia.
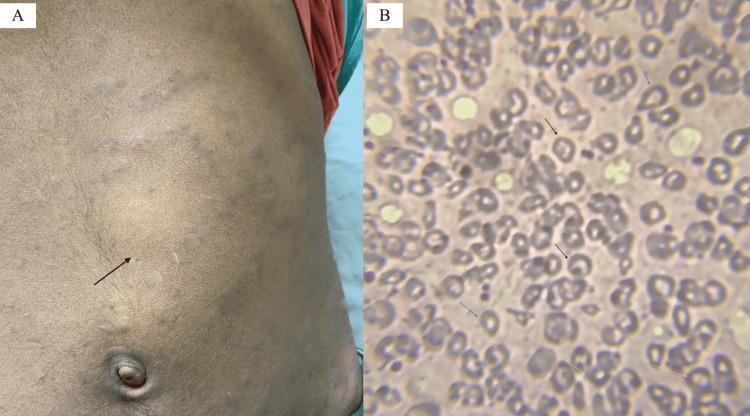
Educational medical image panel consisting of a clinical photograph and a diagnostic pathology image illustrating physical and hematological findings of a hemoglobinopathy such as Hb E/beta-thalassemia. Panel A is a clinical photograph of a patient's abdomen showing a prominent bulge in the left upper quadrant and mid-abdomen, with a black arrow indicating the anterior notch of a massively enlarged spleen (splenomegaly). The overlying skin shows subtle striae or discoloration. Panel B is a peripheral blood smear (Leishman stain, 200x) showing significant red blood cell (RBC) dysmorphology. Key findings include target cells (codocytes) marked by black arrows, teardrop cells (dacrocytes) marked by blue arrows, and basophilic stippling within microcytic, hypochromic RBCs marked by yellow arrows. These visual markers are classic indicators of disordered erythropoiesis and hemoglobin synthesis abnormalities, providing a diagnostic bridge between clinical examination (splenomegaly) and laboratory hematopathology.
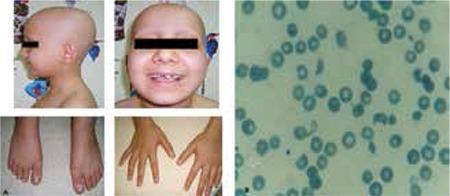
This composite image consists of clinical photographs and a diagnostic peripheral blood smear. Figure 1a (left) shows a pediatric patient with clinical signs including total alopecia (complete absence of scalp hair) and nail pitting affecting both hands and feet, characterized by small punctate depressions on the nail plates. Figure 1b (right) is a microscopic view of a peripheral blood smear demonstrating microangiopathic hemolytic anemia. Visible are numerous schistocytes—fragmented, irregular red blood cells including helmet cells and triangular forms—alongside some normal erythrocytes showing central pallor. The educational focus is on the multi-systemic manifestations of a medical condition, likely a microangiopathic process such as Hemolytic Uremic Syndrome (HUS) or similar systemic pathology, illustrating the correlation between dermatological signs (hair and nail changes) and hematological abnormalities (hemolysis and schistocytosis).
Hematology Chart No. 3 - Full Analysis
1) Diagnosis: Beta-Thalassemia Major (Cooley's Anemia)
How Every Finding Points to Beta-Thalassemia Major
Clinical Features (the "tip-offs")
| Feature | Significance in Beta-Thal Major |
|---|---|
| Age 4 years | Classic presentation age - symptoms emerge after fetal Hb (HbF) declines at 6-12 months |
| Anemia | Severe; due to ineffective erythropoiesis + hemolysis of microcytic, hypochromic RBCs |
| Jaundice | Hemolytic (unconjugated) - from RBC destruction |
| Hepatosplenomegaly | Extramedullary hematopoiesis + RBC sequestration in spleen |
| Frontal bossing | Marrow expansion into the calvarium due to intense erythroid hyperplasia |
Hematological Findings
| Parameter | Value | Interpretation |
|---|---|---|
| Hb | 7 g/dl | Severe anemia (normal >11 g/dl in children) |
| MCV | 61 fl | Microcytic (normal 82-96 fl, as noted on the chart) |
| RDW | 22% | Elevated - indicates anisocytosis (variation in RBC size); normal 11.5-14.5% |
| TLC | 25,000/cumm | Leukocytosis - reactive, due to bone marrow stimulation |
| DC | N40%, L45% | Lymphocytosis - common in children with chronic hemolytic states |
| Reticulocyte count | 10% | Markedly elevated (normal 0.5-2%) - indicates active compensatory erythropoiesis = hemolytic/regenerative anemia |
Biochemical Findings (Classic Hemolytic Pattern)
| Parameter | Value | Interpretation |
|---|---|---|
| Serum bilirubin | 7 mg/dl | Elevated (N: 0.2-1 mg/dl) |
| Unconjugated bilirubin | 6.5 mg/dl | Disproportionately elevated - from intravascular/extravascular hemolysis of RBCs |
| Conjugated bilirubin | 0.5 mg/dl | Minimally elevated - liver conjugation intact |
| Urine urobilinogen | Positive | Increased from excess bilirubin metabolism |
Pathophysiology (Why Beta-Thal Causes All This)
- Excess unpaired alpha chains precipitate inside RBC precursors → destroy them in the marrow (ineffective erythropoiesis) and in circulation (hemolysis)
- Microcytic, hypochromic RBCs with high RDW from marked anisocytosis and poikilocytosis
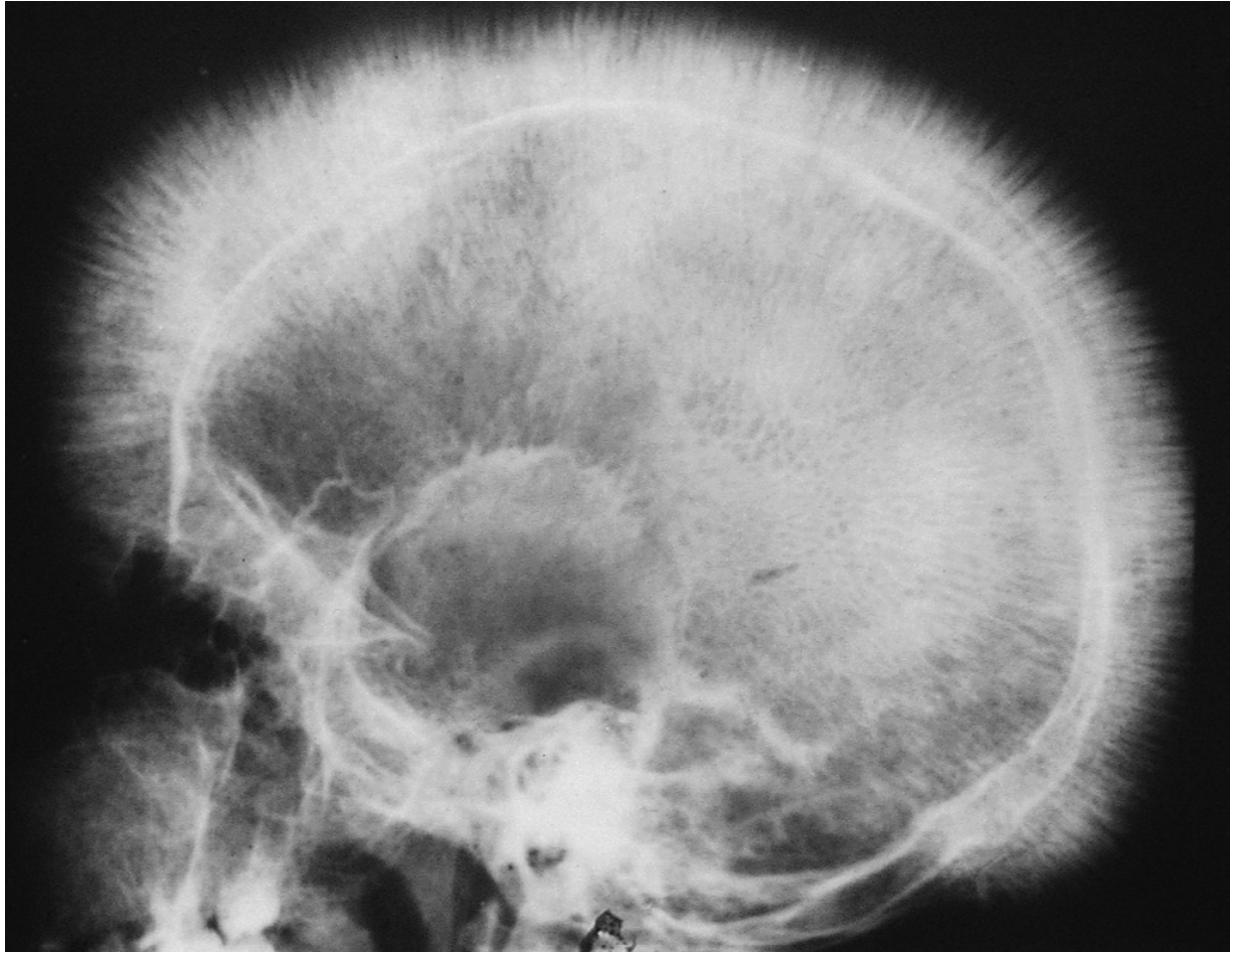
- Erythroid hyperplasia in the marrow → expands into bones (frontal bossing, "hair-on-end" skull X-ray) and extramedullary sites (hepatosplenomegaly)
- High reticulocyte count reflects the bone marrow's futile compensatory effort
2) Confirmatory Tests
Tier 1 - Essential/Diagnostic
| Test | Expected Finding in Beta-Thal Major |
|---|---|
| Hemoglobin Electrophoresis (gold standard) | HbF markedly elevated (>90%), HbA absent or severely reduced, HbA2 elevated (>3.5%) |
| Peripheral Blood Smear | Microcytes, hypochromic RBCs, target cells (codocytes), basophilic stippling, nucleated RBCs, Howell-Jolly bodies |
| HPLC (High Performance Liquid Chromatography) | Quantifies each hemoglobin fraction precisely - now preferred over electrophoresis |
Tier 2 - Supporting/Staging
| Test | Purpose |
|---|---|
| Serum iron + TIBC + ferritin | Distinguish from iron deficiency anemia (which also causes microcytic anemia); in thal major, iron is normal/elevated |
| Osmotic fragility test | Decreased fragility (RBCs are resistant to osmotic lysis - opposite of hereditary spherocytosis) |
| Bone marrow examination | Shows marked erythroid hyperplasia; storage cells with hemosiderin |
| Skull/skeletal X-ray | "Hair-on-end" pattern due to marrow expansion in diploic space |
| LDH + haptoglobin | LDH elevated, haptoglobin low - confirms hemolysis |
| Coombs (DAT) test | Negative - important to rule out autoimmune hemolytic anemia |
Tier 3 - Molecular/Genetic
| Test | Purpose |
|---|---|
| Molecular genetic testing (PCR/gene sequencing) | Identifies specific beta-globin mutations (β⁰/β⁺); important for genetic counseling and prenatal diagnosis |
| Parental CBC + Hb electrophoresis | Both parents will show beta-thalassemia minor (elevated HbA2 >3.5%, mild microcytosis) |
Summary Table: Why Thal Major and NOT Iron Deficiency
| Feature | Beta-Thal Major | Iron Deficiency Anemia |
|---|---|---|
| MCV | Low (61) | Low |
| RDW | High (22%) | High |
| Reticulocyte count | High (10%) | Low/Normal |
| Serum bilirubin | Elevated (unconjugated) | Normal |
| Hepatosplenomegaly | Present | Absent |
| Frontal bossing | Present | Absent |
| HbF on electrophoresis | Markedly elevated | Normal |
| Serum iron | Normal/High | Low |
| Coombs test | Negative | Negative |
- Robbins, Cotran & Kumar Pathologic Basis of Disease, p. 602-605
- Robbins & Kumar Basic Pathology, p. 1767-1776Quick Answer: This is Aplastic Anemia. The triad of pancytopenia (Hb 4.3, TLC 3300, platelets 34,000) with a dry tap on bone marrow aspiration is the hallmark. The peripheral smear showing normocytic normochromic RBCs (not megaloblastic, not microcytic) with reduced WBCs and platelets, combined with the clinical picture of fatigue + frequent infections + bruising (= anemia + neutropenia + thrombocytopenia), points directly to aplastic anemia.
aplastic anemia bone marrow biopsy hypocellular dry tap
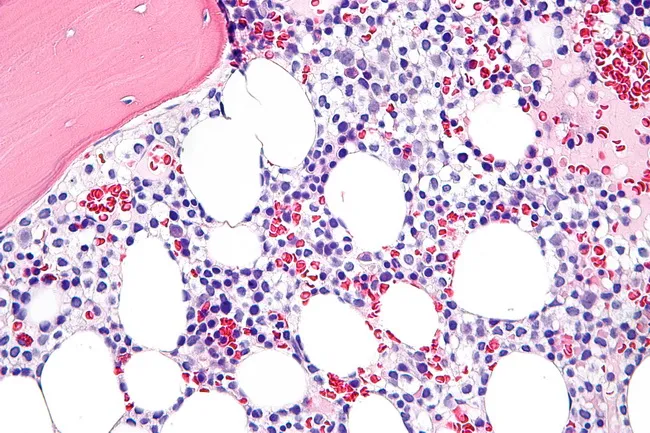
Histopathology: Bone marrow biopsy prepared for light microscopy shows diffuse infiltration by hairy cells rather than well-formed nodules. The marrow is often hypercellular in established disease but can be hypocellular in early stages, mimicking aplastic anemia. Hairy cells appear monotonous with oval nuclei and abundant clear cytoplasm that yields a characteristic fried egg morphology on H&E sections. In some cases, hair-like cytoplasmic projections (hairy indentations) are accentuated with specialized staining such as DBA.44 immunostain, supporting a hairy cell leukemia (HCL) diagnosis. The tumor cells may display spindled forms; the immunophenotype typically includes DBA.44 positivity, and cells may express CD11c, CD25, and CD103 on broader panels. Normal hematopoietic elements, particularly myeloid precursors, are reduced and can show dysplastic changes reminiscent of myelodysplastic syndrome. Plasma cells and mast cells may be mildly increased. Significant reticulin fibrosis is common, contributing to difficult marrow aspirates and making core biopsy essential to determine the extent of marrow replacement. Although marrow evaluation is informative, many cases of HCL can be diagnosed from peripheral blood smear and immunophenotyping alone; however, the biopsy provides baseline disease burden and a reference for assessing therapeutic response and fibrosis progression. This image exemplifies classic HCL marrow involvement with fried egg cells and conspicuous reticulin fibrosis.
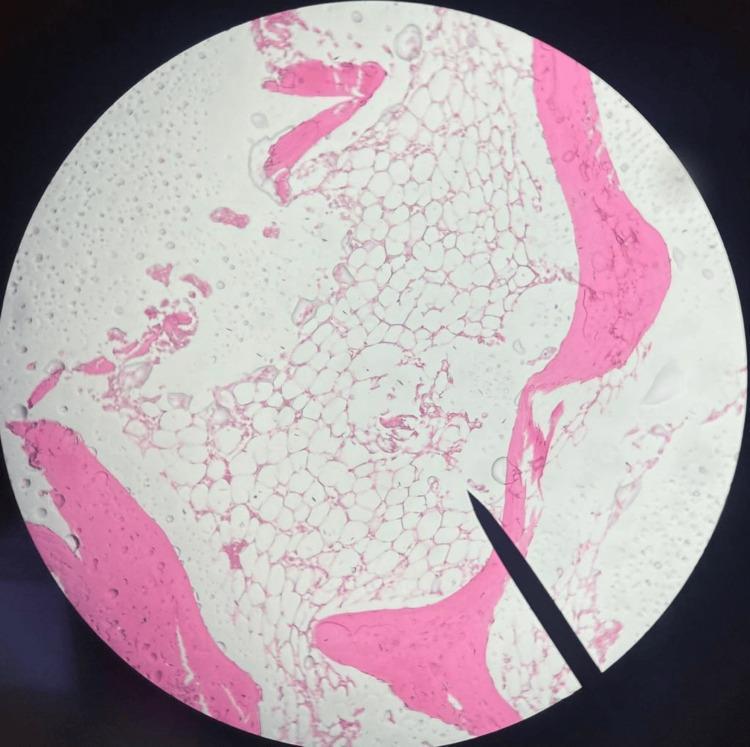
This diagnostic image is a low-magnification light microscopy photomicrograph of a bone marrow trephine biopsy, likely stained with hematoxylin and eosin (H&E). The specimen exhibits marked hypocellularity, a hallmark of severe aplastic anemia. The hematopoietic space is predominantly occupied by clear, vacuolated adipocytes (fatty marrow), with a notable absence of normal myeloid, erythroid, and megakaryocytic cell lines. Eosinophilic (pink) trabecular bone spicules are visible at the periphery and interspersed within the marrow cavity, providing structural context. The clinical significance of this finding is the demonstration of bone marrow failure, where the functional marrow has been replaced by adipose tissue. The absence of infiltrative abnormal cells or significant fibrosis is a key negative finding for differentiating this from myelodysplastic syndromes or myelofibrosis.
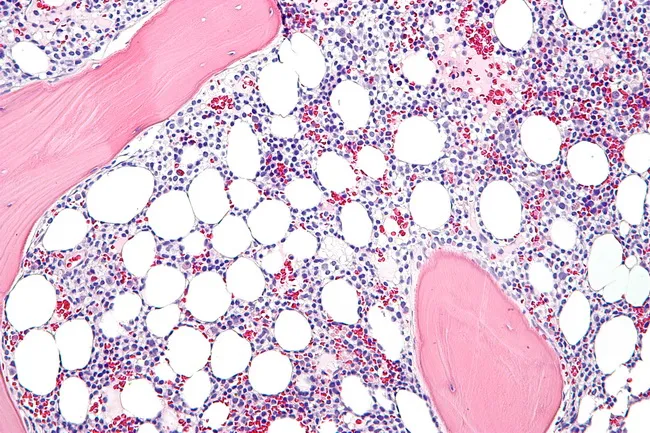
Light microscopy of a bone marrow biopsy from hairy cell leukemia (HCL) shows diffuse infiltration by small to medium lymphoid cells with abundant clear cytoplasm and oval, occasionally reniform nuclei; the cytoplasm creates a fried egg appearance. Hairy projections may be highlighted by immunostaining and by DBA.44 positivity, along with CD11c, CD25, and CD103 markers. The marrow is commonly hypercellular in established disease, whereas early involvement may be hypocellular and mimic aplastic anemia. Prominent reticulin fibrosis is typical and can hinder aspirate yield, making core biopsy essential for assessing infiltration and baseline disease burden. Normal hematopoietic elements, especially the myeloid lineage, are reduced and may display dysplastic changes resembling myelodysplastic syndrome. Plasma cells and mast cells may be mildly increased. In some cases, hairy cells assume a spindle-shaped morphology. The neoplastic cells are typically monotonous with minimal prominent nucleoli, and cytoplasm may exhibit cytoplasmic processes. Unlike several small B-cell lymphomas, discrete cellular aggregates are uncommon, with diffuse replacement predominating. Immunohistochemistry and flow cytometry confirm the diagnosis via characteristic immunophenotype. Clinically, marrow involvement informs staging, prognosis, and treatment planning, though peripheral blood smear and immunophenotypic profiling often suffice for diagnosis. This image, captured at high magnification on a hematoxylin and eosin stained section, showcases classic hairy cell features.
Hematology Chart No. 5 - Full Analysis
1) Diagnosis: Aplastic Anemia
How Every Finding Points to Aplastic Anemia
Clinical Triad (the "3 deficiencies")
| Symptom | Cause | Cell Line Affected |
|---|---|---|
| Fatigue & weakness | Severe anemia (Hb 4.3) | Erythroid failure |
| Frequent infections | Neutropenia (N only 28% of TLC 3300 = ~924/cumm; normal >1500) | Myeloid failure |
| Bruising | Thrombocytopenia (platelets 34,000; normal >150,000) | Megakaryocytic failure |
Hematological Findings Decoded
| Parameter | Value | Significance |
|---|---|---|
| Hb | 4.3 g/dl | Severely low - but per smear, RBCs are normocytic normochromic |
| TLC | 3,300/cumm | Leukopenia (normal 4,000-11,000) |
| DC | N-28%, L-70% | Absolute neutropenia with relative lymphocytosis - lymphocytes are spared because they are long-lived and not produced by the failing marrow |
| Platelets | 34,000/cumm | Severe thrombocytopenia (normal 150,000-400,000) |
Peripheral Smear
- Normocytic normochromic RBCs - the remaining RBCs are morphologically normal (aplastic anemia does NOT cause abnormal RBC shape or size; the marrow simply stops making them)
- Occasional macrocytosis - stress erythropoiesis produces some larger cells
- WBCs and platelets reduced - confirms pancytopenia
The Clincher: "Dry Tap" on Bone Marrow Aspiration
2) Etiological Factors
A. Acquired (Most Common ~65% idiopathic)
| Category | Specific Agents |
|---|---|
| Idiopathic (~65%) | No identifiable cause; presumed autoimmune (activated Th1 cells produce IFN-γ that kills stem cells) |
| Drugs - Dose-dependent | Alkylating agents (cyclophosphamide), antimetabolites, benzene, chloramphenicol, inorganic arsenicals |
| Drugs - Idiosyncratic | Chloramphenicol, phenylbutazone, gold salts, carbamazepine, penicillamine |
| Viral infections | Hepatitis (non-A, non-B, non-C - ~5% of cases), CMV, EBV, varicella zoster (herpes) |
| Radiation | Whole-body irradiation (nuclear accidents, therapeutic) - dose-dependent stem cell destruction |
| Immune diseases | Systemic lupus erythematosus, eosinophilic fasciitis |
| Paroxysmal Nocturnal Hemoglobinuria (PNH) | Associated with aplastic anemia - GPI-linked proteins may be autoimmune targets |
B. Inherited (Rare)
| Condition | Mechanism |
|---|---|
| Fanconi Anemia | Autosomal recessive; defective DNA repair complex; presents in childhood with congenital anomalies (absent thumbs/radii) |
| Telomerase defects | 5-10% of adult-onset aplastic anemia; premature hematopoietic stem cell senescence |
| Dyskeratosis congenita | X-linked; defective telomere maintenance |
Pathogenesis Mechanism (The Two Pathways)
Triggering insult (drug/virus/radiation/idiopathic)
         ↓
Stem cells antigenically altered → "Neoantigens" expressed
         ↓
Activated Th1 cells produce IFN-γ
         ↓
Suppression & apoptosis of hematopoietic progenitors
         ↓
Hypocellular marrow → Pancytopenia
Differential Diagnoses to Rule Out
| Condition | Why Excluded Here |
|---|---|
| Leukemia ("aleukemic") | Bone marrow shows hypocellularity, not blasts |
| Myelophthisic anemia | No teardrop cells; no leukoerythroblastosis on smear |
| Pure red cell aplasia | All three cell lines affected, not just RBCs |
| Megaloblastic anemia | Smear shows normocytic, NOT macrocytic; no hypersegmented neutrophils |
Key rule: Aplastic anemia does NOT cause splenomegaly. If splenomegaly is present, look for another diagnosis.
Treatment Overview
| Patient Profile | Treatment |
|---|---|
| Age <40 + matched sibling donor | Allogeneic hematopoietic stem cell transplant (curative) |
| Age >40 or no matched donor | Antithymocyte globulin (ATG) + Cyclosporine (immunosuppression) |
| Supportive | Packed RBC transfusions, platelet transfusions, G-CSF, antibiotics |
- Robbins, Cotran & Kumar Pathologic Basis of Disease, p. 616-618
- Robbins & Kumar Basic Pathology, p. 2077-2089Quick Answer: Seven charts across diverse hematological conditions - leukemoid reaction, CML, multiple myeloma, ITP, hemophilia A, DIC, and Rh hemolytic disease of the newborn. I'll analyze each in detail with full textbook backing.
DIC disseminated intravascular coagulation pathophysiology diagram microthrombi schistocytes
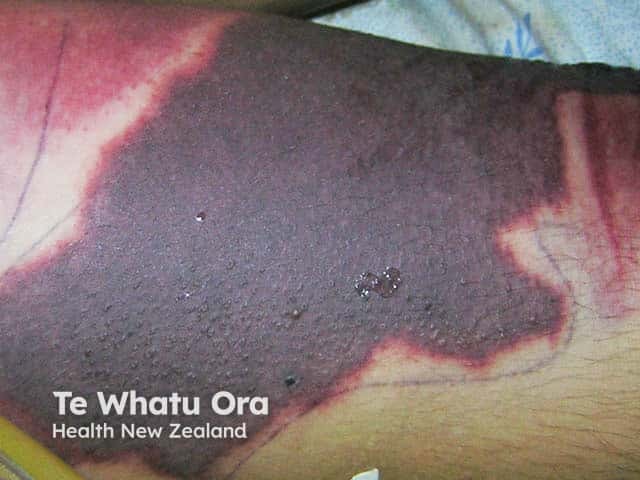
This is a clinical photograph illustrating extensive cutaneous involvement associated with disseminated intravascular coagulation (DIC). Imaging modality: Digital in vivo skin photography. Anatomical location: distal leg region with a large, nonblanching violaceous to dark purple patch showing irregular, geographic margins and a central necrotic area bordered by a pinkish-red rim. The lesion displays nonpalpable purpura with surrounding erythema and edema. Visual cues include mottled purple discoloration, ecchymosis-like zones, and tissue necrosis consistent with microvascular thrombosis and hemorrhage. Pathophysiology of DIC involves systemic activation of coagulation pathways with consumption coagulopathy and formation of dermal microthrombi leading to ischemic necrosis. This image provides a clinical correlate for severe coagulopathy in the setting of sepsis or hemorrhagic shock and aids differential diagnosis against purpura fulminans, meningococcemia, cutaneous vasculitis, necrotizing cellulitis, calciphylaxis, and stasis ulcers. Clinical significance includes urgent coagulation testing (PT, aPTT, platelet count, fibrinogen, D-dimer), blood cultures, sepsis evaluation, and immediate management: treating the underlying cause, hemodynamic support, and appropriate blood product transfusion with careful consideration of anticoagulation per protocol. Educational use: dermatology, hematology, emergency medicine, and pathology training in recognizing DIC cutaneous manifestations. Recognition of these lesions accelerates triage, sepsis workup, and multidisciplinary care.
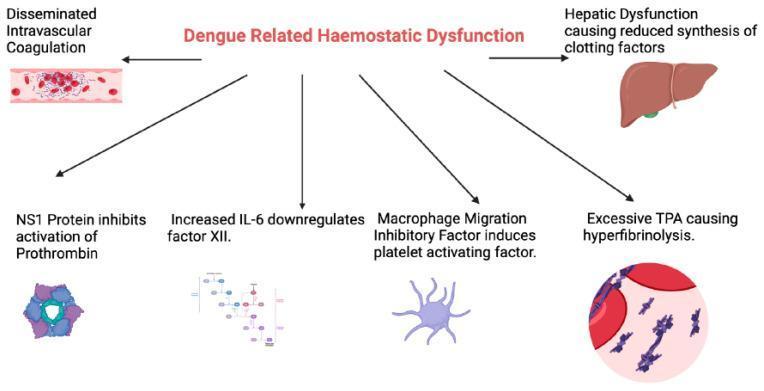
This medical pathophysiology diagram outlines the multifaceted mechanisms of 'Dengue Related Haemostatic Dysfunction'. The central heading branches into six key pathogenic pathways. On the left, a blood vessel illustration demonstrates Disseminated Intravascular Coagulation (DIC) with fibrin-platelet aggregates and trapped red blood cells. On the right, an anatomical liver illustration highlights hepatic dysfunction leading to reduced synthesis of clotting factors. The lower section details molecular and cellular interference: NS1 protein inhibiting prothrombin activation (shown as a hexameric molecular structure); increased IL-6 downregulating factor XII (illustrated via a signaling pathway map); Macrophage Migration Inhibitory Factor inducing platelet-activating factor (represented by an activated immune cell); and excessive Tissue Plasminogen Activator (TPA) causing hyperfibrinolysis, depicted as a microscopic view of fibrin degradation and clot dissolution. This infographic serves as an educational summary of how dengue virus proteins and host inflammatory responses collectively cause coagulopathy and thrombocytopenia.
CML chronic myeloid leukemia peripheral smear myelocytes basophilia
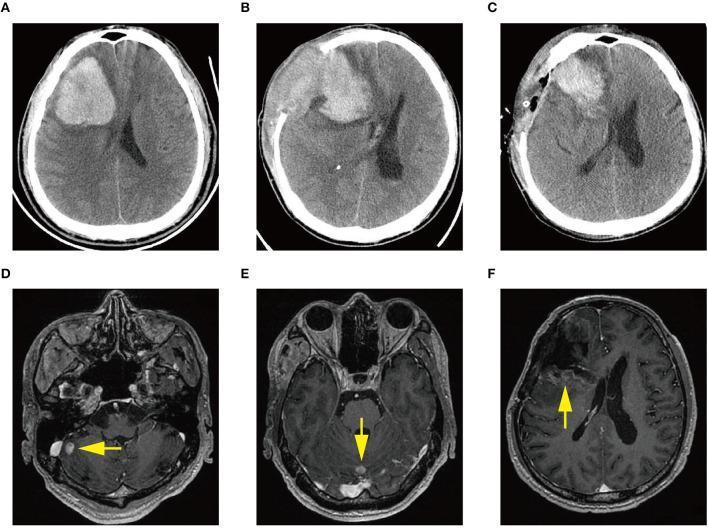
A composite clinical imaging series demonstrating the progression and follow-up of a central nervous system complication of Chronic Myeloid Leukemia (CML). Panels A–C consist of non-contrast axial CT scans of the head. Panel A shows a large, hyperdense acute intracerebral hemorrhage (ICH) in the right frontal lobe with significant mass effect, peripheral vasogenic edema, and midline shift. Panel B (3 days post-first craniotomy) and Panel C (post-second craniotomy) demonstrate recurrent hyperdense hemorrhage in the surgical bed, accompanied by evidence of decompressive hemicraniectomy. Panels D–F are contrast-enhanced T1-weighted axial MRI scans taken one month later. These reveal multiple, small, nodular gadolinium-enhancing intracranial lesions (indicated by yellow arrows) located in the posterior fossa (cerebellum) and right frontal region. These findings represent intracranial involvement of immature myeloid cells (granulocytic sarcoma/chloroma) in the context of CML, illustrating the transition from acute hemorrhagic presentation to visible leukemic infiltration of the brain parenchyma and sulci.
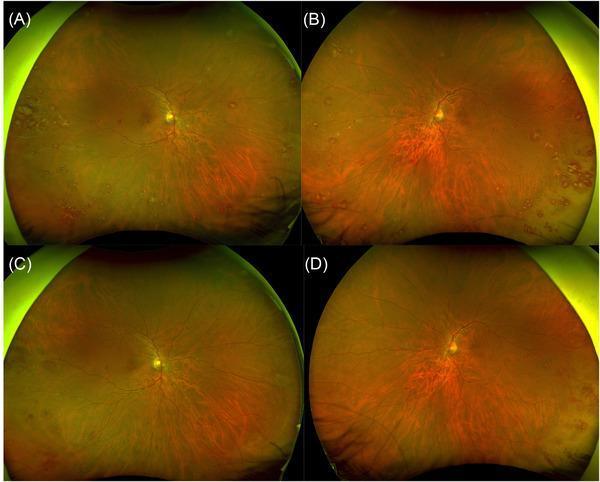
This set of four ultra-widefield fundus photographs illustrates the ophthalmic manifestations of Chronic Myeloid Leukemia (CML) and its response to treatment. Panels A and B display the right and left eyes at presentation, showing florid Roth spots—characterized by retinal hemorrhages with central white spots—distributed across the posterior pole and periphery. There is also prominent peripheral perivascular sheathing, where retinal vessel walls appear thickened or encased in white material. Panels C and D show the same eyes four weeks post-treatment with tyrosine kinase inhibitors. There is a significant clinical improvement, evidenced by the near-complete resolution of the Roth spots and a marked reduction in perivascular sheathing. The comparison serves as a clinical timeline demonstrating the efficacy of systemic leukemia treatment on ocular leukemic infiltrates and associated retinopathy. Key educational concepts include the recognition of Roth spots as signs of systemic disease (leukemia, endocarditis, or severe anemia) and the importance of wide-field imaging in monitoring peripheral retinal vascular changes in hematologic malignancies.
multiple myeloma bone marrow plasma cells rouleaux formation
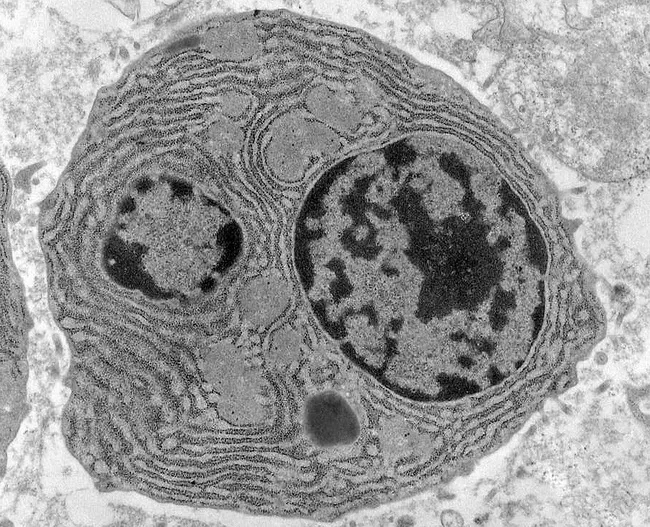
Transmission electron microscopy image of bone marrow plasma cells in multiple myeloma, highlighting ultrastructural features of malignant plasmacytosis. The specimen is a bone marrow biopsy/aspirate subjected to TEM to reveal subcellular architecture at high magnification. The primary subject is a plasma cell characterized by a prominent, eccentrically placed nucleus with chunky, irregular clumped chromatin and abundant cytoplasm. Bi- or multinucleation is frequently observed in myeloma cells. The cytoplasm shows extensive rough endoplasmic reticulum organized in parallel lamellae, reflecting heavy immunoglobulin synthesis. Light gray, round to ovoid cytoplasmic inclusions known as Russell bodies are evident within the cytoplasm, representing condensed immunoglobulin within intact endoplasmic reticulum. The cellular borders are well defined, and there is sometimes distension of the ER cisternae near the perinuclear region. The image underscores hallmark features of malignant plasma cells in multiple myeloma and demonstrates both proliferative activity and high secretory load. Clinically, these ultrastructural findings correlate with a high monoclonal immunoglobulin production and marrow infiltration, informing prognosis and therapeutic decisions when integrated with light-chain studies and routine histology. This EM view complements light microscopy by providing evidence of intracellular organelle expansion and intracellular inclusions that are not discernible with conventional staining. Potential educational use includes teaching plasmacytosis, plasma cell neoplasia morphology, and EM-based diagnostic histopathology.
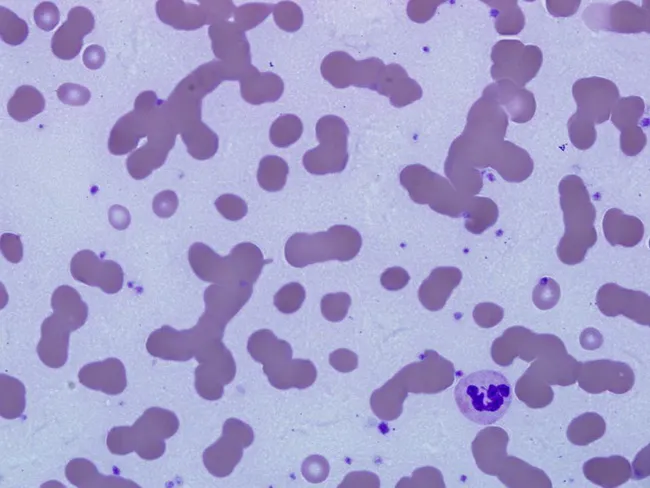
Imaging modality: Brightfield light microscopy of a Wright-Giemsa stained peripheral blood smear. The smear demonstrates marked rouleaux formation of red blood cells, with cells stacking in linear, coin-like columns typical of hypergammaglobulinemia. The background appears subtly bluish, reflecting increased serum proteins and altered stain uptake produced by monoclonal immunoglobulin (M-protein) in the plasma. Occasional circulating plasma cells are visible, consistent with plasma cell dyscrasia; in advanced myeloma this may progress to marked plasmacytosis or plasma cell leukemia. Note that rouleaux is not specific for plasma cell disorders and can occur with other states that raise immunoglobulin levels, such as systemic lupus erythematosus, chronic infections, and HIV. The combination of RBC rouleaux and blue background staining on Wright-Giemsa supports a workup for a monoclonal gammopathy; definitive diagnosis requires serum protein electrophoresis, immunofixation, free light chain assay, and bone marrow examination. Clinically, these findings correlate with increased plasma viscosity and potential hyperviscosity symptoms; they also influence automated hematology analyzer results and guide diagnostic sequencing in hematology-oncology. This image is valuable for education on rouleaux pathophysiology, differential diagnoses of gammopathy, and recognition of circulating plasma cells in blood. This image supports educational discussion in hematology and medical diagnostics. Useful for exam review, case conferences, and AI image recognition benchmarks.
Hematology Charts 6-12: Full Analysis
CHART NO. 6 — Leukemoid Reaction
1) Differential Diagnosis
- Secondary diagnosis to exclude: Chronic Myeloid Leukemia (CML) - the most important differential
Findings and Interpretation
| Parameter | Value | Significance |
|---|---|---|
| Hb | 10.5 g/dl | Mildly reduced - anemia of infection |
| TLC | 52,000/cumm | Markedly elevated leukocytosis |
| N | 47% | Mature neutrophils |
| Metamyelocytes | 16% | Immature neutrophils - "left shift" |
| Band forms | 20% | Immature neutrophils - severe left shift |
| Platelets | 1.2 lakhs (120,000) | Normal |
| LAP score | Increased | The KEY distinguishing finding |
The LAP Score - Why It's Critical
| Condition | LAP Score |
|---|---|
| Leukemoid Reaction | HIGH (>100) |
| CML | LOW (0-15) |
| Polycythemia vera | High |
| Pregnancy, stress | High |
| PNH, MDS | Low |
Leukemoid Reaction vs CML - Key Differences
| Feature | Leukemoid Reaction | CML |
|---|---|---|
| Cause | Infection/inflammation | Neoplastic |
| TLC | Usually <50,000 | Often >100,000 |
| LAP score | High | Low |
| Splenomegaly | Absent or mild | Massive |
| Basophilia | Absent | Present |
| Philadelphia chromosome | Absent | Present in 95% |
| Toxic granulation in neutrophils | Present | Absent |
| Döhle bodies | Present | Absent |
2) Etiological Factors for Leukemoid Reaction
| Category | Examples |
|---|---|
| Bacterial infections | Pneumonia (most likely here), sepsis, meningitis, TB |
| Viral infections | EBV (lymphocytic leukemoid reaction) |
| Inflammatory | Burns, trauma, surgery |
| Drugs | G-CSF, corticosteroids, epinephrine |
| Malignancies | Solid tumors, lymphoma |
| Others | Hemorrhage, hemolysis |
CHART NO. 7 — Chronic Myeloid Leukemia (CML)
1) Diagnosis: Chronic Myeloid Leukemia (CML)
Findings Decoded
| Parameter | Value | Significance |
|---|---|---|
| Hb | 9.8 g/dl | Anemia from marrow replacement |
| TLC | 1,20,000/cumm | Massive leukocytosis - the hallmark of CML |
| Platelets | 2,00,000 | Normal (can be high or normal in CML) |
| RBC smear | Normocytic normochromic, occasional nRBCs | Marrow stress releasing nucleated RBCs |
| WBC smear | Myelocytes + metamyelocytes predominant, eosinophilia, basophilia | Full myeloid spectrum = "myelocyte bulge" |
| Sternal tenderness | Present | Marrow expansion/infiltration |
| Massive splenomegaly | Present | Extramedullary hematopoiesis |
2) Associated Chromosomal Abnormality: Philadelphia Chromosome (Ph¹)
- Translocation: t(9;22)(q34;q11)
- The long arm of chromosome 22 (BCR gene) fuses with the long arm of chromosome 9 (ABL gene)
- Creates the BCR-ABL fusion oncogene on the shortened chromosome 22 (Philadelphia chromosome)
- BCR-ABL encodes a constitutively active tyrosine kinase → uncontrolled myeloid proliferation
- Present in ~95% of CML patients
- Also found in ~25% of adult ALL and ~5% of childhood ALL
3) Phases of CML
| Phase | Duration | Features |
|---|---|---|
| Chronic Phase | 3-5 years | Slow indolent disease; responds to treatment; <10% blasts in marrow; most patients at diagnosis |
| Accelerated Phase | Months | Increasing blasts (10-19%); increasing basophils (>20%); increasing cytogenetic changes; worsening anemia/thrombocytopenia |
| Blast Crisis (Blast Phase) | Terminal | >20% blasts in blood or marrow; behaves like acute leukemia; 70% myeloid (AML-like), 30% lymphoid (ALL-like); median survival weeks-months without treatment |
CHART NO. 8 — Multiple Myeloma
1) Diagnosis: Multiple Myeloma (Plasma Cell Myeloma)
Findings Decoded
| Parameter | Value | Significance |
|---|---|---|
| Hb | 11.6% | Mild anemia - marrow replacement by plasma cells |
| TLC | 7,500 | Normal |
| ESR | 78 mm/hr | Markedly elevated - due to high immunoglobulins increasing rouleaux |
| Sr. Proteins | 12 g/dl (N: 6-8.3) | Hyperproteinemia - from monoclonal immunoglobulin (M-protein) |
| A/G ratio | Altered (reversed - globulin > albumin) | Massive immunoglobulin production |
| Bence Jones Protein | Present in urine | Free light chains (kappa or lambda) filtered by kidney - pathognomonic |
| Peripheral smear | Rouleaux formations | RBCs stack like coins due to high protein coating their surface |
| Bone marrow | 30% plasma cells | Normal <5%; >10% is diagnostic criterion |
2) Diagnostic Criteria (CRAB + Myeloma Defining Events)
| Letter | Finding | This Patient |
|---|---|---|
| C - Hypercalcemia | >11 mg/dl | Likely (from bone destruction) |
| R - Renal insufficiency | Creatinine >2 mg/dl | Possible (Bence Jones nephropathy) |
| A - Anemia | Hb <10 g/dl | Present (Hb 11.6, borderline) |
| B - Bone lesions | Lytic lesions/osteoporosis/fracture | Present - hip fracture |
- Clonal bone marrow plasma cells ≥10% (here: 30% ✓)
- Biopsy-proven plasmacytoma
- Plus any CRAB criterion OR SLiM event (>60% plasma cells, free light chain ratio >100, >1 focal lesion on MRI)
- Serum protein electrophoresis (SPEP) - M-spike
- Immunofixation - identifies M-protein type (IgG most common)
- Serum free light chain assay
- Skeletal survey (punched-out lytic skull lesions)
- Beta-2 microglobulin (prognosis)
CHART NO. 9 — Immune Thrombocytopenic Purpura (ITP)
1) Diagnosis: Immune Thrombocytopenic Purpura (ITP)
Findings Decoded
| Parameter | Value | Significance |
|---|---|---|
| Hb | 11 g/dl | Mildly low - from mucosal bleeding (menorrhagia) |
| TLC | 6,500 | Normal |
| DLC | N56%, L38% | Normal - WBCs completely unaffected |
| Platelets | 18,000/cumm | Severely low (normal 150,000-400,000) |
| Peripheral smear RBCs | Normocytic normochromic | Normal - no hemolysis |
| Peripheral smear WBCs | Normal counts, morphology, distribution | Confirms isolated platelet problem |
| Peripheral smear platelets | Markedly reduced |
2) Bone Marrow Finding
| Finding | Significance |
|---|---|
| Megakaryocytes: normal or INCREASED in number | Marrow is trying to compensate for peripheral platelet destruction |
| Megakaryocyte morphology: normal | Not dysplastic (rules out MDS) |
| Erythroid and myeloid precursors: normal | Confirms isolated platelet problem |
| No abnormal cells | Rules out leukemia or marrow infiltration |
Key point: The bone marrow shows increased megakaryocytes - this proves the problem is peripheral destruction (immune), NOT failure of platelet production. This differentiates ITP from aplastic anemia where megakaryocytes would be absent.
CHART NO. 10 — Hemophilia A
1) Diagnosis: Hemophilia A (Factor VIII Deficiency)
Coagulation Results Interpreted
| Test | Result | Normal | Interpretation |
|---|---|---|---|
| Platelet count | Normal | Normal | Platelets fine - primary hemostasis intact |
| Bleeding time | 2 min | 2-9 min | Normal - confirms platelets working |
| Clotting time | 16 min | 8-15 min | PROLONGED |
| Prothrombin time (PT) | 12 sec | 10-13 sec | Normal |
| APTT | 55 sec | 21-35 sec | MARKEDLY PROLONGED |
| Factor VIII Assay | Deficient | Confirmatory |
3) Coagulation Pathway Affected
INTRINSIC PATHWAY (measured by APTT)
XII → XI → IX → VIII → X
                  ↑
           FACTOR VIII DEFICIENT
                  ↓
         APTT prolonged, PT normal
| Pathway | Tests | Factors |
|---|---|---|
| Intrinsic | APTT | XII, XI, IX, VIII, X, V, II, fibrinogen |
| Extrinsic | PT/INR | VII, X, V, II, fibrinogen |
| Common | Both PT and APTT | X, V, II (prothrombin), I (fibrinogen) |
2) Mode of Inheritance: X-linked Recessive
- Gene located on the long arm of the X chromosome (Xq28)
- Affects males (XY) - only one X chromosome, so one defective copy causes disease
- Females are carriers (XX) - one normal X compensates; rarely symptomatic
- Sons of carriers: 50% affected
- Daughters of carriers: 50% carriers
- Affected father × normal mother → all sons normal, all daughters carriers
| Severity | Factor VIII Level | Features |
|---|---|---|
| Severe | <1% | Spontaneous hemarthrosis, muscle bleeds (this patient) |
| Moderate | 1-5% | Bleeding with minor trauma |
| Mild | 5-40% | Bleeding only with significant trauma/surgery |
CHART NO. 11 — Disseminated Intravascular Coagulation (DIC)
1) Diagnosis: Disseminated Intravascular Coagulation (DIC)
Findings Decoded
| Parameter | Value | Significance |
|---|---|---|
| Hb | 10.6 g% | Anemia - from hemorrhage and hemolysis |
| TLC | 14,400, neutrophilia | Reactive leukocytosis (stress, blood loss) |
| Platelets | 26,000 | Severely low - consumed in microthrombi |
| Peripheral smear RBCs | Schistocytes, fragmented RBCs, anisopoikilocytosis | MICROANGIOPATHIC HEMOLYTIC ANEMIA - RBCs shredded by fibrin strands in microvessels |
| PT | 22 sec (N: 10-13) | Prolonged - extrinsic pathway factors consumed |
| Thrombin time | 24 sec (N: 12-19) | Prolonged - low fibrinogen + FDPs inhibiting thrombin |
| APTT | 90 sec (N: 21-35) | Markedly prolonged - intrinsic factors consumed |
| Fibrinogen | Reduced | Consumed - normally the last factor to fall in DIC |
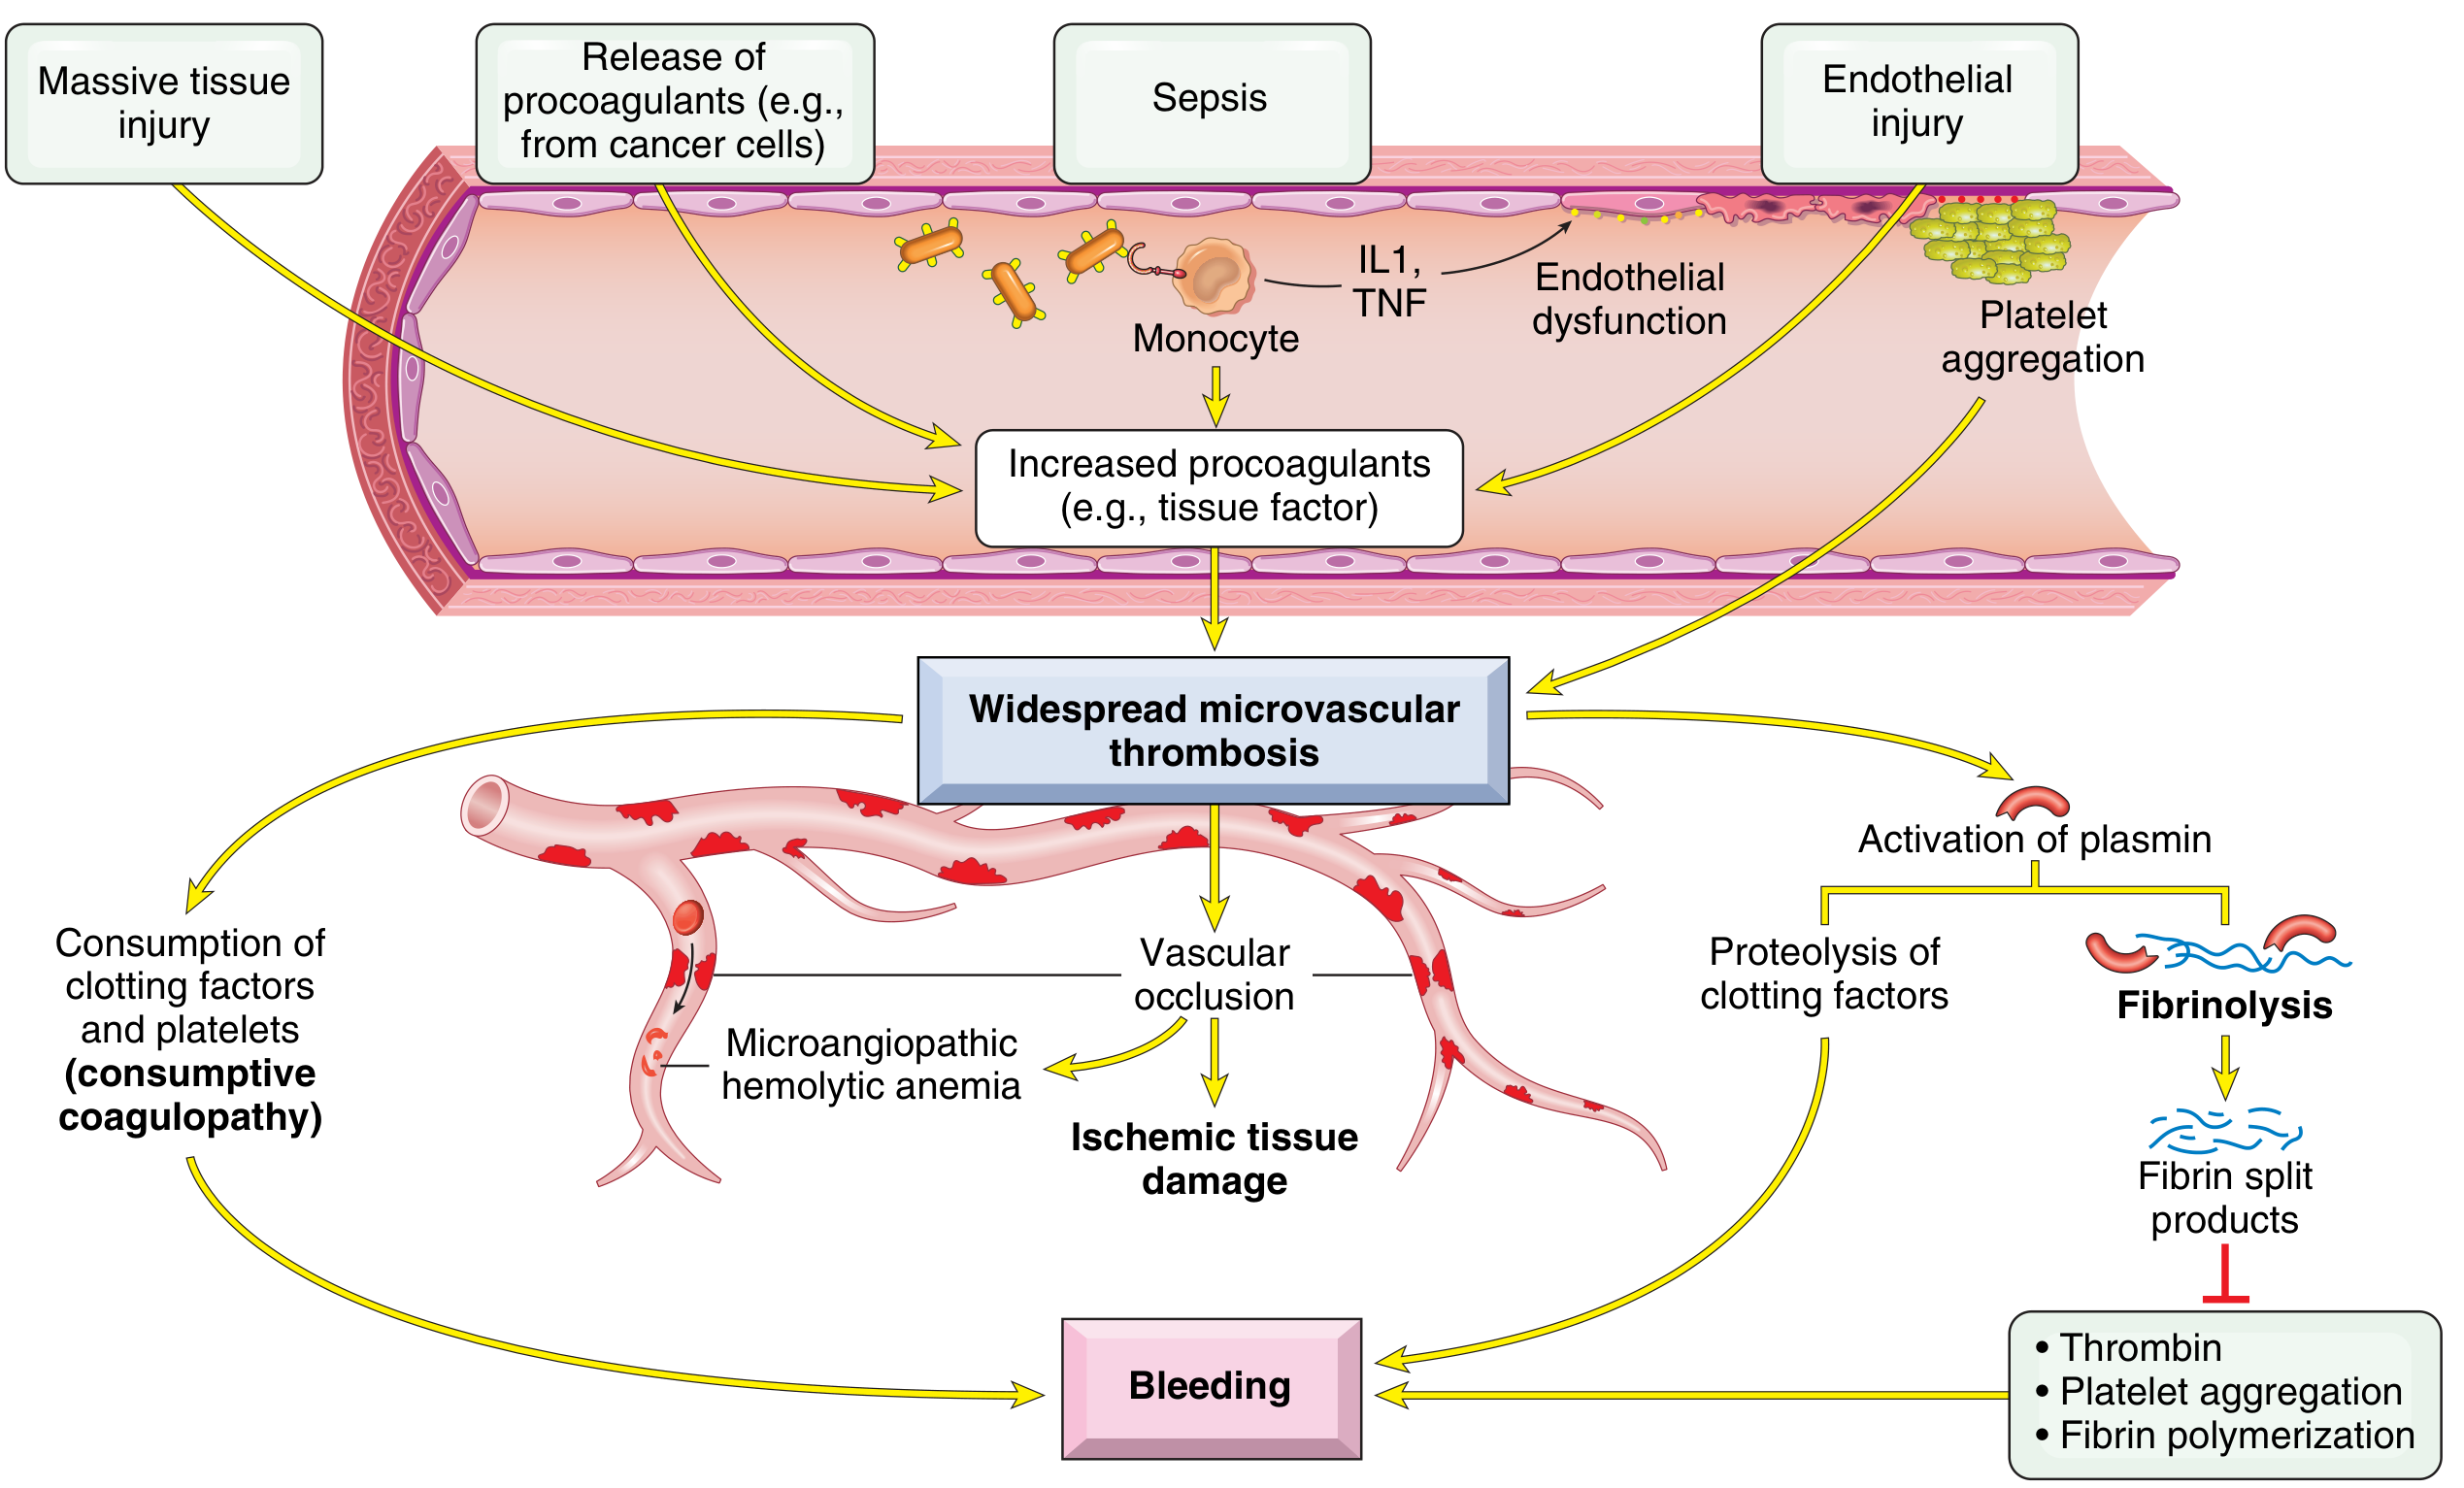
2) Etiopathogenesis
- Tissue factor released from placenta/uterus during labor/hemorrhage enters the circulation
- This activates the extrinsic coagulation cascade systemically
- Widespread microthrombi form throughout the microcirculation (kidneys, brain, adrenals, lungs)
- Consumptive coagulopathy - clotting factors (V, VIII, fibrinogen) and platelets all consumed
- Secondary fibrinolysis activated - plasmin degrades fibrin → Fibrin Degradation Products (FDPs/D-dimers) released
- FDPs inhibit thrombin and platelet aggregation → worsens bleeding
- RBCs forced through fibrin strands → mechanical fragmentation → schistocytes
- Net result: Simultaneous thrombosis AND bleeding
- Sepsis (gram-negative and gram-positive)
- Malignancies (acute promyelocytic leukemia, pancreatic/prostate cancer)
- Massive tissue injury (trauma, burns)
- Amniotic fluid embolism, abruptio placentae, retained dead fetus, eclampsia
3) Confirmatory Tests
| Test | Finding in DIC |
|---|---|
| D-dimer | Elevated (most sensitive) - fibrin breakdown product |
| FDP (fibrin degradation products) | Elevated |
| PT, APTT, TT | All prolonged |
| Fibrinogen | Low (<150 mg/dl) |
| Peripheral smear | Schistocytes |
| Factor assays | Factors V, VIII, fibrinogen low |
CHART NO. 12 — Hemolytic Disease of the Newborn (HDN) - Rh Incompatibility
1) Diagnosis: Hemolytic Disease of the Newborn (HDN) due to Rh Incompatibility
Findings Decoded
| Parameter | Value | Significance |
|---|---|---|
| Hb | 4.6 g/dl | Severe anemia from RBC hemolysis |
| Reticulocyte count | 6% | Elevated - compensatory erythropoiesis |
| Total bilirubin | 18 mg/dl (N: 0.3-1.2) | Severely elevated |
| Conjugated | 4 mg/dl | Mildly elevated |
| Unconjugated | 14 mg/dl | Predominantly elevated - hemolytic pattern |
| Urine | Urobilinogen positive | Confirms excess bilirubin from hemolysis |
| Peripheral smear | Schistocytes, fragmented RBCs, polychromatic RBCs, nucleated RBCs (10%) | Severe hemolysis + intense erythropoietic response |
2) Confirmatory Tests
| Test | Expected Finding |
|---|---|
| Direct Coombs Test (DAT) on cord blood | POSITIVE - maternal anti-D IgG coating baby's RBCs |
| Indirect Coombs Test on mother's blood | Positive - circulating anti-D antibodies |
| Blood group + Rh typing (mother, father, baby) | Mother: A-neg, Baby: likely B+ or AB+ |
| Anti-D antibody titres in mother | Elevated |
| Peripheral smear | Spherocytes, polychromasia, nucleated RBCs |
| Bilirubin (serial monitoring) | Rising rapidly after birth |
3) Complications
| Complication | Mechanism |
|---|---|
| Kernicterus | Unconjugated bilirubin crosses blood-brain barrier → deposits in basal ganglia → irreversible neurological damage (choreoathetosis, sensorineural deafness, intellectual disability) |
| Hydrops fetalis | Severe fetal anemia → heart failure → generalized edema, ascites, pleural effusion - can be fatal |
| Severe anemia | Intravascular hemolysis of all RBCs coated with anti-D |
| Hepatosplenomegaly | Extramedullary hematopoiesis |
| Coagulopathy | Liver involvement in severe cases |
| Hypoglycemia | Islet cell hyperplasia in severe cases |
Summary: All 7 Charts at a Glance
| Chart | Diagnosis | Key Finding |
|---|---|---|
| 6 | Leukemoid Reaction | LAP score increased, reactive leukocytosis, no splenomegaly |
| 7 | CML | t(9;22) Philadelphia chromosome, LAP low, massive splenomegaly, basophilia |
| 8 | Multiple Myeloma | Bence Jones protein, 30% plasma cells, M-spike, lytic bone lesion |
| 9 | ITP | Isolated thrombocytopenia, normal WBCs, increased megakaryocytes in marrow |
| 10 | Hemophilia A | Factor VIII deficient, APTT prolonged, PT normal, X-linked recessive |
| 11 | DIC | All coag tests prolonged, low fibrinogen, schistocytes, post-partum trigger |
| 12 | Rh HDN | DAT positive, anti-D antibodies, erythroblastosis fetalis, kernicterus risk |
- Robbins & Kumar Basic Pathology, p. 3023-3054 (DIC)
- Robbins, Cotran & Kumar Pathologic Basis of Disease, p. 1431-1470 (Aplastic anemia, leukemias)
- Quick Compendium of Clinical Pathology 5th ed. (LAP score, ITP, myeloma criteria)