
Explain the full concept of qrs complex and all of construction of heart
Reading File
Now let me search the medical library for comprehensive content on QRS complex and cardiac anatomy/conduction.
Finding Sources
Finding Sources
Finding Sources
Reading File
Reading File
Reading File
Reading File
Reading File
Finding Sources
Finding Sources
Reading File
Reading File
Reading File
Now let me fetch the key diagrams to include in the answer:
Loading Image
Loading Image
Loading Image
Loading Image
Loading Image
I now have comprehensive information from authoritative textbooks (Guyton & Hall, Goldman-Cecil, Harrison's, Gray's Anatomy) along with excellent diagrams. Let me compile the full answer.
The QRS Complex and the Electrical Construction of the Heart
1. Overview: The ECG and Its Waves
The electrocardiogram (ECG) records the electrical events of the cardiac cycle. The normal ECG consists of three major deflections:
| Wave | What It Represents |
|---|---|
| P wave | Atrial depolarization (atria contract) |
| QRS complex | Ventricular depolarization (ventricles contract) |
| T wave | Ventricular repolarization (ventricles recover) |
The QRS is far larger in voltage than the P wave because the ventricular muscle mass is far greater than the atrial muscle mass. Atrial repolarization is buried inside the QRS complex and not visible on the surface ECG. - Goldman-Cecil Medicine, p. 519
2. The Cardiac Conduction System - Anatomy and Construction
This is the "wiring" of the heart that generates and coordinates every heartbeat. It consists of four major components:
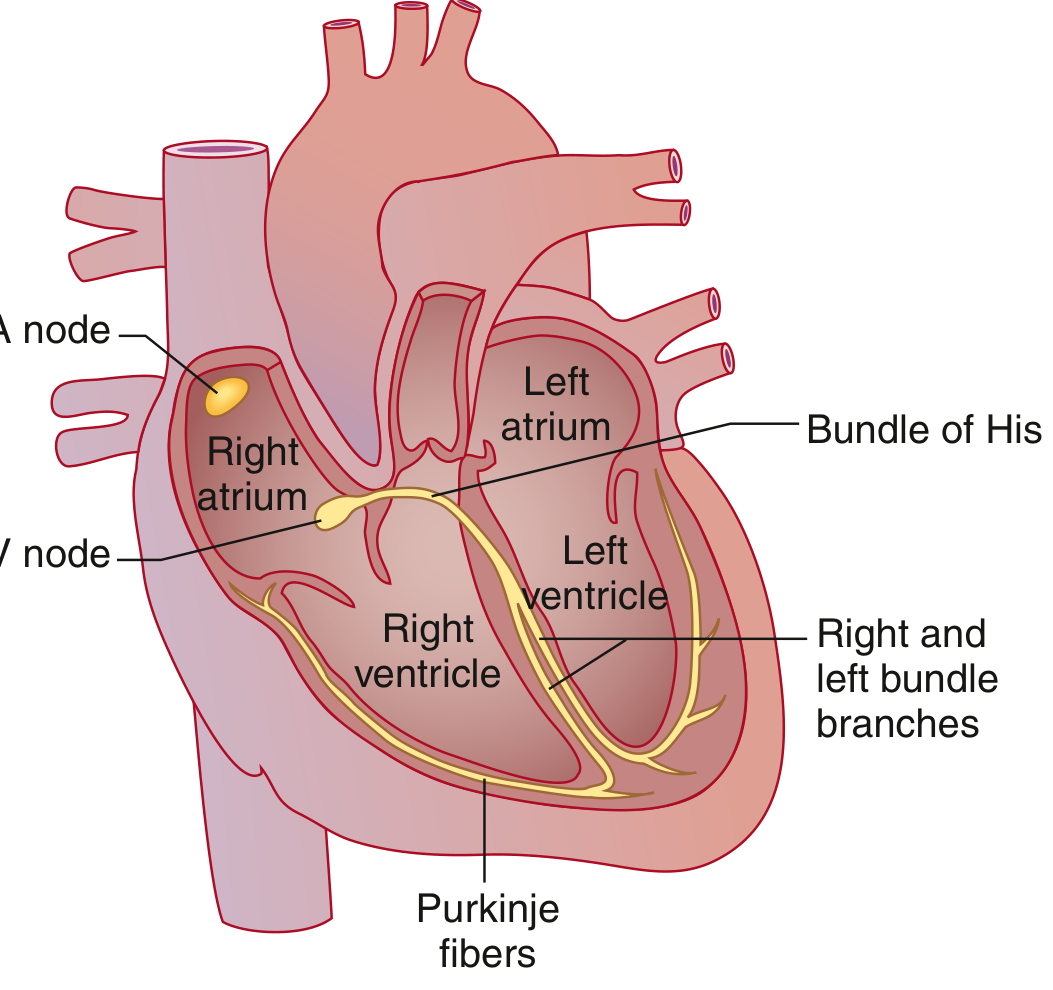
Cardiac Conduction System - Goldman-Cecil Medicine
2.1 Sinoatrial (SA) Node - The Pacemaker
- Located at the junction of the superior vena cava and the right atrium, at the superior end of the crista terminalis
- This collection of specialized cells depolarizes spontaneously at the highest intrinsic rate (~60-100 bpm), making it the dominant cardiac pacemaker
- The excitation wave spreads across both atria, causing atrial contraction
- The Bachmann bundle (specialized intra-atrial tract) speeds the wave to the left atrium - Goldman-Cecil Medicine, p. 519; Gray's Anatomy, p. 247
2.2 Atrioventricular (AV) Node
- Located near the opening of the coronary sinus, close to the septal cusp of the tricuspid valve, within the atrioventricular septum
- Physiologic conduction delay occurs here - this pause allows the atria to finish contracting and fill the ventricles before ventricular contraction begins
- The AV node is the only electrical connection between atria and ventricles under normal conditions; the AV valve rings are electrically insulated - Gray's Anatomy, p. 247
2.3 Bundle of His (Atrioventricular Bundle)
- A direct continuation of the AV node
- Travels along the lower border of the membranous interventricular septum
- Capable of rapid conduction
- Bifurcates into the right and left bundle branches - Gray's Anatomy, p. 247
2.4 Bundle Branches and Purkinje System
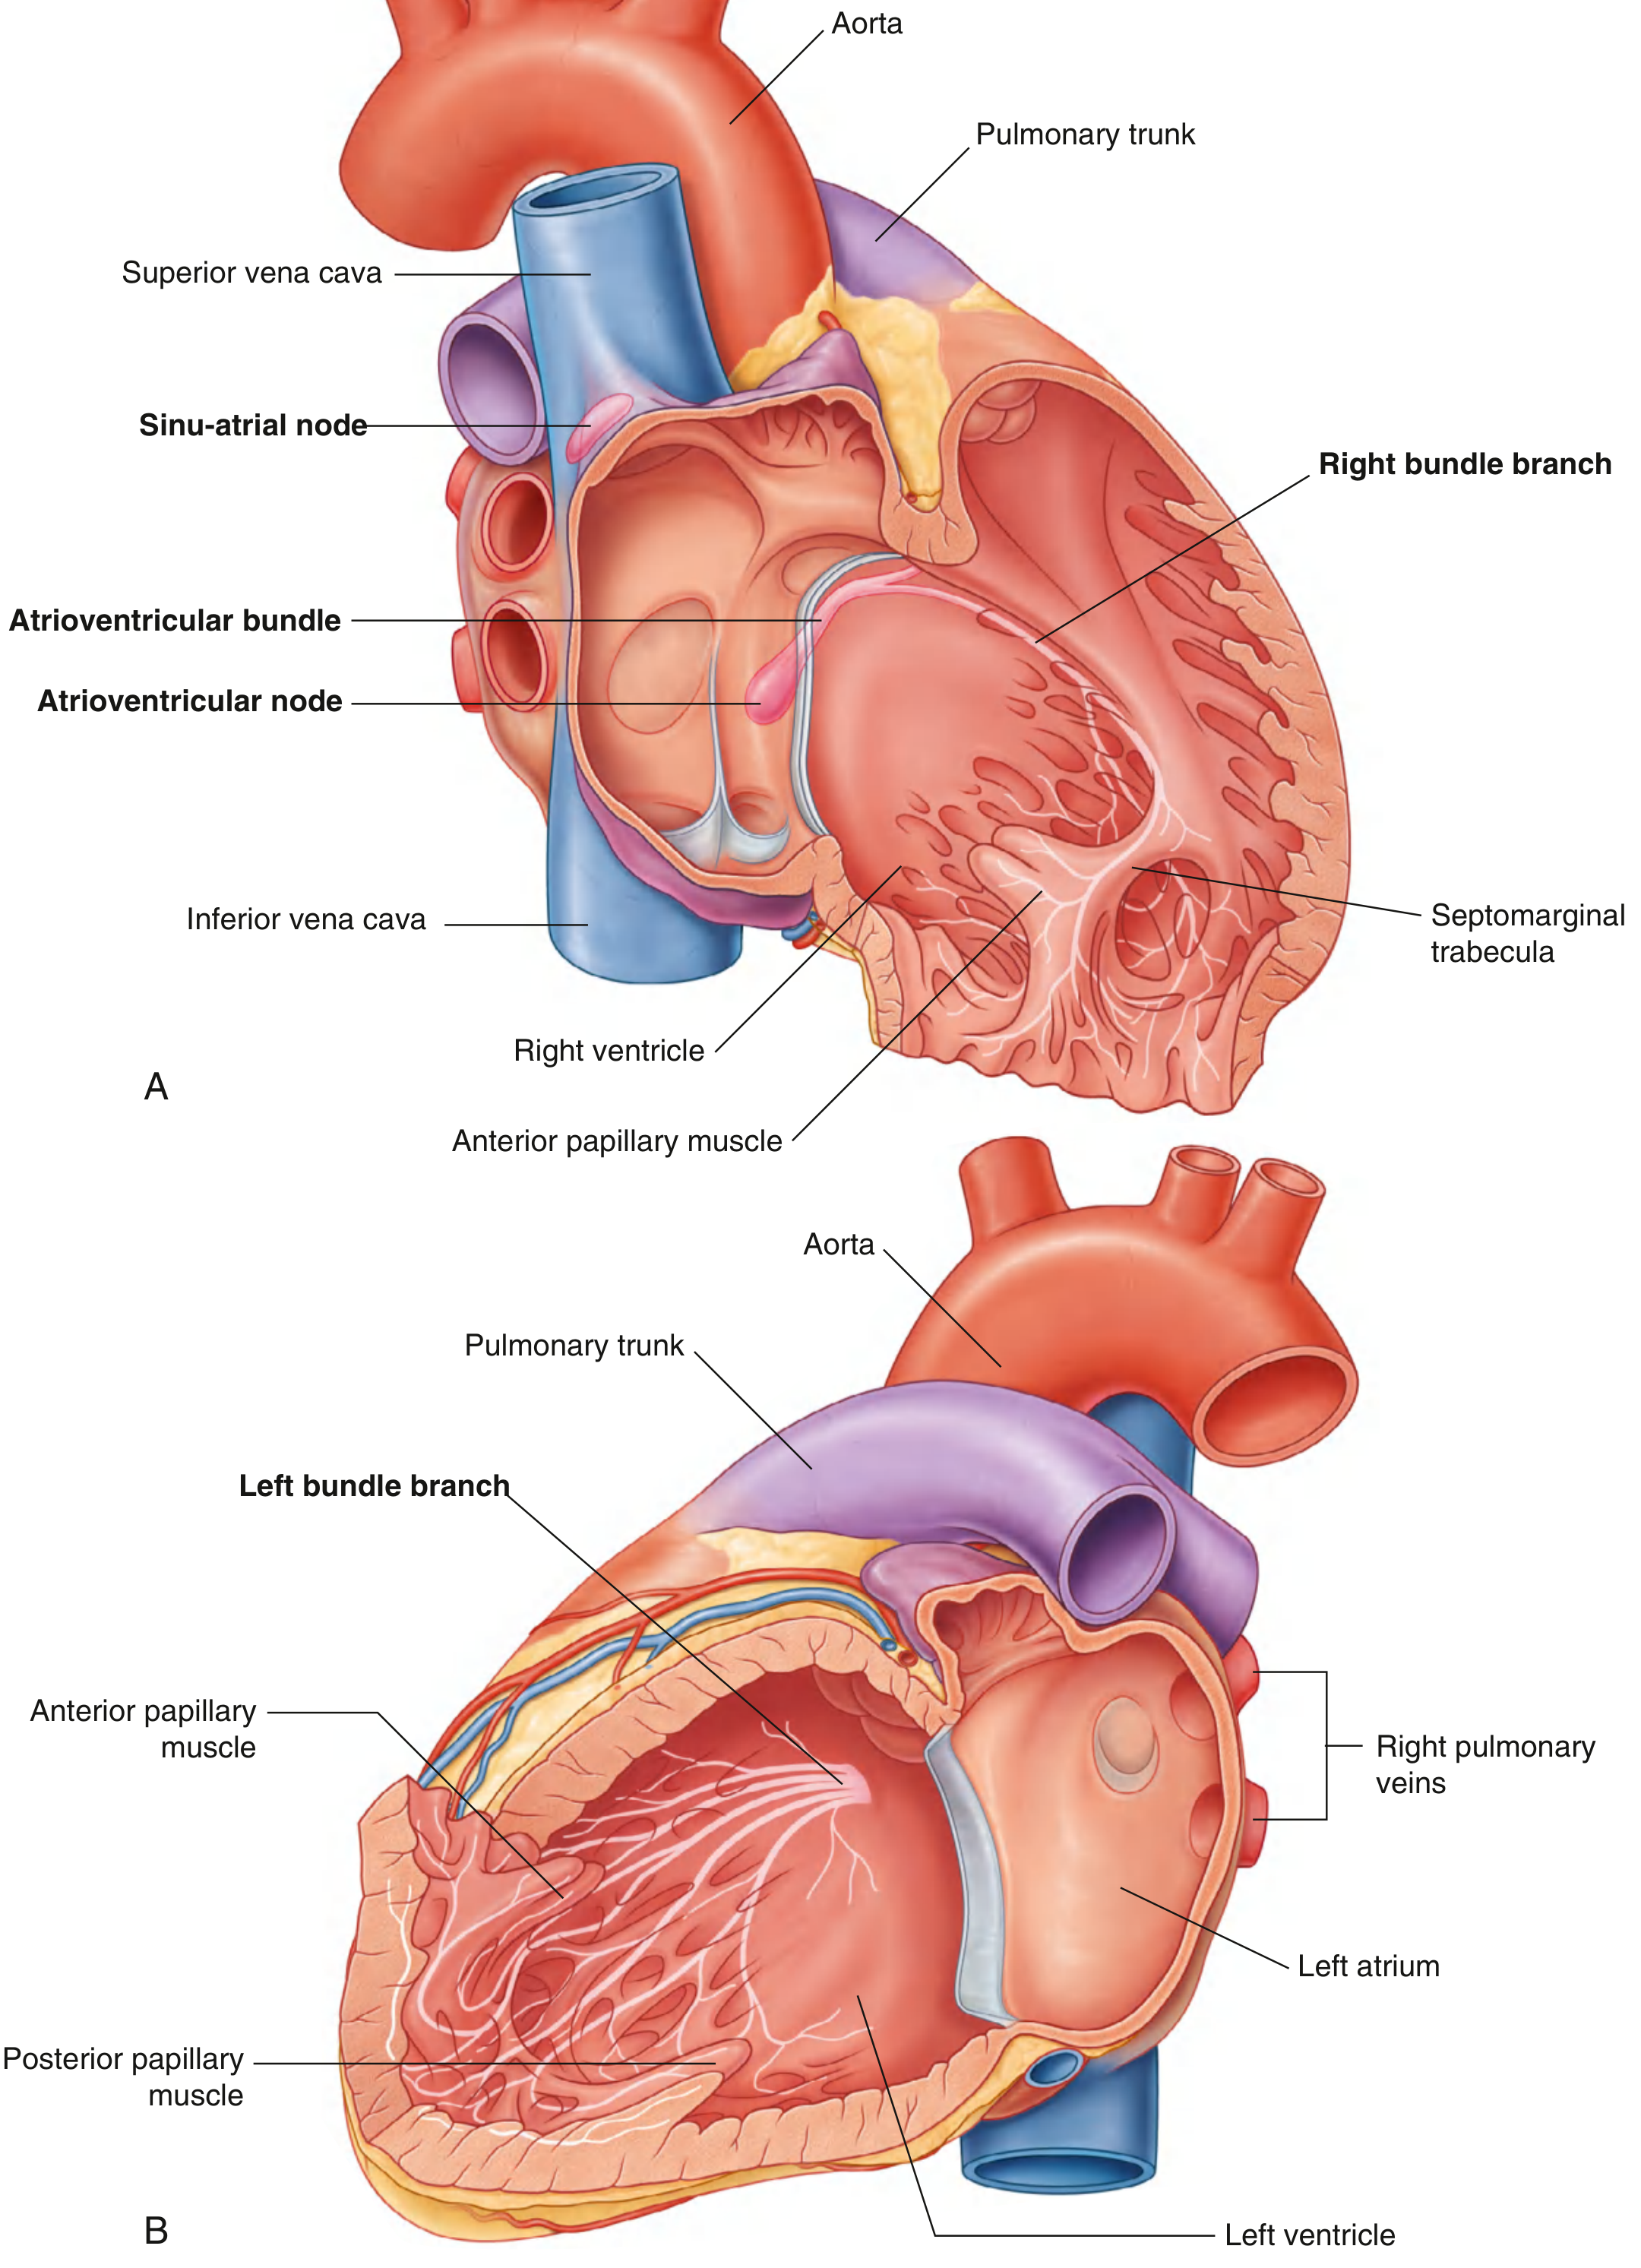
Fig. 3.86 - Conduction System of the Heart. Right (A) and Left (B) chambers. - Gray's Anatomy for Students
Right Bundle Branch:
- Travels along the right side of the interventricular septum
- Enters the septomarginal trabecula to reach the anterior papillary muscle
- Divides into the subendocardial plexus of Purkinje fibers throughout the right ventricle
Left Bundle Branch:
- Passes to the left side of the muscular interventricular septum
- Divides into the left anterior fascicle and left posterior fascicle
- Becomes continuous with Purkinje fibers of the left ventricle
Purkinje Fibers:
- The terminal network of specialized conduction cells
- Spread excitation impulses rapidly throughout the ventricular musculature and papillary muscles
- This ensures excitation begins at the apex and papillary muscles first, so contraction squeezes blood toward the outflow tracts - Gray's Anatomy, p. 247-248
Key anatomical point: Throughout their course, the large branches of the conduction system are insulated from surrounding myocardium by connective tissue, preventing premature or inappropriate stimulation. Functional contacts with the myocardium greatly increase only in the subendocardial network. - Gray's Anatomy, p. 247
3. The QRS Complex - Step-by-Step Construction
3.1 What Is the QRS Complex?
The QRS complex is the ECG recording of ventricular depolarization - the electrical event that triggers ventricular muscle contraction. It normally lasts 0.06 to 0.10 seconds. It is called "QRS" because it is often (but not always) composed of three waves: Q, R, and S. - Guyton & Hall, p. 143
3.2 The Two Phases of Ventricular Depolarization
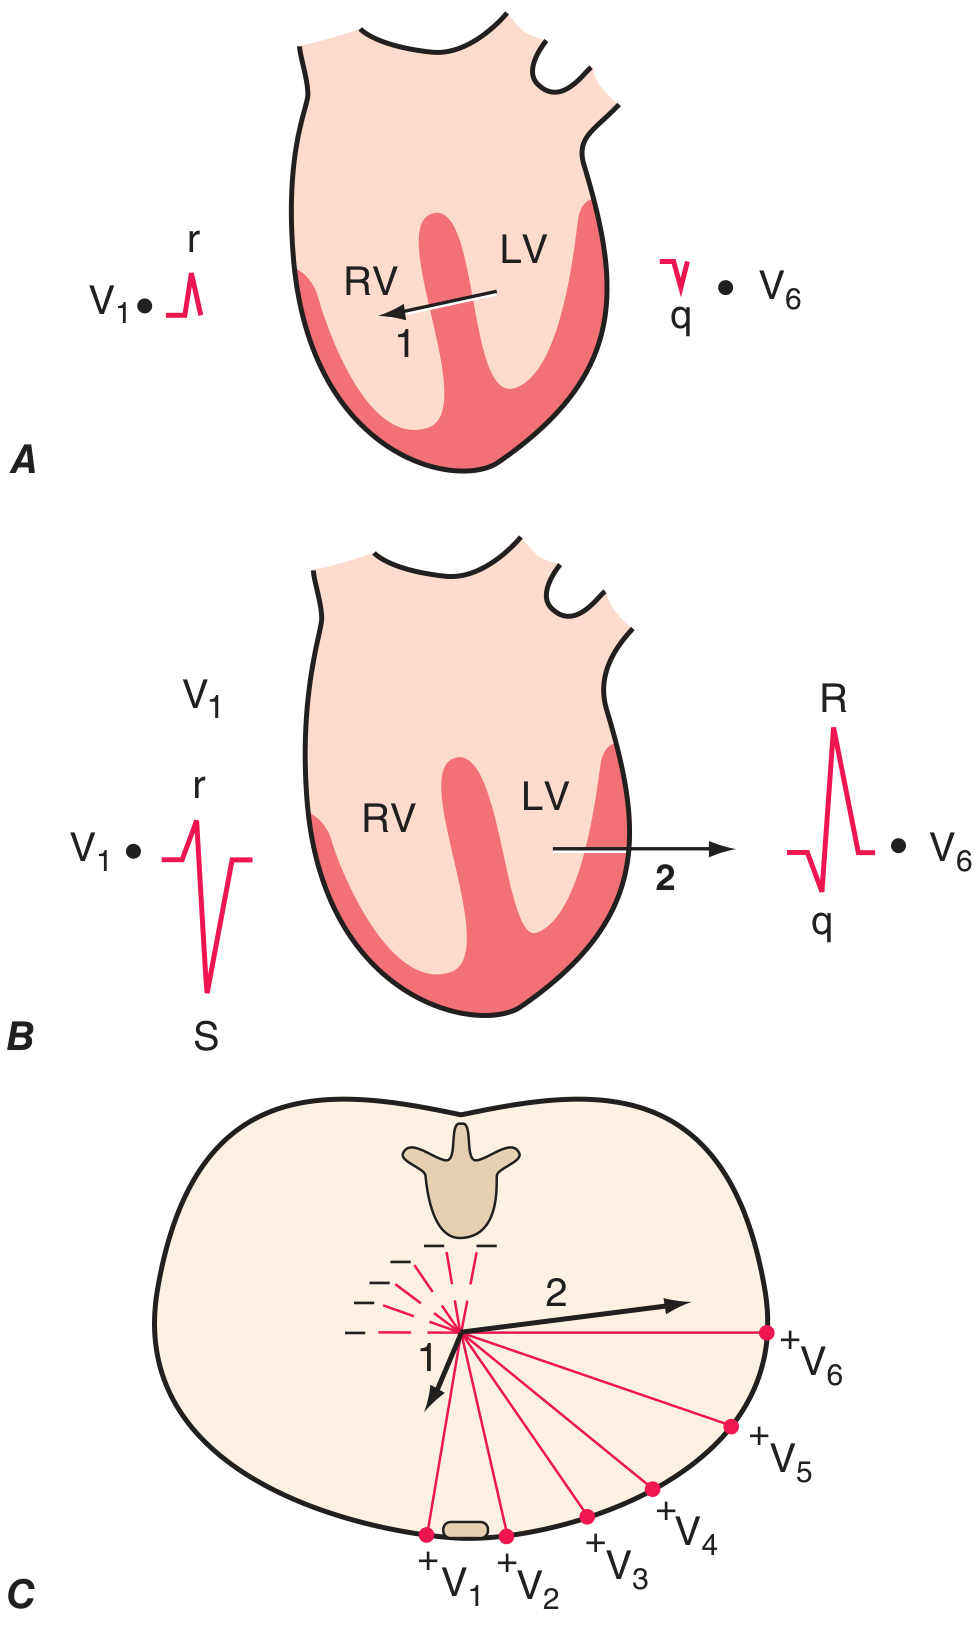
Fig. 247-6 - Two phases of ventricular depolarization - Harrison's Principles of Internal Medicine, 22nd Ed., p. 1913
Phase 1 - Septal Depolarization:
- The first area depolarized is the left endocardial surface of the interventricular septum
- Depolarization spreads from left to right (leftward-to-rightward direction, anteriorly)
- This creates Vector 1 pointing right and anteriorly
- On V1 (right precordial lead): produces a small positive r wave
- On V6 (left precordial lead): produces a small negative q wave (septal q)
Phase 2 - Free Wall Depolarization:
- Simultaneous depolarization of both right and left ventricular free walls
- The left ventricle is electrically dominant (much more muscle mass)
- Vector 2 points leftward and posteriorly
- On V1: produces a large negative S wave (rS pattern overall)
- On V6: produces a tall positive R wave (qR pattern overall)
Between V1 and V6, there is a gradual transition: R-wave amplitude increases and S-wave amplitude decreases across leads V1 to V6 - this is called normal R-wave progression. The point where R and S are equal is the transition zone (typically V3 or V4). - Harrison's, p. 1913
3.3 Sequential Vector Analysis (Guyton & Hall)
The QRS builds over approximately 0.06 seconds as depolarization sweeps the ventricles. This can be understood as five stages:
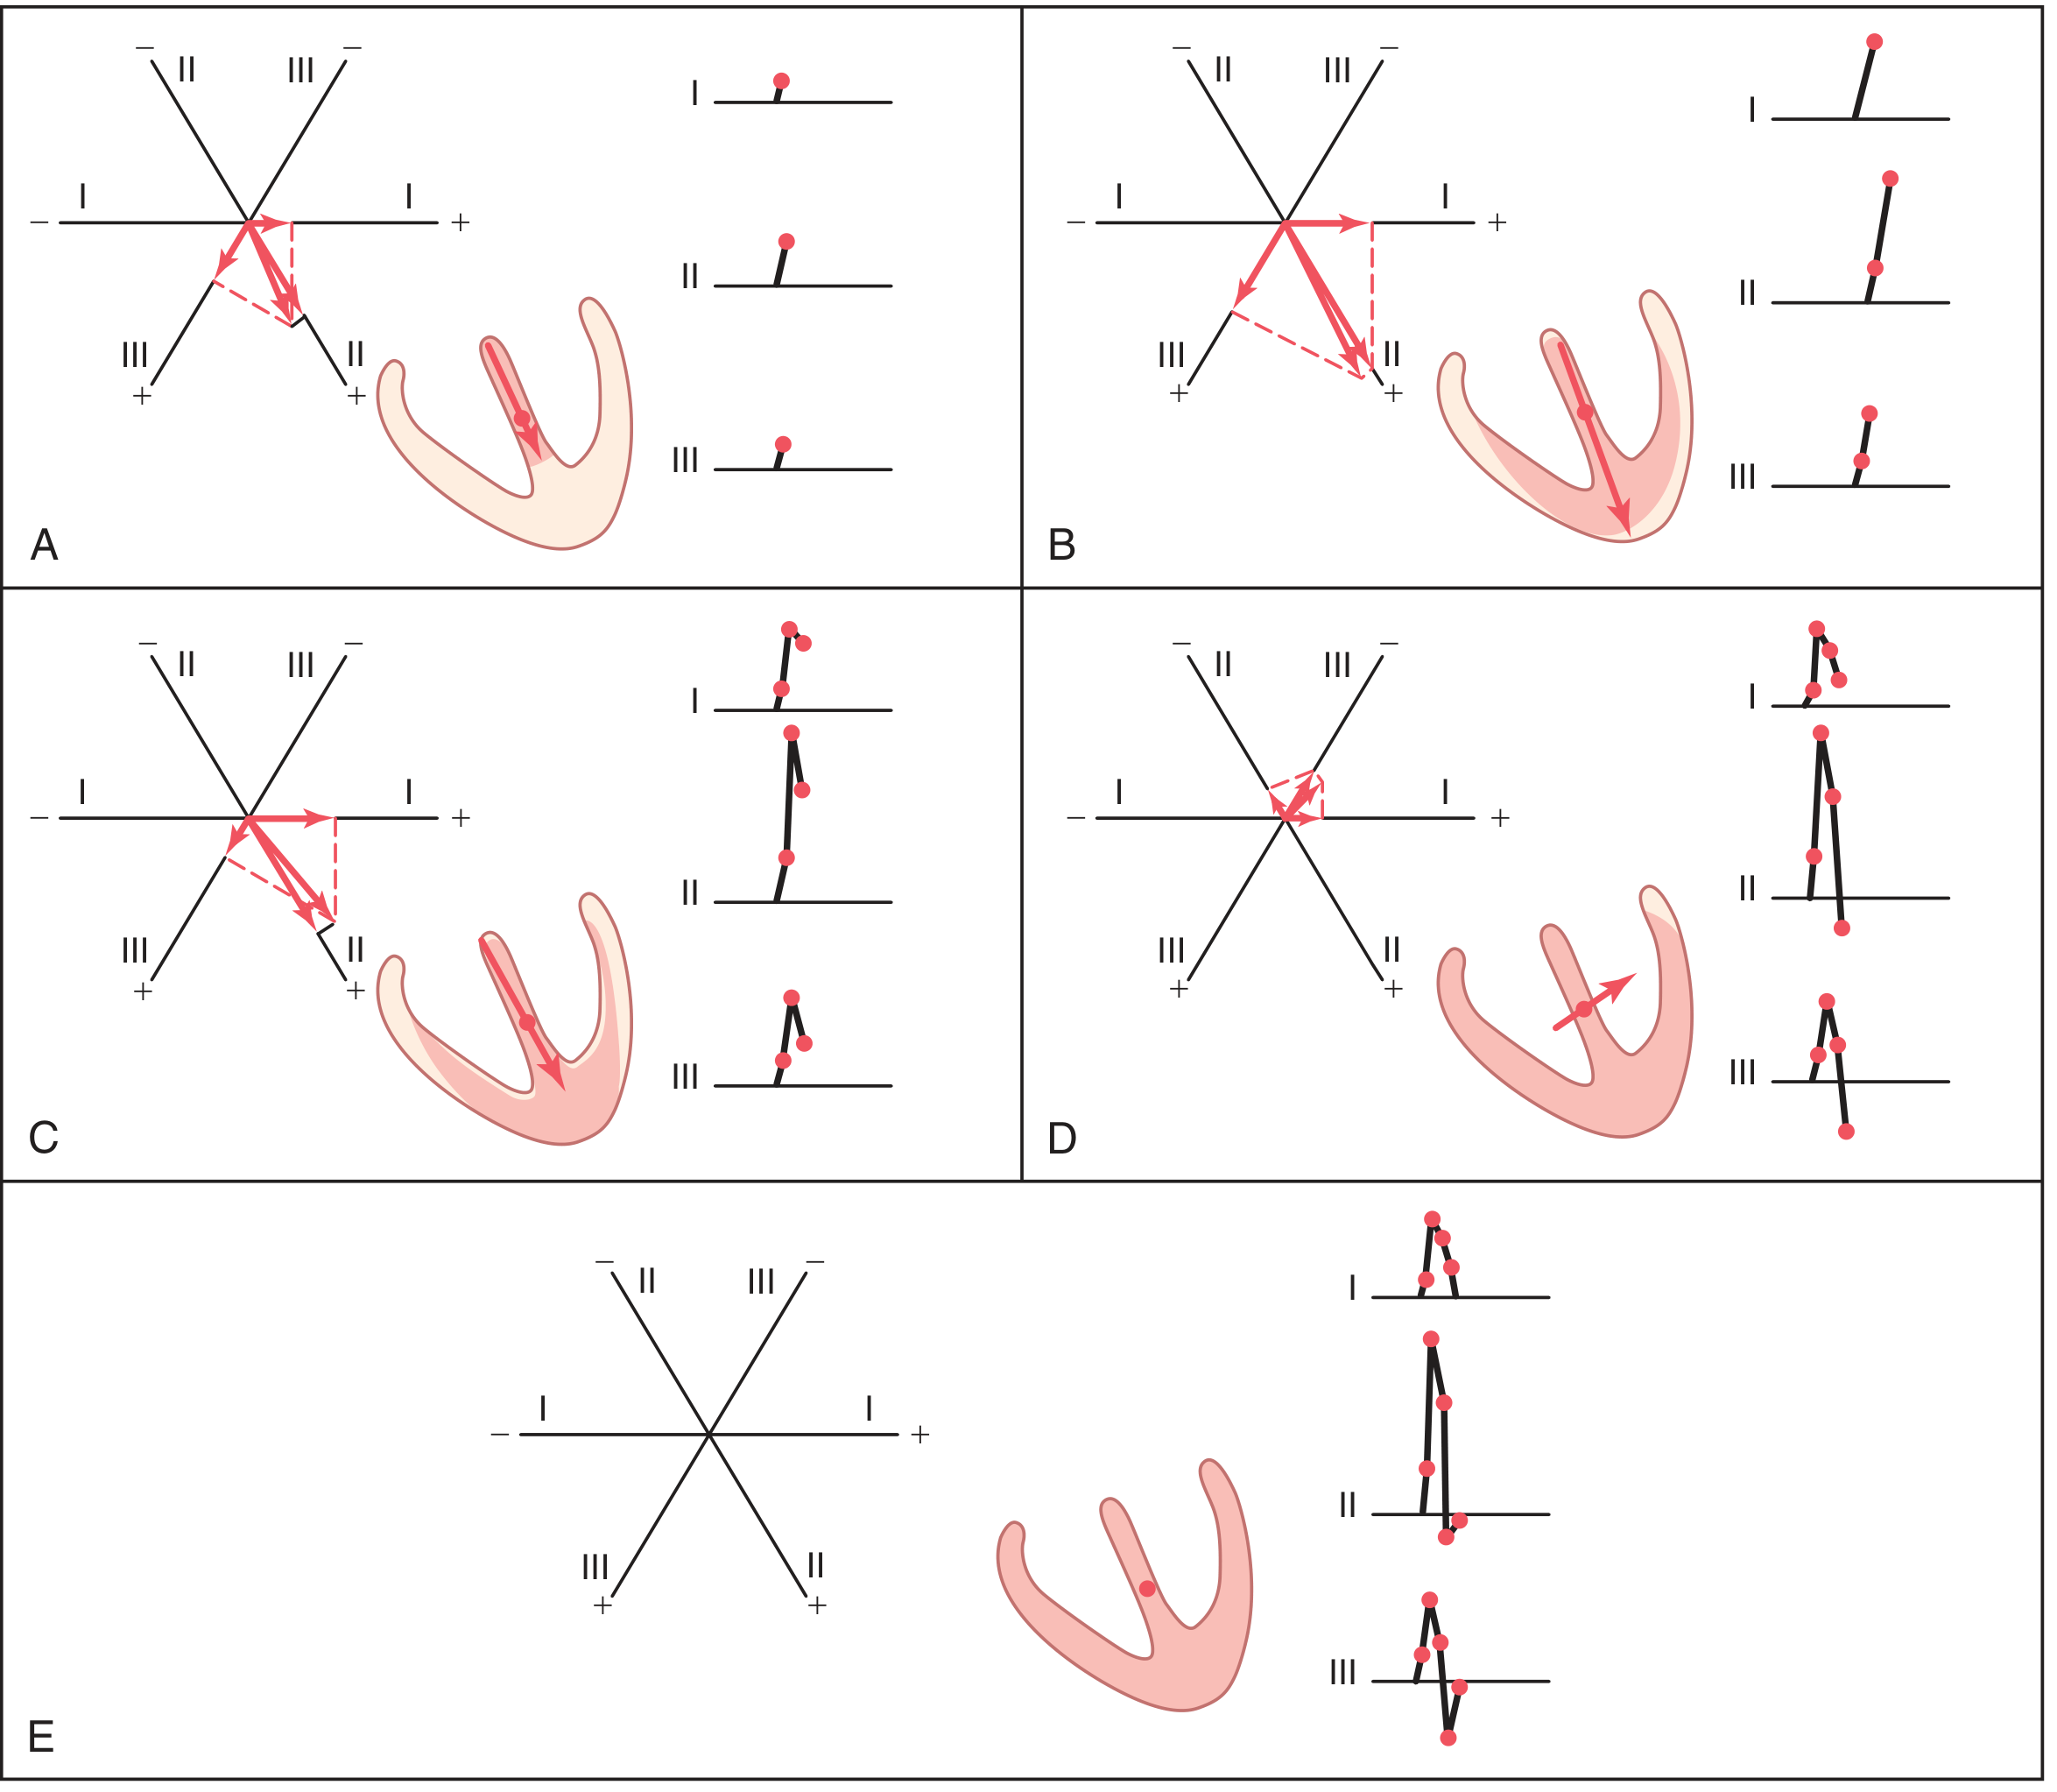
Fig. 12.7 - Ventricular vectors and QRS complex construction at successive time points (0.01-0.06 sec) - Guyton & Hall Textbook of Medical Physiology
| Time (sec) | Event | Vector direction | ECG effect |
|---|---|---|---|
| 0.01 (A) | Left septal surface depolarizes first | Small, pointing base-to-apex | Small initial deflections in all leads |
| 0.02 (B) | Both endocardial surfaces of septum depolarize | Large, toward apex | Large voltages in all leads - ascending R |
| 0.035 (C) | Spreads to ventricular free walls; apex begins going electronegative | Shifting left; shortening | Voltages begin to fall; R peaks |
| 0.05 (D) | Only left ventricular base remains polarized | Points toward base of left ventricle; small | Leads II and III go negative (S wave); Lead I still positive |
| 0.06 (E) | Entire ventricle depolarized | Zero vector | Returns to baseline - QRS complete |
- Guyton & Hall, p. 153-154
3.4 Individual Waves of the QRS
Q wave:
- A slight negative deflection at the beginning of the complex (not always present)
- Caused by initial depolarization of the left side of the septum before the right side, creating a brief weak vector from left to right
- Normal Q waves in left-sided leads (V5, V6, aVL, I) are called septal q waves and represent Phase 1 of depolarization above
R wave:
- The major positive deflection
- Represents the dominant phase of depolarization when the bulk of ventricular muscle is depolarizing, with the vector pointing toward the recording electrode
- In leads with positive axes facing the LV (I, II, aVL, aVF, V5, V6), the R wave is tall
S wave:
- The final negative deflection following the R wave
- Caused by the terminal portion of depolarization, when only the basal regions of the heart (especially the LV base and the septum near the outflow) are still being depolarized - the vector swings away from most limb leads
- Prominent in right precordial leads (V1, V2) because the left-posterior LV vector is directed away from them
3.5 Normal QRS Intervals and Voltages
| Parameter | Normal Value |
|---|---|
| QRS duration | < 0.10 sec (100 ms) |
| QRS axis (frontal) | -30° to +90° |
| R-wave in V5-V6 | < 25 mm |
| S-wave in V1 + R-wave in V5 | < 35 mm (Sokolow-Lyon) |
4. Adjacent Waveforms: P Wave and T Wave
P Wave (Atrial Depolarization)
- Depolarization begins at the sinus node and spreads in all directions over both atria
- The vector points generally downward and leftward (toward the AV node)
- Because this direction is generally positive toward leads I, II, and III, the P wave is upright in all three standard limb leads
- Normal duration: < 0.12 sec; amplitude < 2.5 mm - Guyton & Hall, p. 154
T Wave (Ventricular Repolarization)
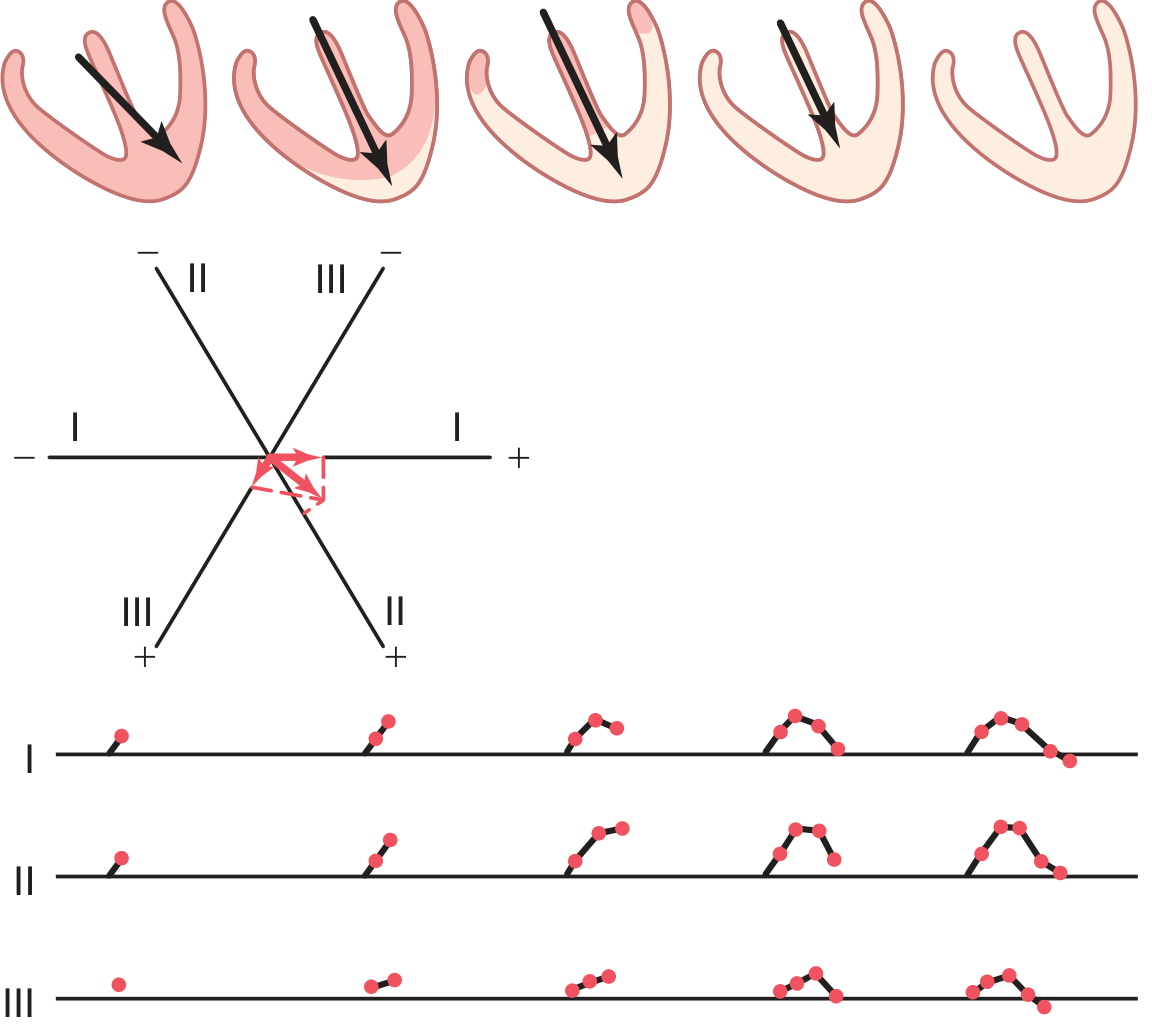
Fig. 12.8 - Generation of the T wave during ventricular repolarization - Guyton & Hall
- Repolarization begins about 0.15 seconds after depolarization and takes ~0.15 seconds
- Although endocardial areas depolarize first (and logically "should" repolarize first), high intraventricular pressure during contraction reduces coronary flow to the endocardium - so the epicardial/outer surfaces repolarize first, especially near the apex
- This means the repolarization vector points from base toward apex - the same general direction as the QRS vector
- Therefore the T wave is normally upright (positive) in the same leads that have a positive R wave
- The ST segment (between QRS end and T wave start) should be at the isoelectric baseline - Guyton & Hall, p. 154
5. The PR Interval
- The time from the onset of the P wave to the onset of the QRS complex
- Represents atrial depolarization plus the physiologic delay at the AV node
- Normal: 0.12 to 0.20 seconds
- Prolongation indicates AV block; shortening suggests pre-excitation (Wolff-Parkinson-White)
6. Summary: One Full Cardiac Cycle on the ECG
SA node fires
    ↓
Atrial depolarization → P wave (0-0.10 sec)
    ↓
AV node delay → PR segment
    ↓
Ventricular depolarization (His-Purkinje → myocardium) → QRS complex (0.06-0.10 sec)
    ↓
Ventricles electrically silent → ST segment (isoelectric)
    ↓
Ventricular repolarization → T wave (~0.15 sec duration)
    ↓
Ready for next cycle
The QRS is the centerpiece of the ECG because it reflects the depolarization of the most electrically massive structure in the heart - the ventricular myocardium. Its shape, duration, axis, and amplitude can reveal infarction, hypertrophy, conduction block, or electrolyte disturbances with great diagnostic precision.
Sources:
- Guyton and Hall Textbook of Medical Physiology (Chapters 11-12, p. 143-154)
- Harrison's Principles of Internal Medicine, 22nd Ed. (Chapter 247, p. 1913)
- Goldman-Cecil Medicine International Edition (Chapter 42, p. 519-521)
- Gray's Anatomy for Students (Chapter 3, p. 247-250)
What is the timing of the P wave, PR interval, QRS complex, ST segment, and T wave in the electrocardiograph?
Here's a quick answer while I pull the exact values from the textbooks:
Quick answer: P wave ~0.08-0.10 sec, PR interval 0.12-0.20 sec, QRS complex 0.06-0.10 sec, ST segment ~0.08-0.12 sec, T wave ~0.15-0.25 sec. Total cardiac cycle at normal heart rate is about 0.8 sec (one RR interval).
Searching sources...
Finding Sources
Finding Sources
Finding Sources
Finding Sources
Reading File
Reading File
Reading File
Loading Image
I now have everything needed. Here is the complete, authoritative answer:
ECG Waveform Timing - Normal Values

Fig. 4.17 - The ECG measured from lead II. - Costanzo Physiology, 7th Edition
Complete Timing Reference Table
| Component | Normal Duration | What It Represents |
|---|---|---|
| P wave | < 0.12 sec (< 120 ms) | Atrial depolarization |
| PR interval | 0.12 - 0.20 sec (120-200 ms) | Atrial depol. + AV node conduction delay |
| PR segment | ~0.06 - 0.10 sec | AV node delay only (isoelectric) |
| QRS complex | < 0.12 sec (< 120 ms) | Ventricular depolarization |
| ST segment | ~0.08 - 0.12 sec | Isoelectric period between depol. and repol. |
| T wave | ~0.15 - 0.25 sec | Ventricular repolarization |
| QT interval | ~0.35 - 0.44 sec (rate-dependent) | Total ventricular electrical activity |
| R-R interval | ~0.8 sec at 75 bpm | One full cardiac cycle |
Each Component Explained
1. P Wave - Duration < 0.12 sec
- Represents atrial depolarization spreading from the SA node across both atria
- Duration reflects conduction time through the atria
- If conduction velocity through the atria slows (e.g., atrial hypertrophy), the P wave widens
- Atrial repolarization is NOT seen on a normal ECG - it is buried within and hidden by the QRS complex, because ventricular muscle mass far exceeds atrial mass
- Costanzo Physiology, 7th Ed., p. 148
2. PR Interval - 0.12 to 0.20 sec (160 ms typical)
- Measured from the beginning of the P wave to the beginning of the QRS complex
- Includes two components:
- The P wave itself (atrial conduction time)
- The PR segment (isoelectric flat line = AV node delay)
- The PR segment represents the time for the impulse to traverse the AV node - this physiologic delay allows atrial contraction to finish filling the ventricles before ventricular contraction begins
- Sympathetic stimulation shortens the PR (faster AV conduction); parasympathetic stimulation lengthens it
- PR > 0.20 sec = first-degree AV block
- PR < 0.12 sec = pre-excitation (e.g., Wolff-Parkinson-White syndrome)
- On the standard ECG paper (25 mm/sec), 0.12-0.20 sec = 3 to 5 small boxes
- Medical Physiology (Boron & Boulpaep), p. 809; Costanzo Physiology, p. 149
3. QRS Complex - < 0.12 sec (< 120 ms)
- Measured from the beginning to the end of the QRS complex
- Represents ventricular depolarization via the His-Purkinje system and ventricular myocardium
- An important physiological point: even though the ventricles are far larger than the atria, the QRS duration is similar to the P wave duration. This is because the His-Purkinje system conducts much faster than the atrial conduction system, allowing the whole ventricular mass to depolarize nearly simultaneously
- QRS > 0.12 sec = bundle branch block or ventricular conduction delay
- Costanzo Physiology, p. 149
4. ST Segment - Isoelectric (~0.08-0.12 sec)
- Runs from the end of the QRS (J point) to the beginning of the T wave
- Corresponds to the plateau phase (phase 2) of the ventricular action potential - all ventricular cells are depolarized, so no net current flows and the segment is flat (isoelectric)
- Should be at the baseline (0 mV)
- ST elevation = acute myocardial injury/infarction (STEMI) or pericarditis
- ST depression = ischemia, subendocardial infarction, or digoxin effect
- Medical Physiology (Boron & Boulpaep), p. 809
5. T Wave - ~0.15 sec duration
- Represents ventricular repolarization
- Begins approximately 0.15 sec after the onset of ventricular depolarization
- Repolarization proceeds from epicardium to endocardium (opposite direction to depolarization), so the T wave deflects in the same direction as the main QRS in most leads
- Total duration from T wave onset to end is approximately 0.15 sec
- Abnormalities: T inversion (ischemia, LVH, RBBB), peaked T (hyperkalemia), flat T (hypokalemia)
6. QT Interval - ~0.35-0.44 sec (rate-dependent)
- Measured from the beginning of the QRS to the end of the T wave
- Encompasses: QRS + ST segment + T wave
- Represents the total duration of ventricular electrical activity (depolarization through repolarization) - i.e., the total ventricular action potential
- Rate-dependent: shortens at faster heart rates, lengthens at slower rates
- Corrected QT (QTc) using Bazett's formula: QTc = QT / √(RR interval)
- Normal QTc: < 440 ms in men, < 460 ms in women
- Prolonged QT = risk of torsades de pointes (a dangerous ventricular arrhythmia)
- Medical Physiology (Boron & Boulpaep), p. 809
7. R-R Interval - Heart Rate Dependent
- The time between two consecutive R waves
- Equals one full cardiac cycle length
- At a normal heart rate of 75 bpm: R-R = 0.80 sec (800 ms)
- Formula: Heart rate (beats/min) = 60 / R-R interval (in seconds)
- e.g., R-R of 0.8 sec → 60/0.8 = 75 bpm
- e.g., R-R of 0.66 sec → 60/0.66 = ~90 bpm
- Costanzo Physiology, p. 149
Summary: Timing at a Glance
P wave         |----| < 0.12 sec
PR interval    |----------| 0.12-0.20 sec
  PR segment         |--| ~0.06-0.10 sec (AV node delay)
QRS complex           |--| < 0.12 sec
ST segment               |---| isoelectric
T wave                       |------| ~0.15 sec
QT interval           |----------------| 0.35-0.44 sec
Key distinction: An interval includes the wave(s) within it (e.g., PR interval includes the P wave + PR segment). A segment refers only to the flat line between waves (e.g., PR segment, ST segment) - it does NOT include any wave. - Medical Physiology (Boron & Boulpaep), p. 807
Sources:
- Medical Physiology, Boron & Boulpaep - p. 809
- Costanzo Physiology, 7th Edition - p. 148-149
This is a shared conversation. Sign in to Orris to start your own chat.