
Ecg
Asking for Preferences
What would you like to know about ECG?
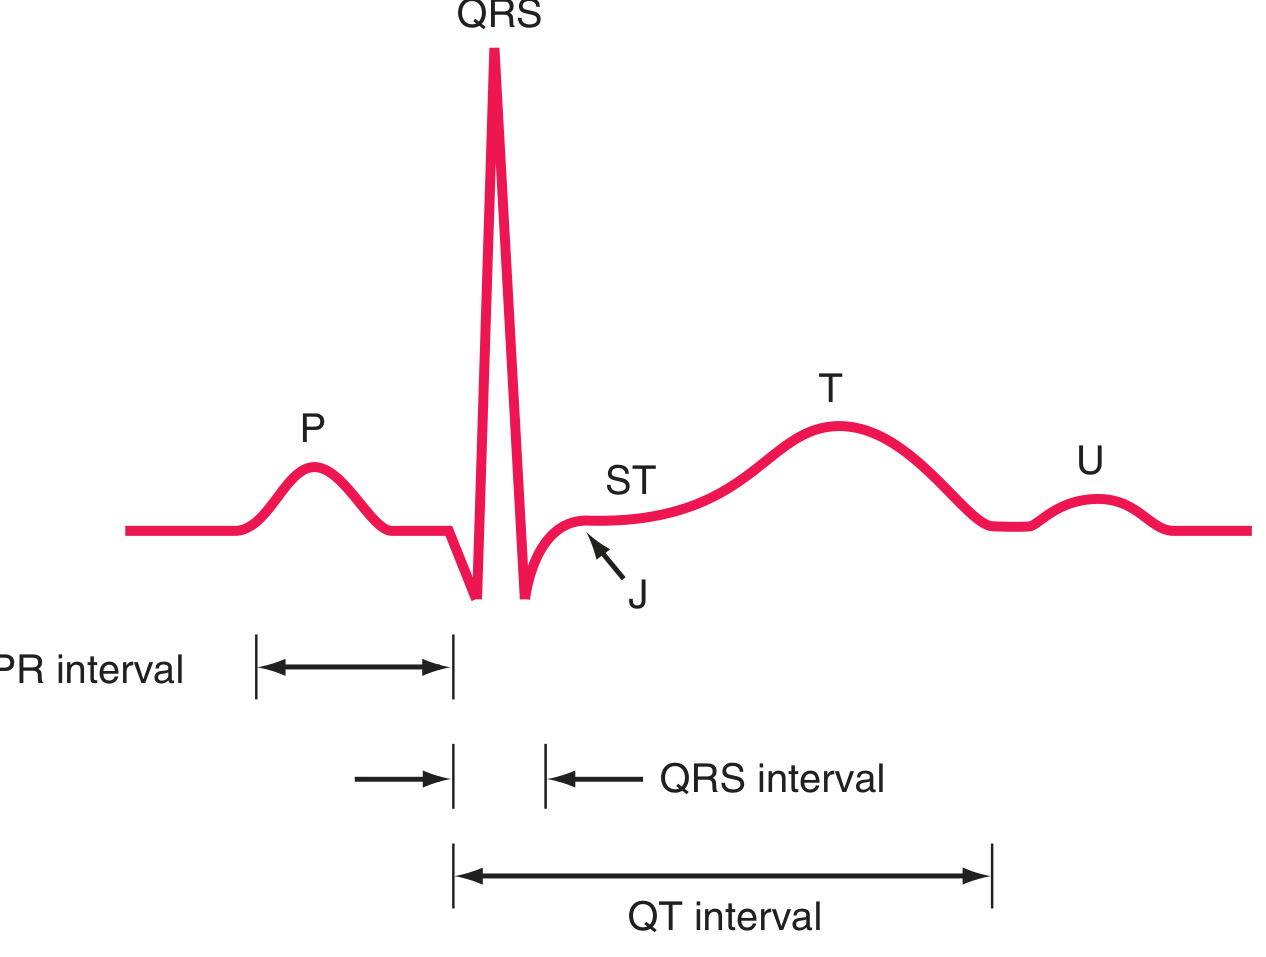
The ECG (electrocardiogram) records the electrical activity of the heart from 12 different angles (leads). Each deflection on the trace corresponds to a specific event in the cardiac cycle: P wave (atrial depolarization), QRS complex (ventricular depolarization), and T wave (ventricular repolarization). A systematic approach - rate, rhythm, axis, intervals, then waveform morphology - is the standard way to read any ECG.
Searching sources...
Reading File
Finding Sources
Finding Sources
Finding Sources
Finding Sources
Finding Sources
Reading File
Finding Sources
Finding Sources
Reading File
Reading File
I now have excellent foundational content from Harrison's. Let me read the earlier part of this ECG chapter which should contain the basic principles.
Finding Sources
Reading File
Reading File
Let me find the ECG basics section directly within the Harrison's chapter:
Finding Sources
Reading File
Excellent! Found the core content. Let me read a bit more to get the interval specifics and lead information:
Reading File
I now have comprehensive content from Harrison's Principles of Internal Medicine. Let me also fetch the key ECG waveform diagram image to include in the answer:
Loading Image
Loading Image
I now have everything needed for a thorough, well-illustrated answer. Here is the complete guide to ECG basics:
ECG: Basic Principles & How to Read
1. What an ECG Records
The electrocardiogram records the electrical activity of the heart from the body surface. Because cardiac depolarization and repolarization wavefronts have both direction and magnitude, they can be represented as vectors, and each ECG lead captures the projection of that vector onto a specific spatial orientation - like different camera angles of the same electrical event.
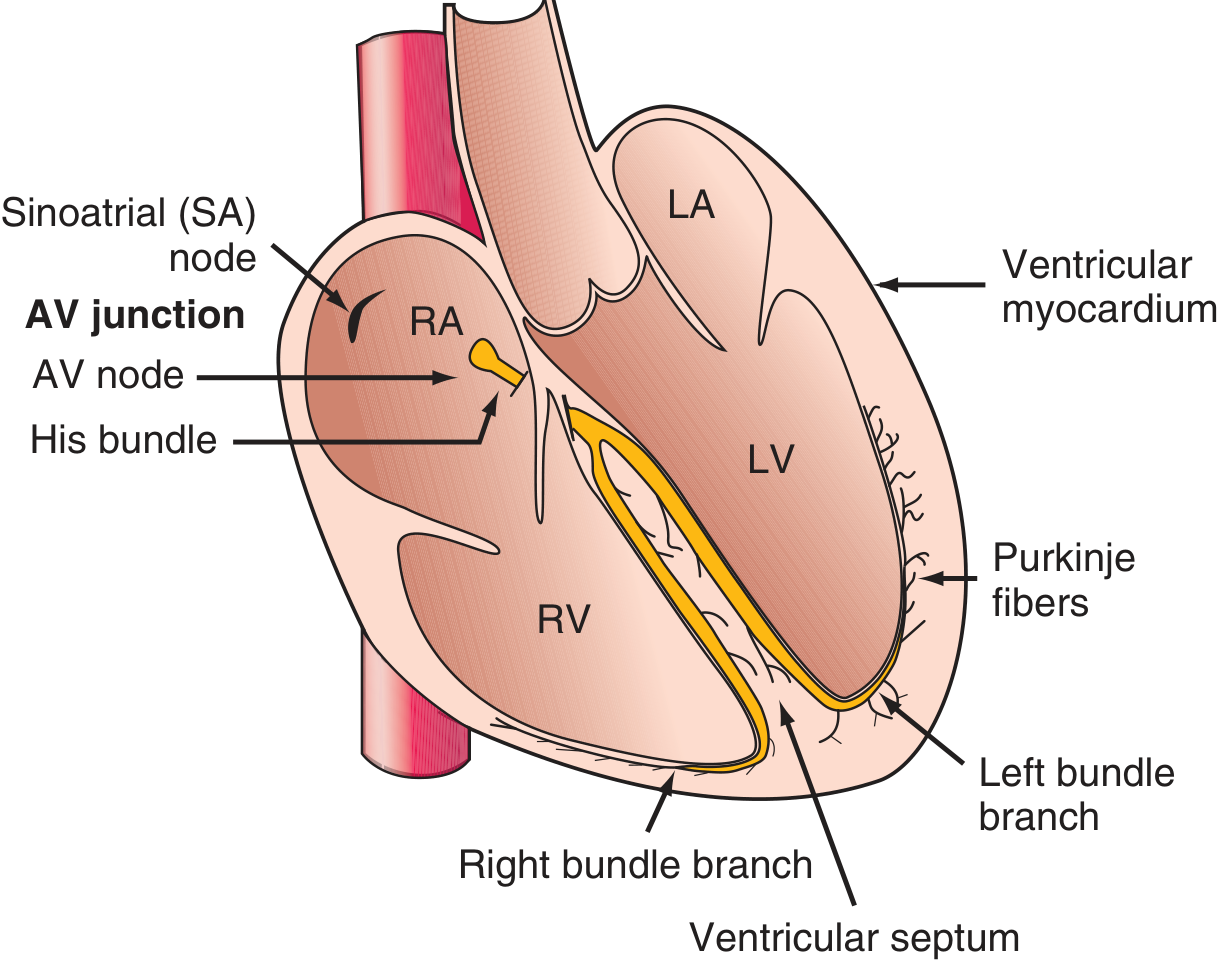
The impulse originates in the sinoatrial (SA) node, spreads through the atria, delays at the AV node/His bundle (AV junction), then rapidly distributes through the right and left bundle branches via the Purkinje fibers to the ventricular myocardium. Depolarization travels from endocardium to epicardium.
2. Basic Waveforms and Intervals
| Waveform / Segment | Represents | Normal Value |
|---|---|---|
| P wave | Atrial depolarization | <120 ms duration |
| PR interval | Atrial depolar. + AV node delay | 120-200 ms |
| QRS complex | Ventricular depolarization | ≤100-110 ms |
| J point | Junction of QRS end and ST start | At isoelectric baseline |
| ST segment | Plateau phase of ventricular action potential (isoelectric) | Flat, on baseline |
| T wave | Ventricular repolarization (phase 3) | Upright in most leads |
| QT interval | Total ventricular depolar. + repolar. | Rate-corrected (QTc): ≤450 ms men, ≤460 ms women |
| U wave | Possibly Purkinje fiber repolarization | Small, same polarity as T |
Relationship to Action Potential Phases
- Phase 0 (rapid upstroke, Na+ influx) → onset of QRS
- Phase 2 (plateau) → isoelectric ST segment
- Phase 3 (active repolarization) → T wave
Drugs or electrolyte changes affect specific phases - e.g., flecainide widens QRS by slowing phase 0; amiodarone/hypocalcemia prolong QT by lengthening phases 2-3; hypercalcemia/digoxin shorten QT.
3. ECG Paper and Measurements
Standard recording speed is 25 mm/s:
- Each small box (1 mm) = 40 ms (0.04 s)
- Each large box (5 mm) = 200 ms (0.20 s)
- Vertically: 1 mV = 10 mm (standard calibration)
Heart rate calculation:
- Count large boxes between two R waves → divide 300 by that number
- Or: count small boxes between two R waves → divide 1500 by that number
4. The 12 Leads
The 12 conventional leads are split into two groups:
| Group | Leads | Plane |
|---|---|---|
| Limb (extremity) leads | I, II, III, aVR, aVL, aVF | Frontal |
| Precordial (chest) leads | V1, V2, V3, V4, V5, V6 | Horizontal |
- Limb leads form a hexaxial diagram; each has a specific angular orientation relative to Lead I (0°). The mean electrical axis of the QRS is measured against this system.
- Precordial leads are placed across the chest (V1 right sternal border → V6 mid-axillary line). They capture the horizontal plane.
- Each lead is like a different camera angle looking at atrial and ventricular depolarization/repolarization.
5. Systematic Approach to Reading an ECG (14 Steps)
Per Harrison's Principles of Internal Medicine, analyze every ECG in this order:
- Standardization & technical features - Is calibration correct? Any artifacts or lead misplacements?
- Rhythm - Regular or irregular? What is the pacemaker?
- Heart rate - Bradycardia (<60), normal (60-100), or tachycardia (>100)?
- PR interval / AV conduction - Normal 120-200 ms; prolonged = AV block
- QRS interval - Normal ≤100-110 ms; widened = bundle branch block or ventricular origin
- QT / QTc interval - Prolonged QTc increases torsades risk
- Mean QRS electrical axis - Normal: -30° to +90° (frontal plane)
- P waves - Present? Morphology? One P per QRS?
- QRS voltages - High = hypertrophy; low = effusion, obesity, COPD
- Precordial R-wave progression - Normal transition V1 to V6 (rS to Rs)
- Abnormal Q waves - Pathologic Q (>40 ms or >25% of R height) = old infarction
- ST segments - Elevation or depression?
- T waves - Inversions, peaked T, or biphasic T?
- U waves - Prominent U = hypokalemia; inverted U = ischemia
"Many mistakes in ECG interpretation are errors of omission. Therefore, a systematic approach is essential." - Harrison's Principles of Internal Medicine, 22nd Ed.
6. Normal vs. Abnormal at a Glance
| Finding | Normal | Abnormal (clue to) |
|---|---|---|
| PR interval | 120-200 ms | >200 ms → AV block; <120 ms → pre-excitation (WPW) |
| QRS duration | ≤110 ms | >120 ms → BBB or ventricular rhythm |
| QTc | ≤450 ms (M), ≤460 ms (F) | Prolonged → drug toxicity, hypokalemia, channelopathy |
| ST segment | Isoelectric | Elevation → STEMI, pericarditis; Depression → ischemia, NSTEMI |
| Axis | -30° to +90° | Left axis → LAFB, inferior MI; Right axis → RVH, posterior MI |
| Q waves | Septal q's in lateral leads | Pathologic Q → prior MI |
Source: Harrison's Principles of Internal Medicine, 22nd Ed. (2025), Chapter 247 - Electrocardiography
This is a shared conversation. Sign in to Orris to start your own chat.