
Enumerate and describe role of biomarkers - in diagnosis, pathogenesis, treatment stategies and prevention of various ocular morbidities
biomarkers ocular disease diagnosis pathogenesis
PMID: 40956021
PMID: 39939938
PMID: 38087257
PMID: 36380089
PMID: 38254702
biomarkers ocular disease diagnosis prognosis treatment prevention review 2024
optic disc cupping glaucoma OCT retinal nerve fiber layer
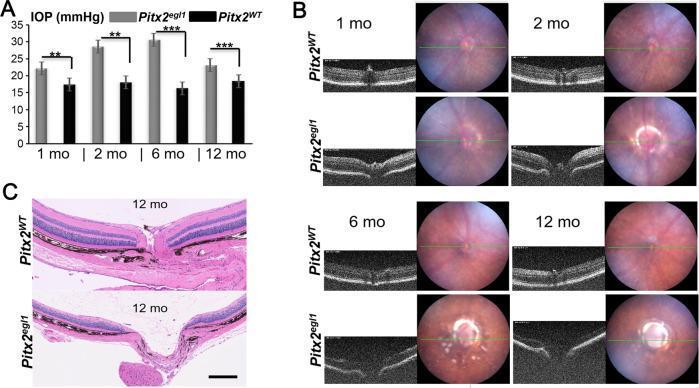
This composite educational resource illustrates an early-onset glaucoma phenotype in a mouse model (Pitx2egl1) compared to wild-type (Pitx2WT). Panel A contains a bar graph showing longitudinal intraocular pressure (IOP) data at 1, 2, 6, and 12 months. Pitx2egl1 mice exhibit significantly elevated IOP (peaking around 30 mmHg at 6 months) compared to the stable ~18 mmHg in controls. Panel B displays longitudinal diagnostic imaging, combining fundus photography and Optical Coherence Tomography (OCT). In mutants, fundus images reveal a characteristic partial white ring around the optic cup, while OCT B-scans demonstrate progressive optic nerve cupping and excavation starting as early as 2 months. Panel C presents H&E-stained histological sections of the optic nerve head at 12 months. The mutant section shows severe glaucomatous cupping (excavation) and thinning of the inner retinal layers, specifically the retinal nerve fiber layer (RNFL), compared to the healthy morphology of the wild-type. This visual summarizes the clinical signs of hypertensive glaucoma including elevated IOP, structural optic disc changes, and neurodegeneration.
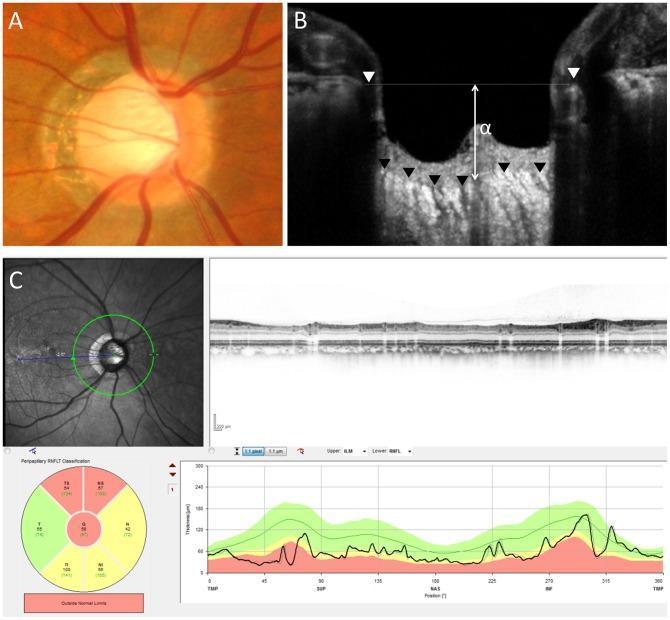
This composite image illustrates diagnostic findings of primary open-angle glaucoma through multimodal ophthalmic imaging. Panel A is a fundus photograph displaying a glaucomatous optic disc characterized by a large vertical cup-to-disc ratio, significant central excavation (cupping), and thinning of the neuroretinal rim, particularly in the superior and inferior poles. Panel B presents a vertical Optical Coherence Tomography (OCT) B-scan of the optic nerve head, measuring the distance (α = 406 µm) between the Bruch's membrane opening (BMO) reference line and the anterior surface of the lamina cribrosa. Panel C shows a circular OCT scan and accompanying quantitative analysis of the circumpapillary retinal nerve fiber layer (cpRNFL). The analysis indicates a significantly reduced mean cpRNFL thickness of 58 µm. The included TSNIT (Temporal, Superior, Nasal, Inferior, Temporal) thickness graph and color-coded sectoral map demonstrate thinning outside normal limits (red sectors), particularly in the superior and nasal regions. This clinical case highlights the correlation between structural optic disc changes and the quantitative loss of the retinal nerve fiber layer in glaucomatous neuropathy.
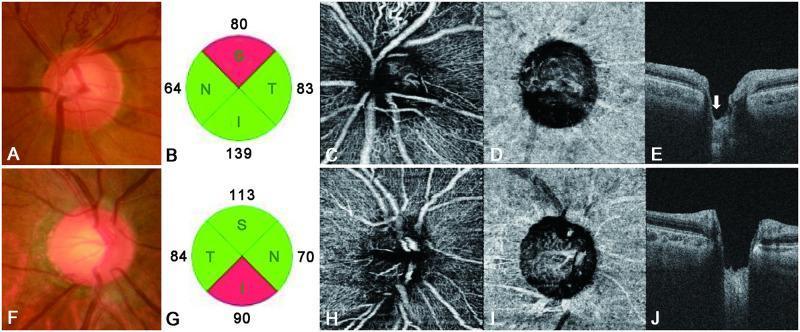
A multi-panel comparison chart using fundus photography, OCT, and OCT angiography (OCTA) to differentiate between Branch Retinal Vein Occlusion (BRVO, top row A-E) and Normal-Tension Glaucoma (NTG, bottom row F-J). Panels A and F show optic disc morphology; BRVO displays focal superior disc notching and retinal nerve fiber layer (RNFL) defects, while NTG shows more generalized and deeper disc cupping. Panels B and G provide circular sector maps of RNFL thickness. Panels C, D, H, and I are en-face OCTA scans of the superficial capillary plexus and choriocapillaris. In BRVO (C), there is a significant focal decrease in peripapillary vessel density in the superotemporal segment corresponding to the site of occlusion. In NTG (H, I), there is a more diffuse reduction in vessel density, particularly in the choriocapillaris layer. Cross-sectional Swept-Source OCT B-scans (E, J) illustrate the lamina cribrosa (LC). The BRVO eye exhibits focal, irregular LC thinning (white arrow), whereas the NTG eye demonstrates deeper, more uniform disc cupping and generalized LC structural changes.
age-related macular degeneration drusen fundus photograph OCT
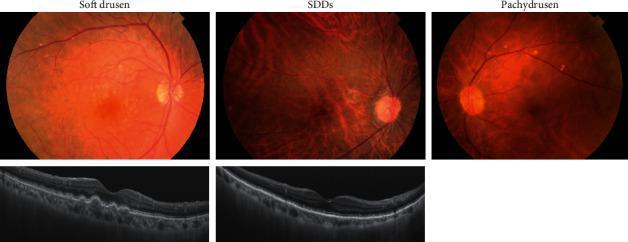
This medical comparison image displays fundus color photographs and corresponding swept-source optical coherence tomography (OCT) scans for three phenotypes of age-related macular degeneration (AMD): soft drusen, subretinal drusenoid deposits (SDDs), and pachydrusen.
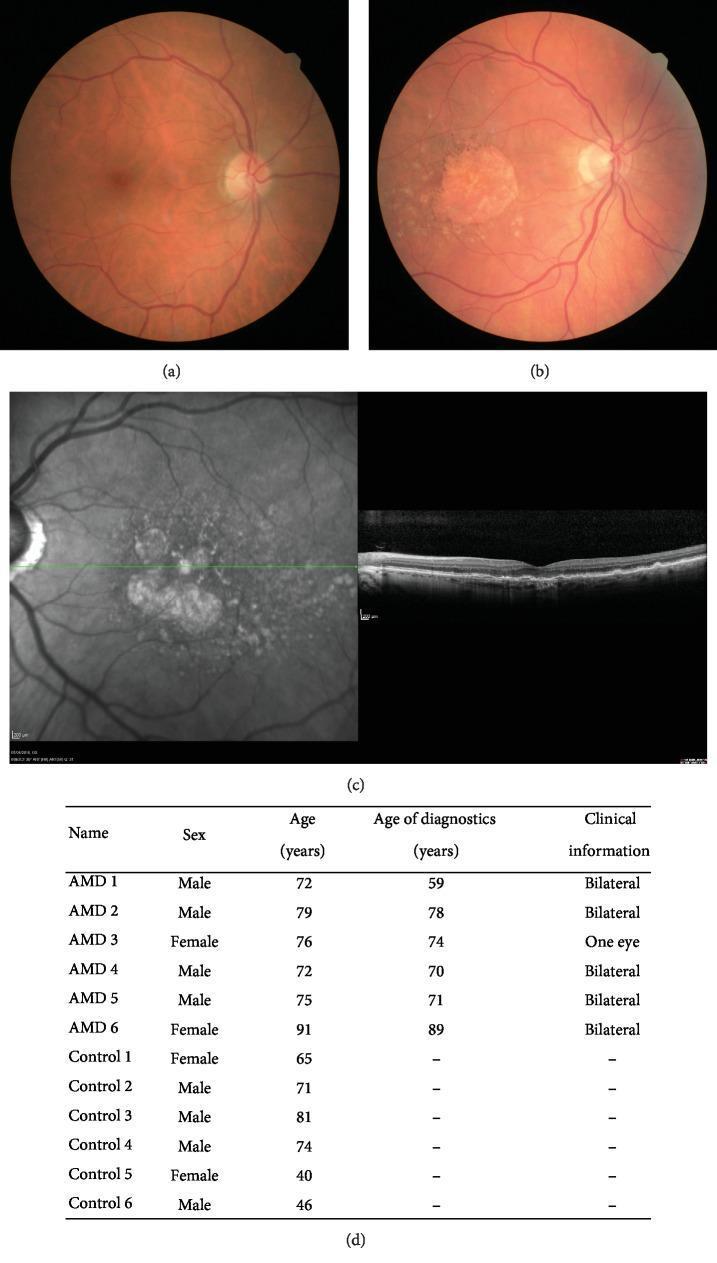
This composite clinical figure illustrates diagnostic findings for age-related macular degeneration (AMD). (a) Color fundus photograph of a healthy eye showing a normal optic disc, clear macular region, and standard vascular distribution. (b) Color fundus photograph of a patient with atrophic AMD, demonstrating geographic atrophy in the macula, characterized by a well-demarcated area of depigmentation, alongside multiple yellowish drusen deposits. (c) Optical Coherence Tomography (OCT) imaging of an AMD patient. The left panel shows a grayscale fundus infrared reflectance image with visible drusen; the right panel presents a cross-sectional Spectral-Domain OCT (SD-OCT) scan. The scan reveals characteristic pathology including thinning of the retinal layers, disruption of the retinal pigment epithelium (RPE) and photoreceptor layers, and sub-RPE deposits (drusen). (d) Comparison chart detailing demographic and clinical data for six AMD patients and six control subjects, including age at diagnosis and disease laterality. The image serves as an educational resource for identifying clinical signs of non-exudative (dry) AMD across different imaging modalities.
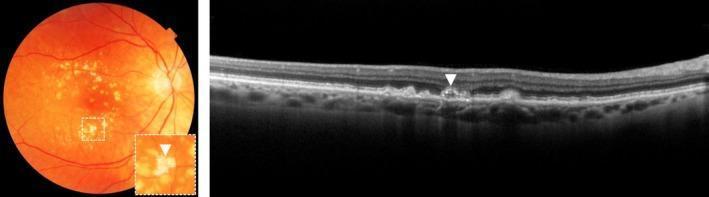
A multi-modal ophthalmic diagnostic image demonstrating calcified drusen in age-related macular degeneration (AMD). The left panel is a Color Fundus Photograph (CFP) showing a wide-field view of the retina with numerous yellow-white subretinal deposits concentrated in the macular region. A magnified inset (indicated by a white arrow) highlights a specific druse with a glistening, bright white appearance, characteristic of calcification. The right panel is a corresponding Optical Coherence Tomography (OCT) cross-section of the retina. The OCT demonstrates focal elevations of the retinal pigment epithelium (RPE) layer. The arrow indicates a specific calcified druse characterized by a heterogeneous, hyperreflective internal structure located between the RPE and Bruch's membrane. This hyperreflectivity suggests a high-density crystalline or mineralized composition. Clinically, such calcification is often associated with drusen regression and a higher risk of progression to geographic atrophy (GA). The image serves as an educational tool for distinguishing drusen subtypes based on reflectivity and fundus appearance.
diabetic retinopathy fundus photograph microaneurysms exudates
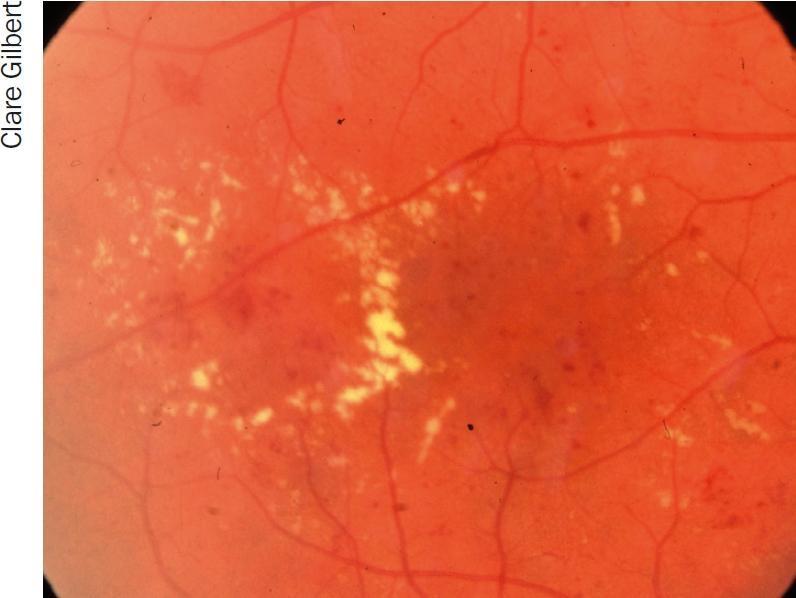
This clinical photograph of a human fundus illustrates hard exudates in a circinate pattern, a classic finding in diabetic retinopathy. The image shows numerous small, yellowish-white, well-defined deposits of lipid and protein within the retina. These exudates are arranged in a roughly circular or ring-like (circinate) formation, often indicating a central cluster of leaking microaneurysms or damaged retinal capillaries. The background retina appears reddish-orange with visible branching retinal vasculature. In addition to the hard exudates, subtle dark red spots are visible, representing intraretinal hemorrhages or microaneurysms. This visual is characteristic of clinically significant macular edema or non-proliferative diabetic retinopathy, where chronic vascular permeability leads to the accumulation of these lipoprotein residues. The contrast between the bright, refractile exudates and the darker retinal background highlights the pathological distribution useful for teaching diagnostic ophthalmology and diabetic eye disease management.
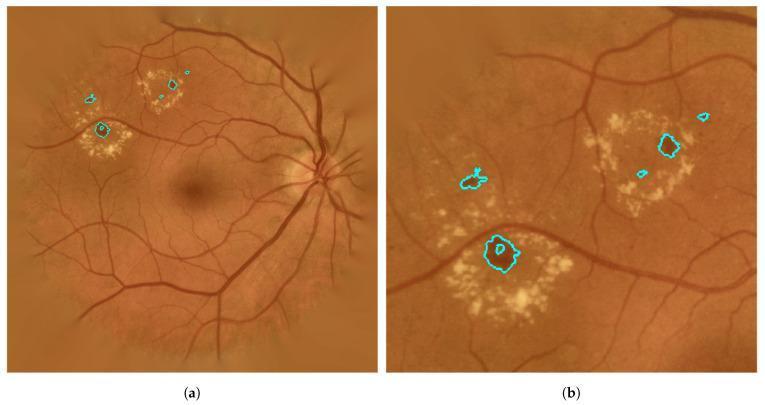
This diagnostic image displays a color fundus photograph of a human retina, highlighting clinical manifestations of diabetic retinopathy. The image is presented in two panels: (a) a wide-field view of the posterior pole and (b) a magnified view focusing on specific retinal lesions (RLs). Visible anatomical landmarks include the optic disc on the right, the macula centrally, and the branching retinal vasculature. Pathological findings consist of multiple bright, yellowish-white hard exudates clustered in the macula and paramacular regions. These exudates appear as granular or homogeneous deposits with varied morphologies. Interspersed among these are dark red, punctate microaneurysms and small hemorrhages. Cyan-colored digital contours outline definitively detected lesions, demonstrating an automated segmentation approach for diabetic lesion classification. The image serves as an educational tool for ophthalmology, specifically for identifying and segmenting vascular complications and lipid deposits associated with chronic retinal disease. The clinical focus is on the detection and differentiation of microaneurysms and exudates within a non-proliferative diabetic retinopathy context.
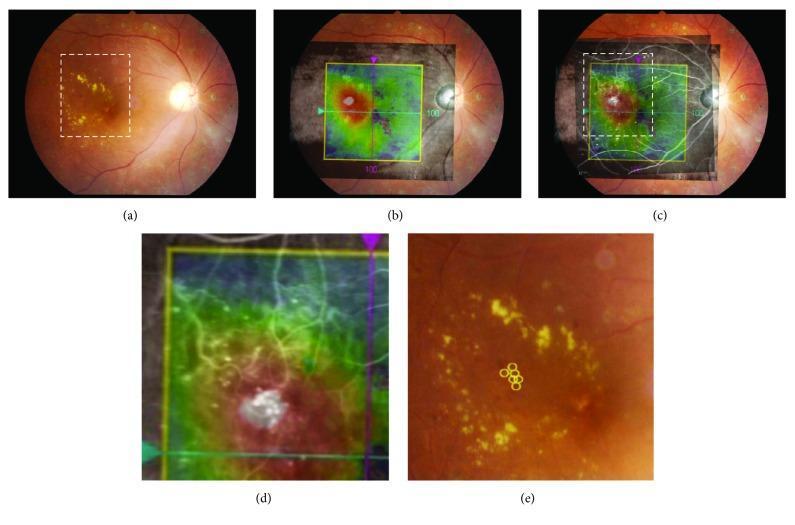
This composite figure illustrates the Merged Image-Guided Photocoagulation (MIG-PC) protocol for treating focal diabetic macular edema (DME). The sequence comprises: (a) A color ocular fundus photograph showing focal DME characterized by a circinate ring of yellowish hard exudates in the macula. (b) An Optical Coherence Tomography (OCT) thickness map overlaid on the fundus photograph, with red/white areas indicating significant retinal thickening. (c) Integration of Fluorescein Angiography (FA) with the OCT map and fundus image to identify leakage points. (d) A high-magnification view of the target area, showing the spatial relationship between the thickened retina and underlying vascular leakage. (e) Final marking of microaneurysms (MAs) with yellow circular annotations to guide laser photocoagulation. The pedagogical focus is the multi-modal integration of diagnostic imaging (OCT, FA, and fundus photography) to enhance the precision of laser treatment for diabetic retinopathy. Key structures include the macula, retinal vasculature, and pathological features like hard exudates and microaneurysms.
Biomarkers in Ocular Morbidities
1. Glaucoma
2. Diabetic Retinopathy (and other diabetic ocular complications)
3. Age-Related Macular Degeneration (AMD)
4. Dry Eye Disease / Ocular Surface Disease
5. Uveitis (immune-mediated)
6. Keratoconus
7. Ocular Graft-versus-Host Disease (oGVHD)
Cross-Cutting Themes
- Theranostic overlap: VEGF exemplifies a biomarker that is simultaneously a diagnostic/prognostic indicator and the direct drug target (anti-VEGF therapy) across AMD, diabetic retinopathy, and retinal vein occlusion.
- Non-invasive sampling: Tears are increasingly favored over aqueous/vitreous sampling because they are accessible, repeatable, and suitable for remote/resource-limited screening.
- Imaging as biomarker: OCT, OCT-angiography, and corneal hysteresis are now considered structural/functional biomarkers with prognostic value comparable to molecular markers, especially in glaucoma and AMD.
- Retina as a systemic window: Retinal vascular imaging biomarkers are increasingly studied as surrogates for systemic disease (Alzheimer's, cardiovascular disease, peripheral artery disease), extending "ocular biomarker" utility beyond primary eye disease.
- Evidence caveat: The 2025 glaucoma umbrella review found the majority of proposed biomarkers (55%) have only "weak" evidence grading - highlighting that while biomarker discovery in ophthalmology is active, few markers currently meet high-certainty validation thresholds for routine clinical use.
Write according to a long question fir pg ophthalmology exam
Long Essay Question
INTRODUCTION
| Source | Examples |
|---|---|
| Ocular fluids | Tears, aqueous humor, vitreous |
| Ocular imaging (structural/functional biomarkers) | OCT, OCT-angiography, corneal hysteresis |
| Blood/Serum | Cytokines, antioxidant status, autoantibodies |
| Genetic material | HLA typing, complement gene variants |
CLASSIFICATION OF OCULAR BIOMARKERS
- Tear film biomarkers - cytokines, MMP-9, lactoferrin, lipocalin
- Aqueous humor biomarkers - TGF-beta, VEGF, complement proteins
- Vitreous biomarkers - VEGF, IL-6, IL-8
- Serum/systemic biomarkers - CRP, total antioxidant status, autoantibodies (ANA, HLA-B27)
- Imaging-based (structural) biomarkers - corneal hysteresis, RNFL thickness, OCT-A vessel density
- Genetic biomarkers - CFH, ARMS2 (AMD); HLA-B27 (uveitis)
- Diagnostic
- Pathogenetic (mechanistic)
- Predictive of treatment response
- Prognostic/monitoring (disease progression)
- Preventive/risk-stratifying
DISEASE-WISE DISCUSSION
1. GLAUCOMA
- Corneal hysteresis (CH) - measured by Ocular Response Analyzer; defined as the difference between inward and outward applanation pressures during an air-jet pulse; reflects viscoelastic damping of the cornea (not stiffness).
- Graded as "highly suggestive evidence" biomarker in a 2025 umbrella review of 36 meta-analyses, along with IOP and myopia (ocular factors) and serum total antioxidant status (systemic biomarker).
- Aqueous humor markers - TGF-beta2, matrix metalloproteinases (MMP-2, MMP-9), oxidative stress markers - reflect trabecular meshwork extracellular matrix remodeling and increased outflow resistance.
- Low CH predicts a greater risk of glaucomatous progression - used to identify patients needing more aggressive IOP-lowering therapy or earlier surgical intervention.
- OCT-derived RNFL thickness and OCT-A peripapillary vessel density are used serially to monitor response to treatment and detect progression despite "controlled" IOP (useful in normal-tension glaucoma).
- Low CH and high myopia identify subjects for targeted screening programs before visual field loss occurs.
2. DIABETIC RETINOPATHY / DIABETIC OCULAR COMPLICATIONS
- Tear-fluid TNF-alpha and VEGF: meta-analysis (19 studies, n=1413) showed both were significantly elevated specifically in diabetics with ocular complications versus both healthy controls and diabetics without complications - supports non-invasive tear-based screening in low-resource settings.
- VEGF -> retinal neovascularization + increased vascular permeability -> proliferative diabetic retinopathy and diabetic macular edema.
- TNF-alpha, IL-1beta, IL-6, IL-8, MCP-1 -> chronic subclinical inflammation preceding microvascular damage.
- VEGF is both biomarker and drug target: anti-VEGF agents (ranibizumab, bevacizumab, aflibercept) are first-line for centre-involving DME and PDR.
- Serial tear/vitreous VEGF levels can be used to titrate re-injection intervals ("treat and extend" protocols).
- Elevated tear cytokine trend in a diabetic without retinopathy could flag need for tighter glycaemic control and closer surveillance before irreversible damage.
3. AGE-RELATED MACULAR DEGENERATION (AMD)
- Mass-spectrometry proteomics meta-analysis (11 studies, 161 differentially expressed proteins) identified serotransferrin (TF), apolipoprotein A1 (APOA1), complement C3, lipocalin-1 (LCN1) as top candidate biomarkers.
- Pathway analysis -> complement and coagulation cascade is the most significant pathway, correlating with known genetic risk (Complement Factor H, ARMS2 variants) -> confirms AMD as a complement-mediated disease.
- VEGF remains the dominant biomarker-cum-target for neovascular ("wet") AMD - anti-VEGF intravitreal therapy.
- Baseline visual acuity at initiation of anti-VEGF is itself a prognostic biomarker for final visual outcome.
- Genetic risk profiling (CFH, ARMS2) + serum complement markers identify high-risk individuals for AREDS-type antioxidant/zinc supplementation and closer monitoring for conversion to wet AMD.
4. DRY EYE DISEASE / OCULAR SURFACE DISEASE
- FDA-approved point-of-care lactoferrin tear test - low lactoferrin indicates aqueous-deficient dry eye.
- Elevated tear lipocalin, mucins, S100A8/A9, transglutaminase-1 correlate with inflammatory subtypes; standard clinical tests (Schirmer's, TBUT) correlate poorly with true pathophysiology, hence biomarker-based phenotyping is gaining importance.
- Elevated serum/tear CXCL9, CXCL10, CCL19, CCL20, TNF-alpha reflect T-cell-mediated ocular surface inflammation ("vicious cycle" of dry eye).
- Biomarker-guided phenotyping (inflammatory vs non-inflammatory; aqueous-deficient vs evaporative) helps choose between topical cyclosporine/lifitegrast (anti-inflammatory) versus tear substitution alone - a personalized-medicine approach.
- Identification of high-risk phenotypes (autoimmune disease, post-LASIK, chronic contact lens wear) enables pre-emptive lubrication/anti-inflammatory therapy.
5. UVEITIS
- HLA-B27 - present in ~50% of acute anterior uveitis; associated with spondyloarthropathies (ankylosing spondylitis, reactive arthritis, psoriatic arthritis).
- ANA positivity - associated with JIA-associated uveitis; considered more a "biomarker epiphenomenon" than a directly pathogenic marker.
- HLA-B27 positivity predicts recurrent, more severe disease -> earlier initiation of steroid-sparing immunomodulatory/biologic therapy (anti-TNF agents) rather than repeated topical steroid courses alone.
- Genetic screening in patients with known inflammatory bowel/joint disease prompts proactive ophthalmic surveillance to catch uveitis early and prevent complications (cataract, glaucoma, cystoid macular oedema).
6. KERATOCONUS
- Genetic predisposition (Down syndrome, Marfan syndrome, atopy) + environmental insult (chronic eye rubbing) -> stromal degradative process.
- Emerging biomarkers: elevated tear MMP-9, altered corneal collagen cross-linking markers.
- Corneal topography/tomography indices act as structural biomarkers for detecting subclinical/early keratoconus before overt cone formation (important for refractive surgery screening).
- Early topographic biomarker detection allows timely corneal collagen cross-linking (CXL) to halt progression before vision-threatening ectasia.
7. OCULAR GRAFT-VERSUS-HOST DISEASE (oGVHD)
- Only form of GVHD diagnosed without biopsy - hence biomarkers are especially important.
- Systematic review (19 studies) found cytokine profiling of tear film is the most-studied biomarker category, along with proteomic, lipid, leukocyte profiles, and ocular surface microbiota changes.
- Clinical utility: differentiating oGVHD from other dry-eye diseases in post-allogeneic stem cell transplant patients, enabling targeted diagnosis and therapy.
SUMMARY TABLE (for quick recall in exam)
| Disease | Key Biomarker(s) | Role |
|---|---|---|
| Glaucoma | Corneal hysteresis, IOP, serum antioxidant status | Diagnosis, progression monitoring |
| Diabetic retinopathy | Tear TNF-alpha, VEGF | Screening, treatment target |
| AMD | Complement C3, APOA1, transferrin, LCN1; VEGF | Pathogenesis, anti-VEGF therapy |
| Dry eye | Lactoferrin, MMP-9, IL-6, CXCL9/10 | Phenotyping, guiding therapy |
| Uveitis | HLA-B27, ANA | Diagnosis, prognosis, treatment intensity |
| Keratoconus | Topographic indices, tear MMP-9 | Early detection, CXL timing |
| oGVHD | Tear cytokines, proteomics | Biopsy-free diagnosis |
CROSS-CUTTING CONCEPTS (bonus points for PG exam)
- Theranostic overlap - VEGF is simultaneously diagnostic, prognostic, and the direct drug target across AMD, DR, and RVO - a key "exam pearl."
- Tears as the preferred non-invasive matrix - accessible, repeatable, ideal for remote/resource-poor screening, contrasted with invasive aqueous/vitreous sampling.
- Imaging as a biomarker - OCT, OCT-A, corneal hysteresis now rank alongside molecular markers in prognostic value.
- Retina as a "window" to systemic disease - retinal vascular biomarkers are studied as surrogates for Alzheimer's disease, cardiovascular disease, and chronic kidney disease, extending biomarker relevance beyond primary eye disease.
- Evidence limitation - most proposed ocular biomarkers (roughly half in glaucoma literature) still carry only "weak" evidence grading; few meet high-certainty validation for routine clinical practice. This should be mentioned to show critical appraisal skills.