
Integration of metabolism and homeostasis
Reading File
This is a broad biochemistry/physiology topic. Let me search the library in parallel across multiple angles.
Finding Sources
Finding Sources
Finding Sources
Found a key source. Let me now search for more headings and read the relevant blocks in parallel.
Finding Sources
Finding Sources
Reading File
Good content found. Let me read more of this section and look for additional headings.
Reading File
Finding Sources
Excellent content. Let me read more of this section and also look for tissue-specific metabolism content.
Reading File
Finding Sources
Excellent content. Let me now fetch the key diagrams and look for more content on tissue-specific metabolism and fed/fasting states.
Loading Image
Finding Sources
Now let me fetch the glucagon action diagram and get more content on the section continuing after line 1655.
Loading Image
Reading File
I now have comprehensive content. Let me compile a thorough answer with all the key information gathered.
Integration of Metabolism and Homeostasis
Source: Basic Medical Biochemistry - A Clinical Approach, 6e
I. What is Metabolic Homeostasis?
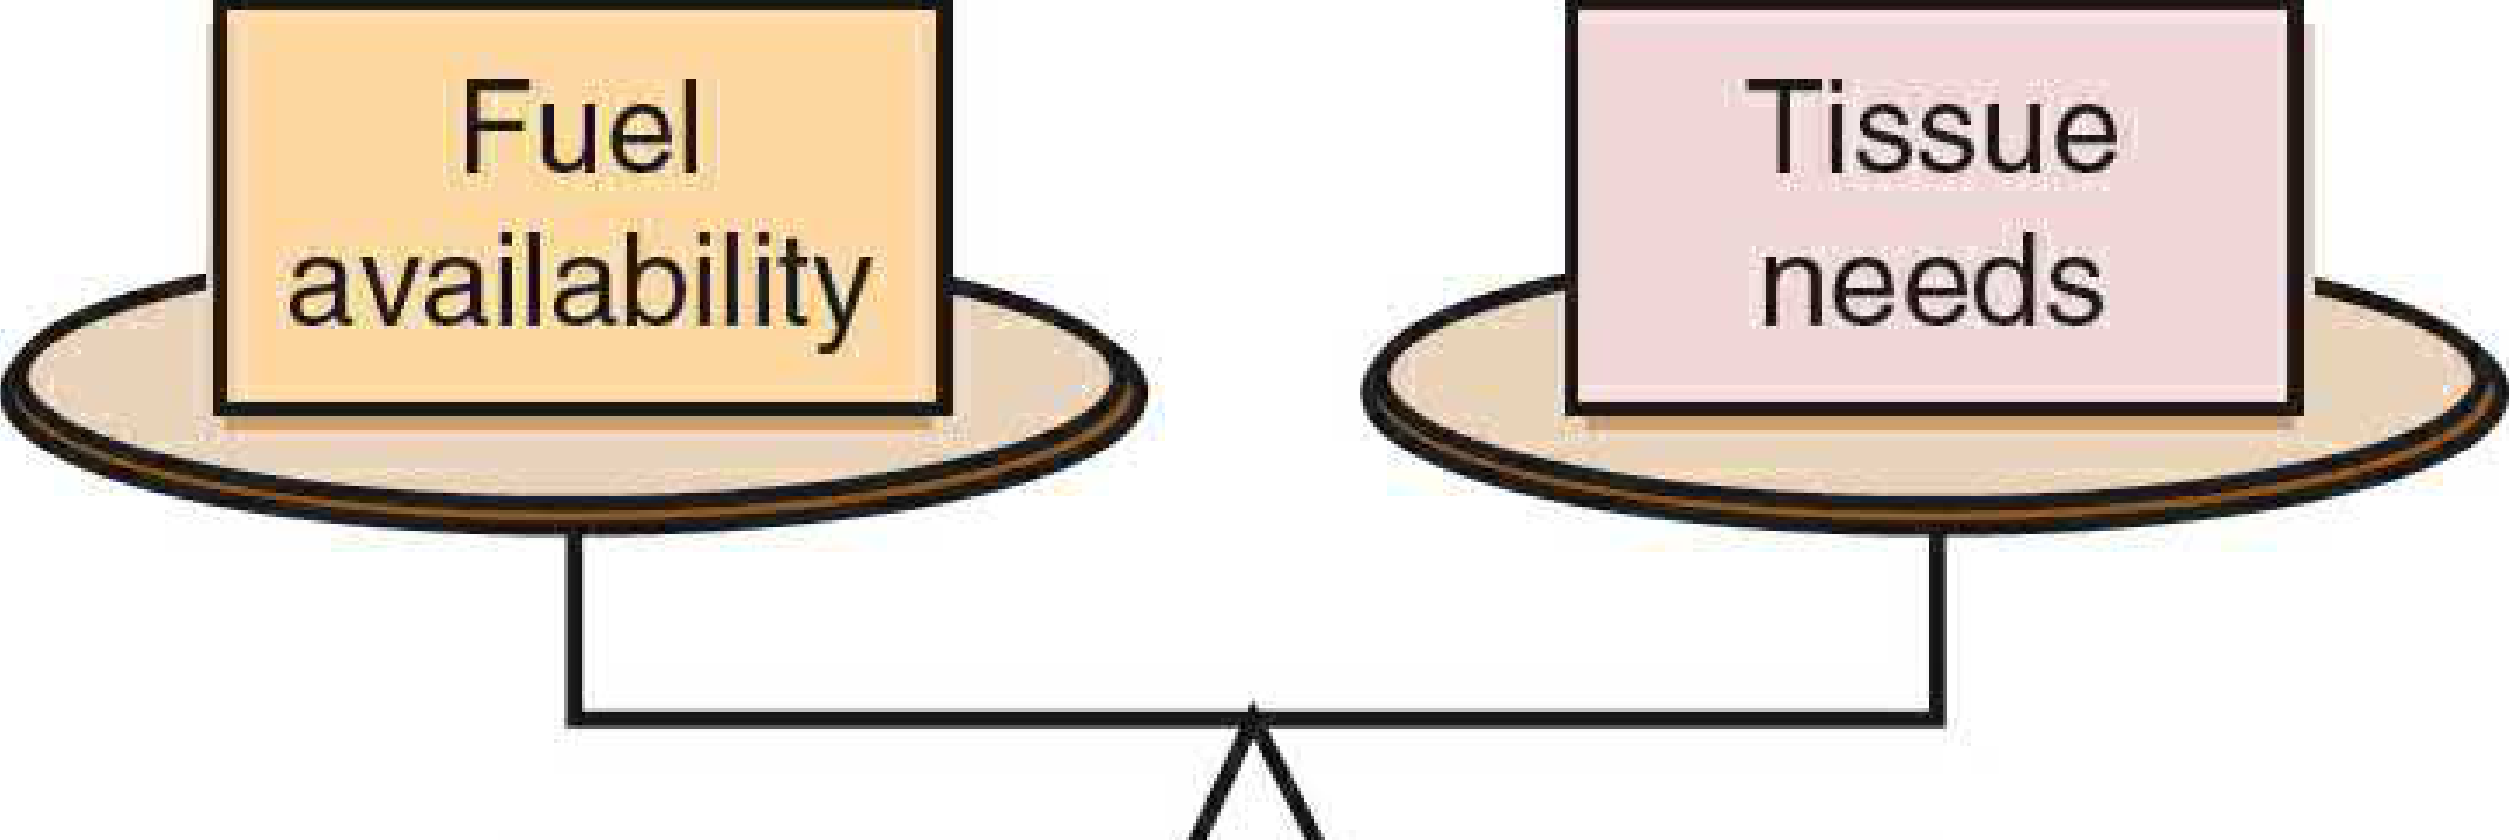
Living cells require a constant supply of fuels to derive ATP for maintaining normal cell function and growth. A balance must be achieved among:
- Carbohydrate, fat, and protein intake
- Their rates of oxidation
- Their rates of storage when present in excess
- Their rates of mobilization from storage when demand increases
This balance between substrate need and substrate availability is called metabolic homeostasis.
II. Three Mechanisms of Intertissue Integration
Metabolic homeostasis is achieved through three principal signals:
-
Blood levels of nutrients/metabolites - the concentration of a compound in the blood affects the rate at which it is used or stored. For example, fatty acid concentration in blood is the major determinant of whether skeletal muscle uses fatty acids or glucose as fuel.
-
Hormones - intravascular messengers that carry information about the physiologic state and nutrient supply between their sites of synthesis and their target tissues.
-
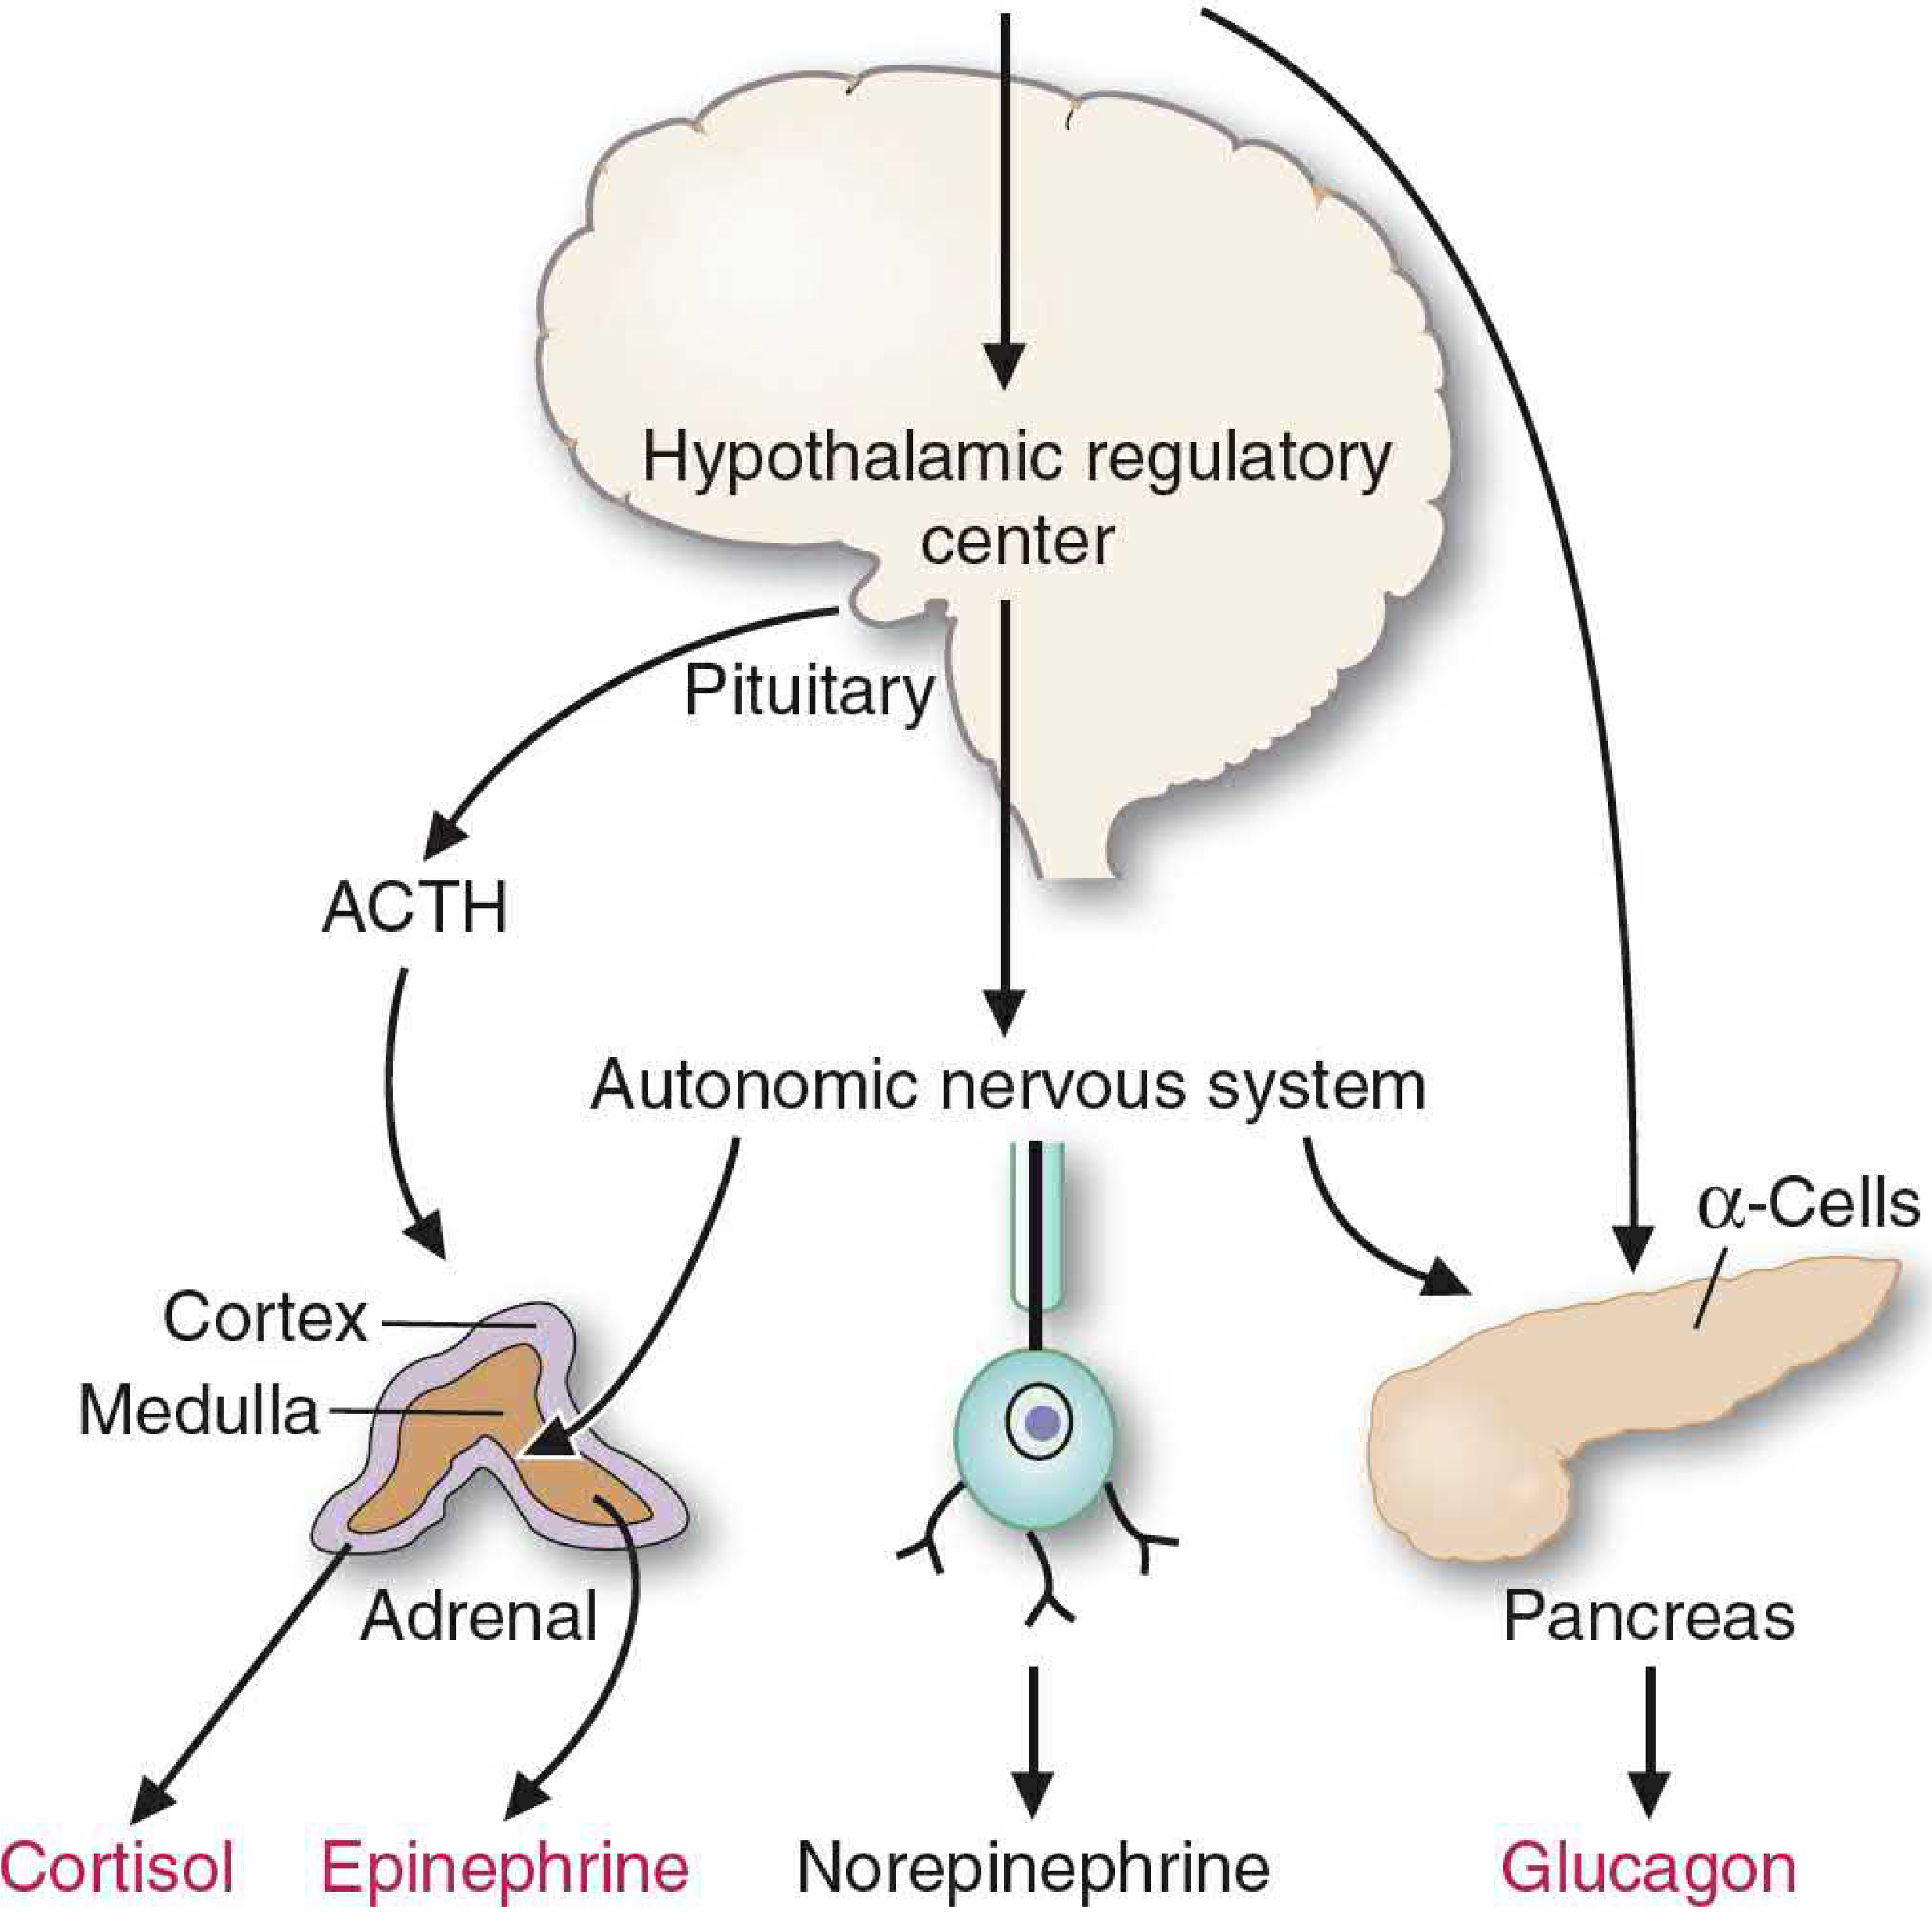
Neural signals - the CNS controls tissue metabolism directly or through releasing hormones (e.g., activation of the sympathetic nervous system during stress triggers epinephrine release from the adrenal medulla).
III. The Special Role of Glucose
Glucose occupies a central position in metabolic homeostasis. Many tissues are obligate glucose consumers:
- Brain: ~150 g/day (the most glucose-dependent organ)
- Red blood cells, kidney medulla, exercising skeletal muscle: ~40 g/day combined
A minimum of 190 g glucose/day is required by the adult human. Blood glucose falling below 60 mg/dL impairs brain metabolism and produces neuroglycopenic symptoms (confusion, blurred vision, seizures).
Consequences of dysregulation:
- Hyperglycemia: osmotic effects cause polyuria, polydipsia, protein glycation (forming HbA1c), nonenzymatic glycation of membranes and serum proteins, and increased risk of atherosclerosis
- Hypoglycemia: neurological deficits, coma, death in severe cases
- Unchecked high blood glucose and amino acids would exert a hyperosmolar effect causing progressive neurological deficits and eventual coma
IV. The Major Hormones of Metabolic Homeostasis
Insulin (Anabolic Hormone)
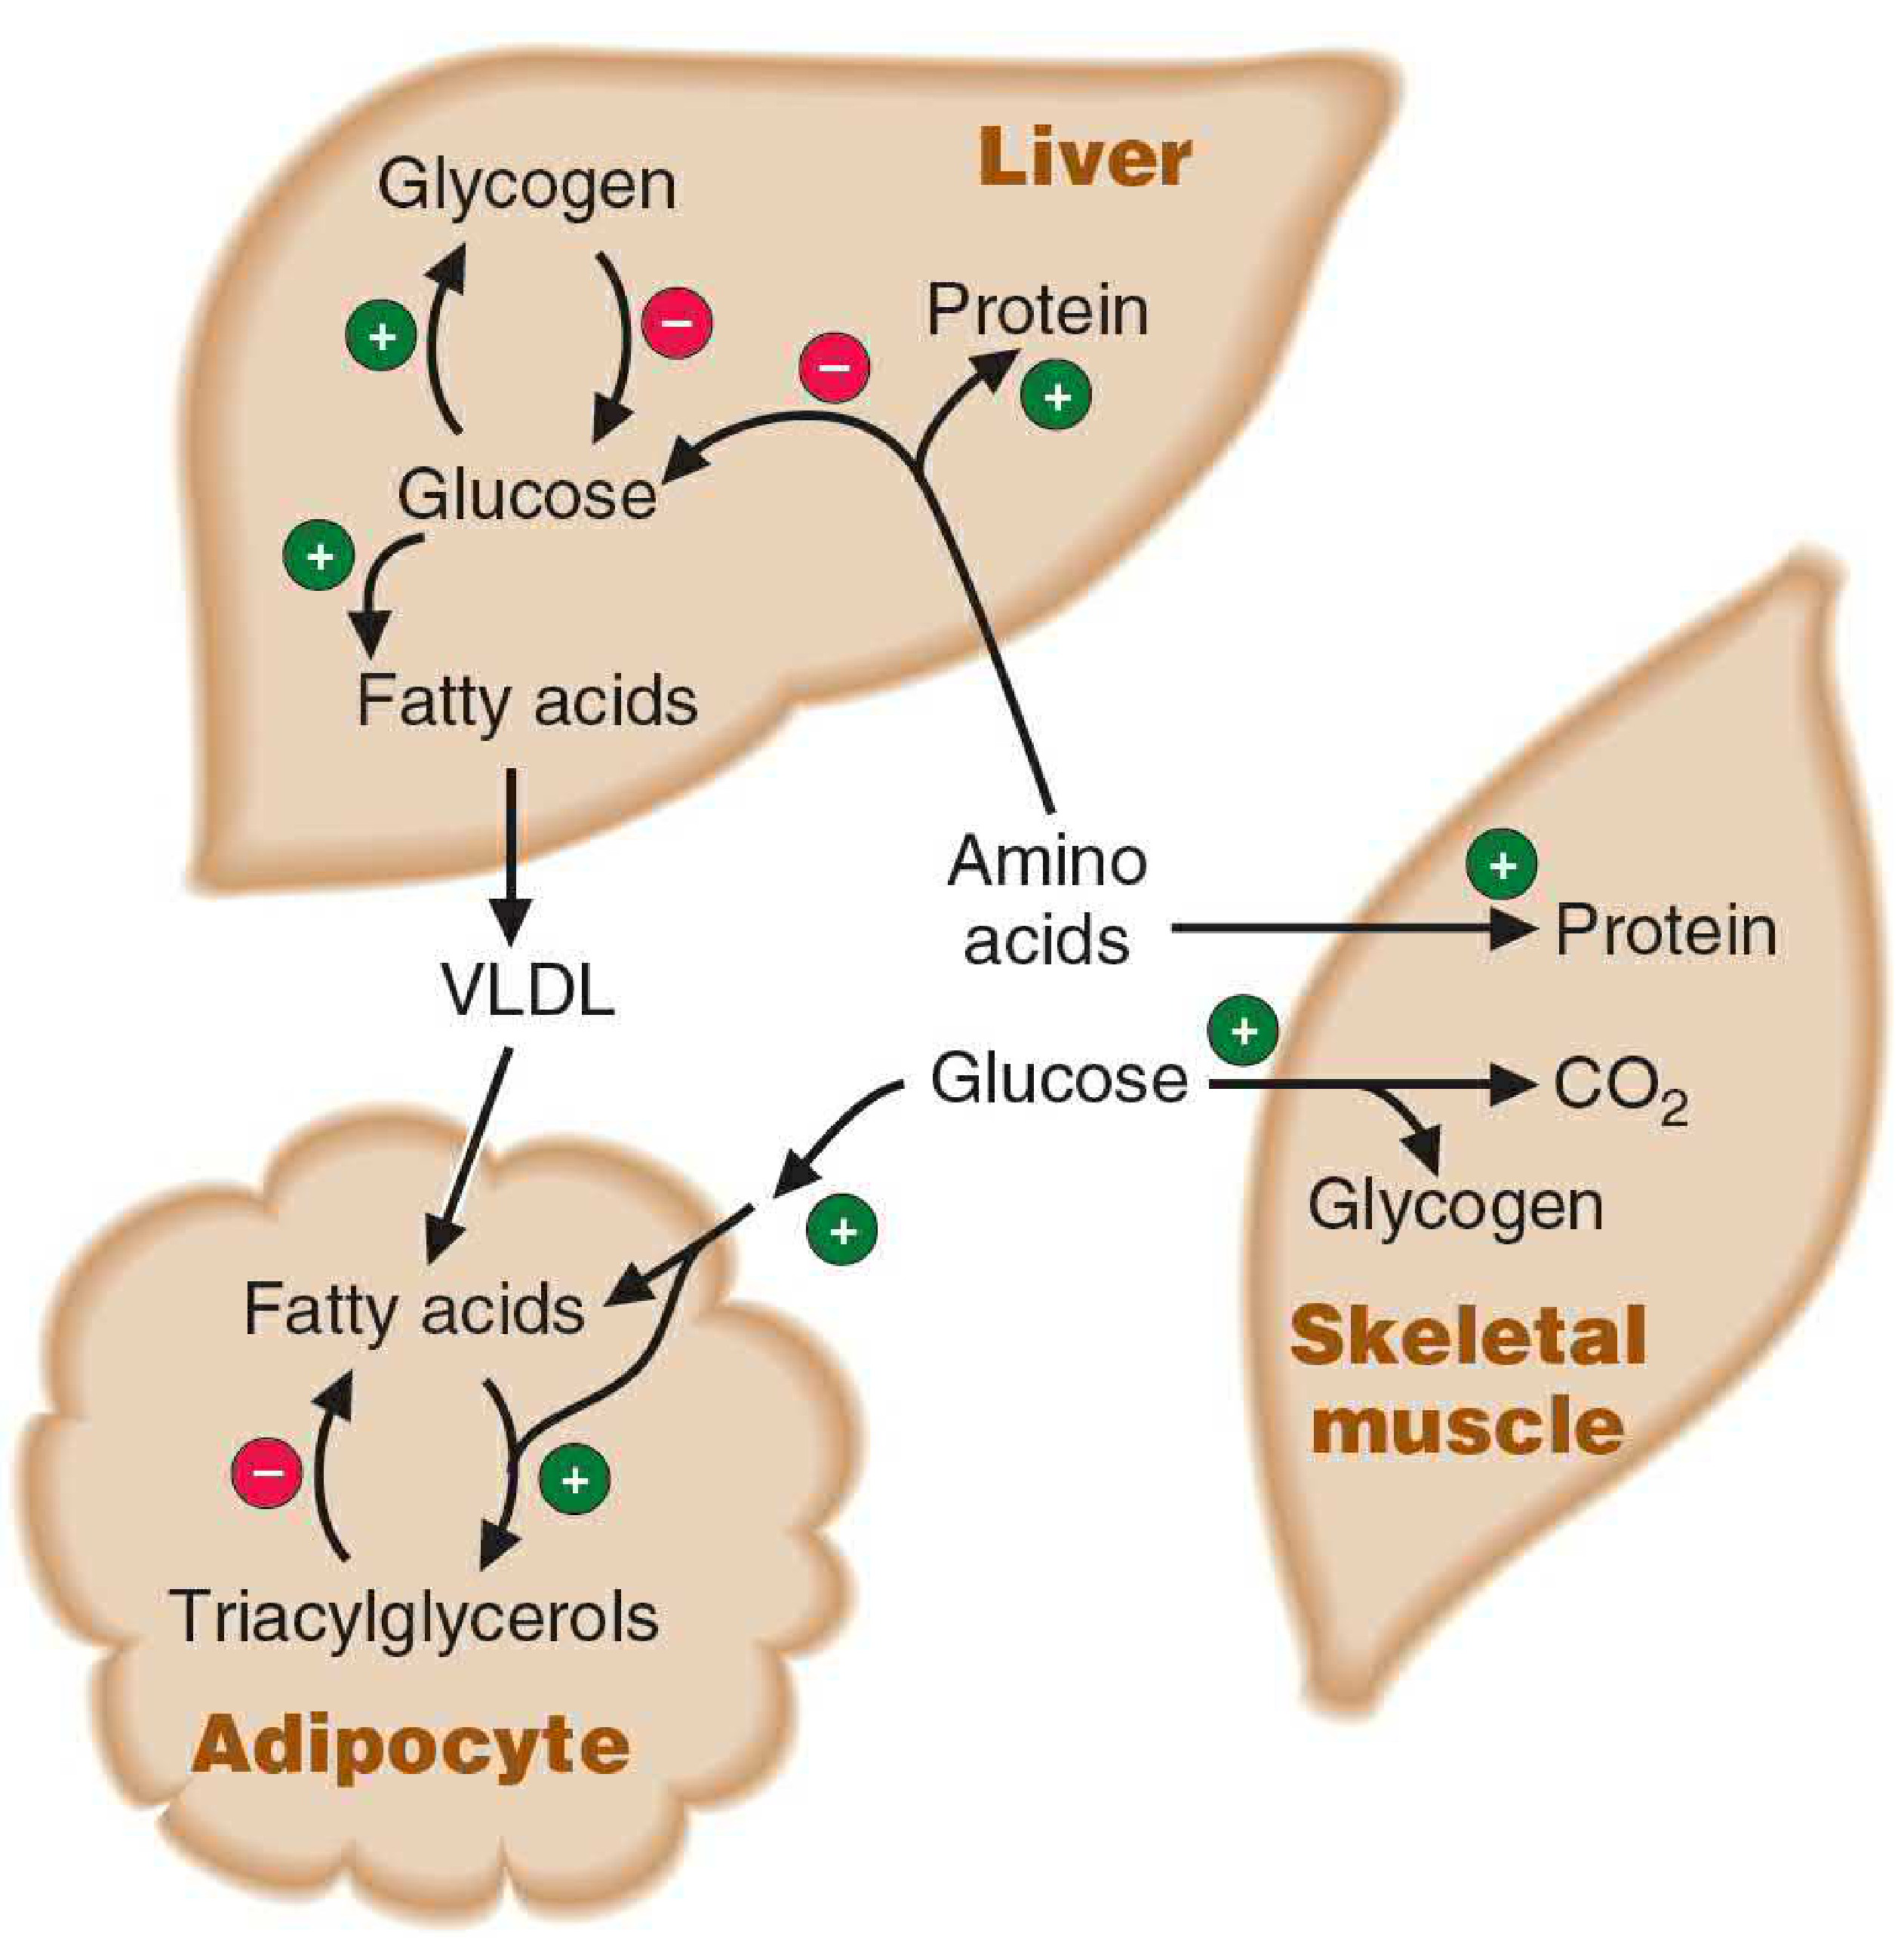
Insulin is the major anabolic hormone - it promotes fuel storage and growth:
| Target Tissue | Insulin's Effect |
|---|---|
| Liver | Stimulates glycogen synthesis; promotes glucose → fatty acids → VLDL |
| Adipose tissue | Stimulates triacylglycerol storage; inhibits lipolysis |
| Skeletal muscle | Stimulates glucose uptake, glycogen synthesis, amino acid uptake, and protein synthesis |
| General | Stimulates albumin and other protein synthesis by liver |
Insulin also inhibits fuel mobilization - it suppresses glycogenolysis, gluconeogenesis, and lipolysis.
Glucagon (Catabolic/Fuel-Mobilizing Hormone)
Glucagon carries the message that "glucose is gone" - it acts primarily on liver and adipose tissue (muscle has no glucagon receptors):
- Stimulates glycogenolysis in liver → releases glucose into blood
- Stimulates gluconeogenesis from lactate, glycerol, and amino acids
- In conjunction with low insulin, mobilizes fatty acids from adipose triacylglycerols
Counterregulatory Hormones (Stress Hormones)
| Hormone | Source | Role |
|---|---|---|
| Epinephrine | Adrenal medulla (via sympathetic NS) | Acute stress: stimulates glycogenolysis in muscle and liver; stimulates lipolysis in adipose tissue |
| Cortisol | Adrenal cortex (via ACTH) | Sustained stress: mobilizes amino acids from muscle protein for gluconeogenesis; inhibits glucose uptake in muscle; stimulates lipolysis; inhibits insulin secretion and increases glucagon secretion |
| Norepinephrine | Sympathetic nerve endings | Minor counterregulatory role |
V. The Insulin:Glucagon Ratio
The insulin-to-glucagon ratio is the key metabolic "switch":
| State | Insulin:Glucagon | Metabolic Direction |
|---|---|---|
| Fed (absorptive) state | High | Fuel storage - glycogen synthesis, lipogenesis, protein synthesis |
| Early fasting (postabsorptive) | Low | Fuel mobilization - glycogenolysis, gluconeogenesis, lipolysis |
| Prolonged fasting/starvation | Very low | Ketogenesis from fatty acids; muscle protein catabolism for gluconeogenesis |
| Physiologic stress | Very low (+ epinephrine, cortisol) | Maximal fuel mobilization - fight-or-flight |
VI. Summary of Key Metabolic Principles
- Blood nutrient levels act as direct signals - they auto-regulate their own metabolism (e.g., high fatty acids suppress glucose oxidation in muscle)
- Hormones integrate whole-body responses - insulin and glucagon are released continuously in response to daily eating patterns; stress hormones are released acutely by neural signals
- The CNS is both a major glucose consumer and a master regulator - it monitors blood glucose via the hypothalamus and coordinates hormonal/neural responses to maintain euglycemia
- Consequences of failure - diabetes mellitus illustrates both sides: hyperglycemia from insulin deficiency/resistance leads to osmotic, glycation, and vascular pathology; iatrogenic or insulinoma-induced hypoglycemia produces neuroglycopenic symptoms
Basic Medical Biochemistry - A Clinical Approach, 6e, pp. 698-707
Electron transport chain
Finding Sources
Finding Sources
Excellent - two primary sources found. Let me read the main ETC sections from both Lippincott and Basic Medical Biochemistry in parallel.
Reading File
Reading File
Great content. Let me continue reading both sources for the complexes, proton pumping, and ATP synthesis details.
Reading File
Reading File
Excellent content. Let me now read the ATP synthase, proton gradient, inhibitors, and energy yield sections in parallel.
Reading File
Reading File
Let me now get the ATP synthase (chemiosmosis) and inhibitors/uncouplers sections, plus the key ETC diagram.
Reading File
Reading File
Loading Image
Excellent - I have a comprehensive ETC diagram. Let me get the ATP synthase and inhibitors content to complete the picture.
Reading File
Reading File
I now have comprehensive content on the ETC. Let me fetch the ATP synthase diagram to include in the answer.
Loading Image
I now have everything needed for a thorough, well-illustrated answer. Let me compile it.
Electron Transport Chain (ETC)
Sources: Biochemistry - Lippincott Illustrated Reviews, 8e; Basic Medical Biochemistry - A Clinical Approach, 6e
Overview
Energy-rich molecules such as glucose are metabolized by a series of oxidation reactions, ultimately yielding CO₂ and H₂O. Metabolic intermediates donate electrons to the coenzymes NAD⁺ and FAD, forming energy-rich NADH and FADH₂. These reduced coenzymes then donate electron pairs to the electron transport chain (ETC) - a specialized set of electron carriers in the inner mitochondrial membrane. As electrons pass down the ETC, the released energy pumps H⁺ across the membrane, creating a gradient that drives ATP synthesis (oxidative phosphorylation, OXPHOS).
Mitochondrial Location and Structure
The ETC is embedded in the inner mitochondrial membrane (IMM), which is:
- Impermeable to most small ions (H⁺, Na⁺, K⁺) and metabolites (ATP, ADP, pyruvate)
- Studded with cristae (infoldings) that greatly increase surface area
- Over half its protein content is directly involved in OXPHOS
The matrix contains the enzymes of the TCA cycle, β-oxidation, and stores of NAD⁺, FAD, ADP, and Pi - all substrates for the ETC and ATP synthase.
The Four Complexes of the ETC
Complex I - NADH:CoQ Oxidoreductase (NADH Dehydrogenase)
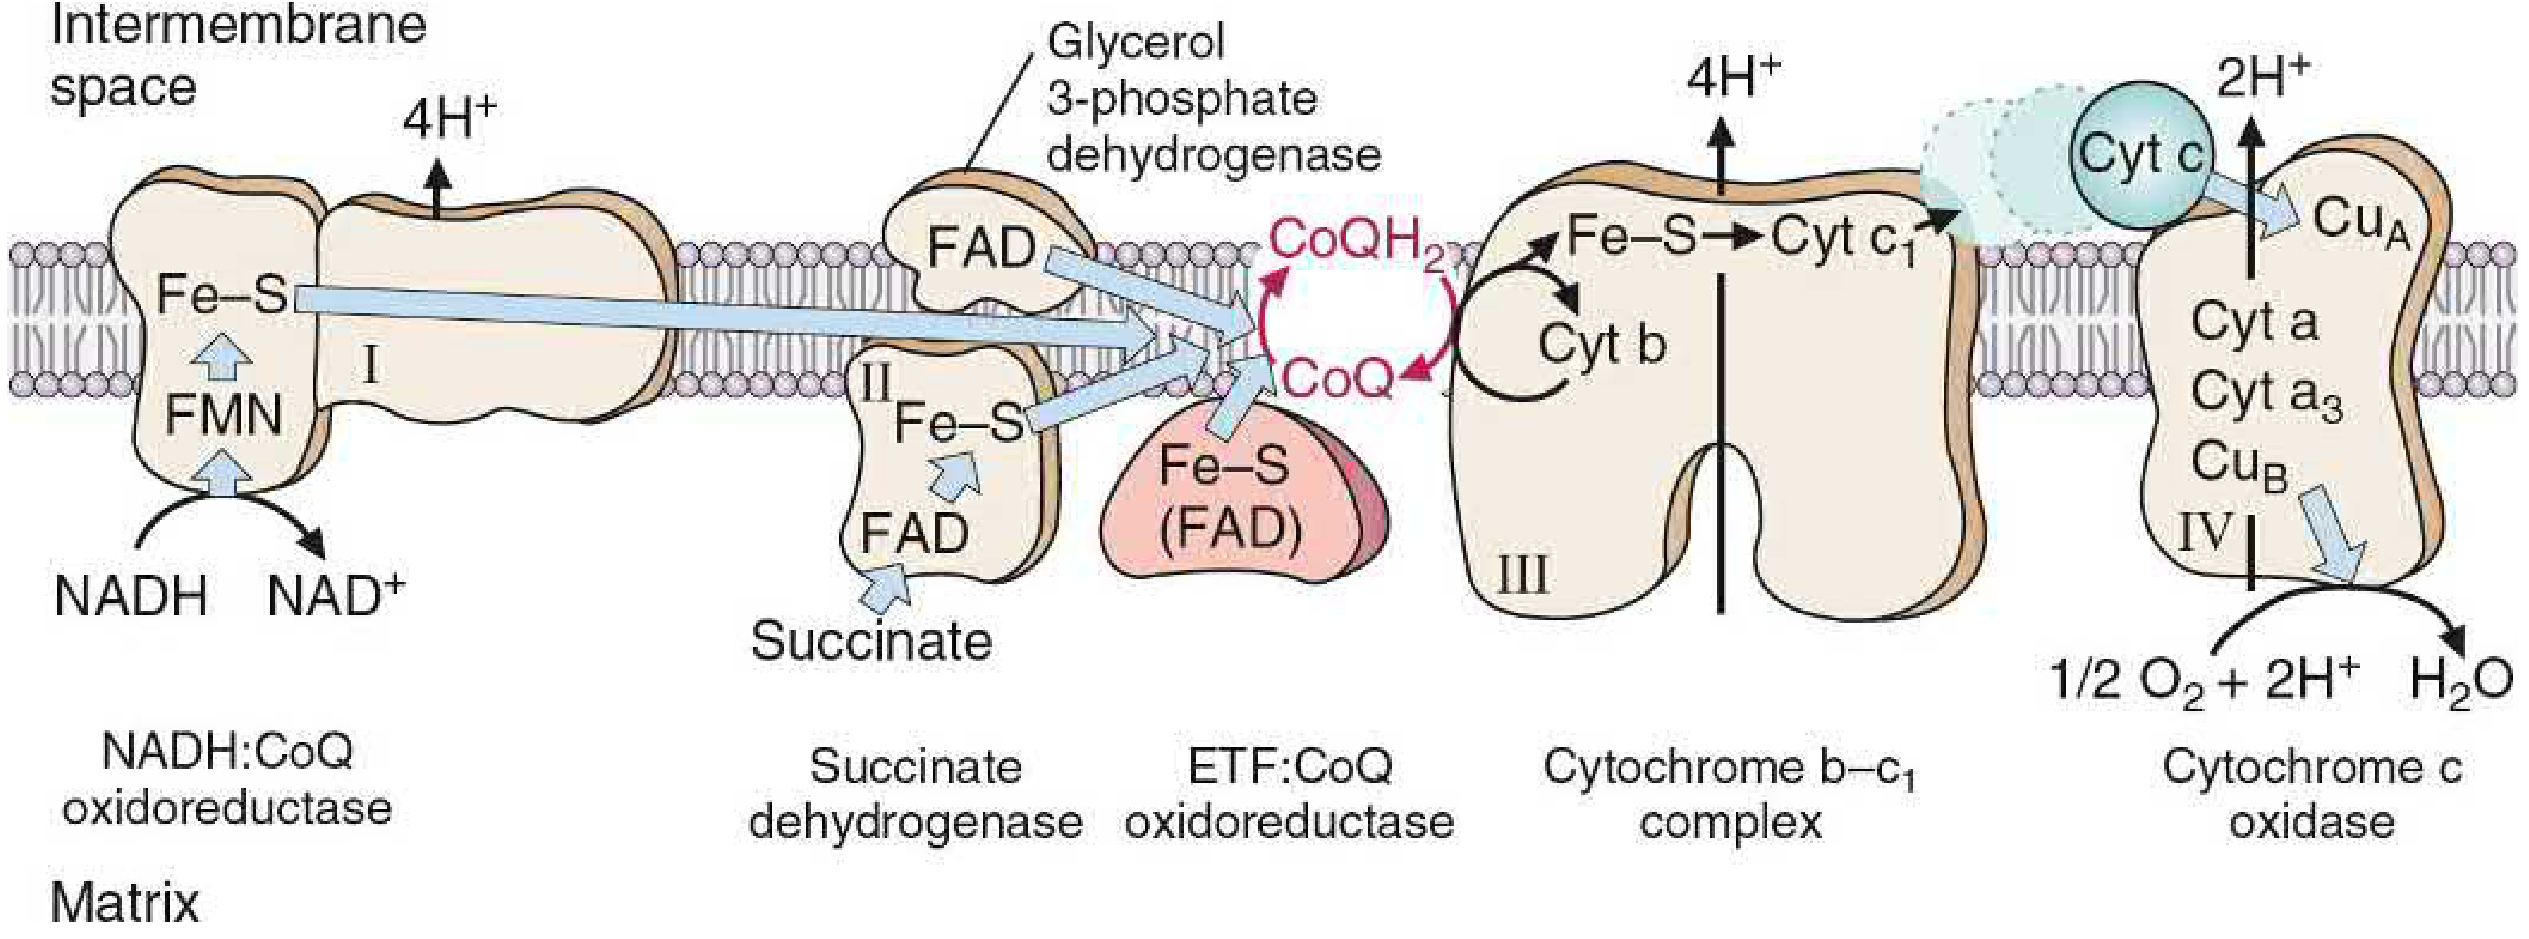
- Accepts electrons from NADH → transfers them to FMN (flavin mononucleotide, derived from riboflavin)
- Electrons pass through Fe-S centers → reduce CoQ to CoQH₂
- Pumps 4 H⁺ from matrix to intermembrane space
- Inhibited by rotenone (pesticide), amytal (barbiturate), metformin (at high doses)
Complex II - Succinate Dehydrogenase
- Accepts electrons from succinate → fumarate oxidation, via FADH₂
- Transfers electrons through Fe-S proteins → to CoQ
- No proton pumping (no energy drop sufficient to pump H⁺)
- Inhibited by malonate (competitive)
- Also accepts electrons from glycerol-3-phosphate dehydrogenase and acyl CoA dehydrogenase (from β-oxidation)
Coenzyme Q (CoQ / Ubiquinone)
- A lipid-soluble quinone - freely diffuses within the IMM
- The mobile hub linking all flavoprotein dehydrogenases to the cytochromes
- Can accept 1 electron (semiquinone radical) or 2 electrons (CoQH₂)
- Transfers electrons from Complex I and II to Complex III
Complex III - Cytochrome bc₁ Complex
- Transfers electrons from CoQH₂ → cytochrome c via the Q cycle
- Contains cytochromes b, c₁ and Fe-S centers
- Pumps 4 H⁺ into intermembrane space
- Inhibited by antimycin A
Cytochrome c
- A small, water-soluble heme protein in the intermembrane space
- The mobile carrier shuttling single electrons from Complex III to Complex IV
- Fe³⁺ ↔ Fe²⁺ cycle with each electron transfer
Complex IV - Cytochrome c Oxidase
- The terminal oxidase - the only complex that reacts directly with O₂
- Contains cytochromes a and a₃, plus copper atoms (CuA and CuB)
- Collects 4 electrons from cytochrome c → reduces O₂ to 2 H₂O
- Pumps 2 H⁺ into intermembrane space
- Has a lower Km for O₂ than either myoglobin or hemoglobin - ensures O₂ is "pulled" all the way to Complex IV
- Inhibited by cyanide (CN⁻), CO, azide - all bind the heme iron of cytochrome a₃ and block electron transfer to O₂
Chemiosmosis and ATP Synthesis (Complex V)
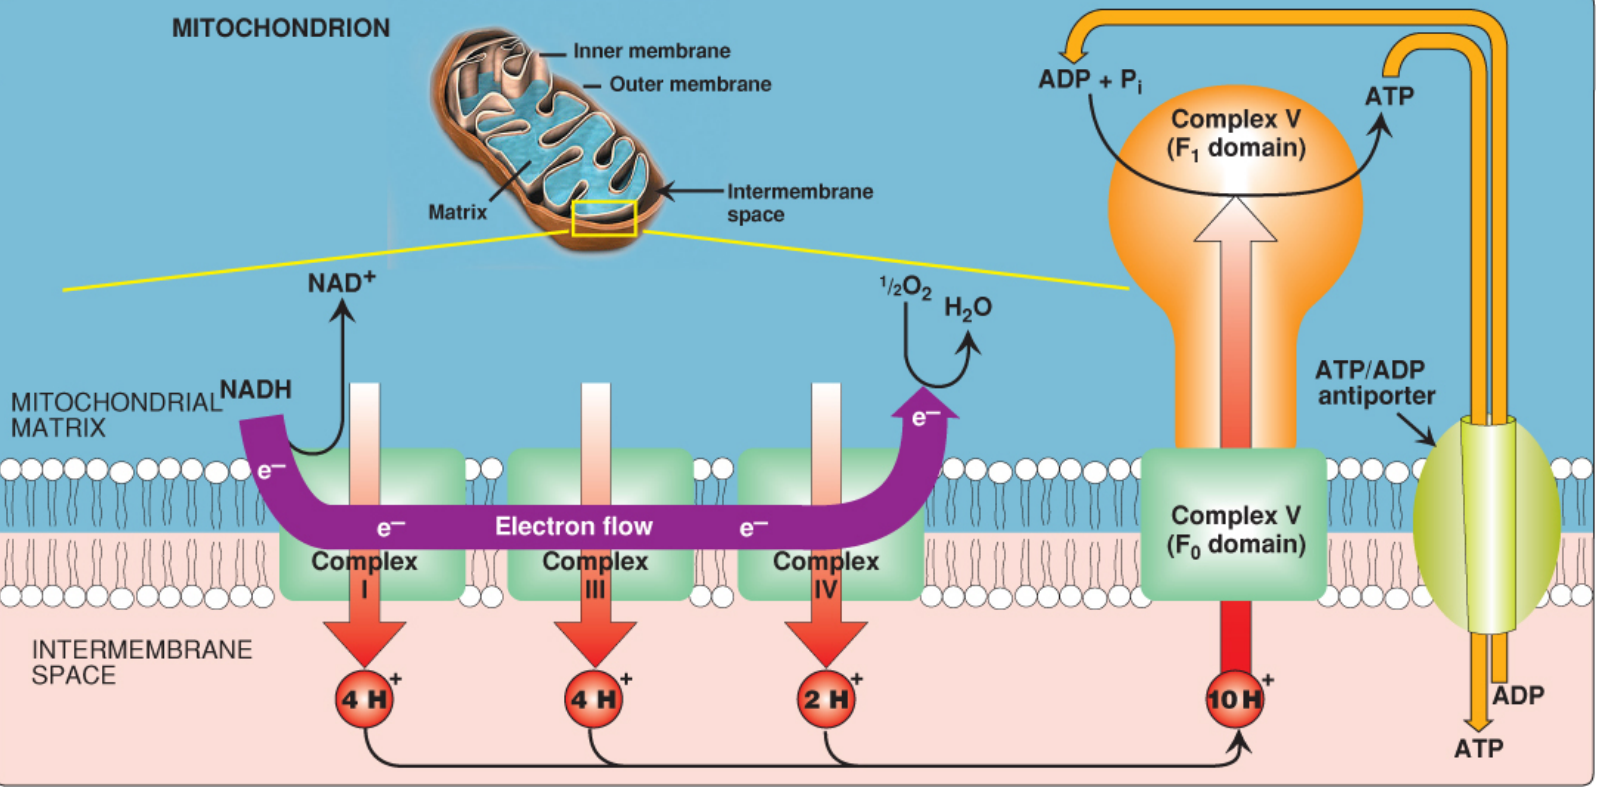
The chemiosmotic hypothesis (Mitchell hypothesis) explains how electron transport drives ATP synthesis:
-
Proton pumping: Complexes I, III, and IV pump H⁺ from the matrix to the intermembrane space. For each NADH oxidized, 10 H⁺ total are pumped (4 + 4 + 2).
-
Proton-motive force (PMF): The pumping creates both:
- An electrical gradient (positive charges on cytosolic/IMS side)
- A pH gradient (cytosolic side is more acidic)
- Combined PMF drives H⁺ back through ATP synthase
-
ATP Synthase (Complex V):
- Has two domains: F₀ (membrane-spanning H⁺ channel) and F₁ (catalytic sphere in matrix)
- H⁺ re-entering through the F₀ c-ring drives its rotation
- Rotation causes conformational changes in the three β-subunits of F₁ - binding ADP + Pi → phosphorylating → releasing ATP
- One full rotation = 3 ATP synthesized
- Inhibited by oligomycin (blocks H⁺ channel in F₀)
-
ATP/ADP antiporter: Newly synthesized ATP is transported out of the matrix in exchange for ADP (1 extra H⁺ cost per ATP exported)
Energy Yield
| Electron Donor | Complexes Used | H⁺ Pumped | ATP Synthesized |
|---|---|---|---|
| NADH | I, III, IV | 10 | ~2.5 ATP |
| FADH₂ (succinate, β-oxidation) | II, III, IV | 6 | ~1.5 ATP |
The overall free energy released:
- NADH → O₂: ~53 kcal/mol (ΔG° = -52.6 kcal/mol)
- FADH₂ → O₂: ~41 kcal/mol
Only ~30% of this energy is captured as ATP; the remainder is released as heat (the ETC is the body's major heat source) or used to drive Ca²⁺ and anion transport into mitochondria.
NADH Shuttles (Cytoplasmic NADH)
NADH produced in the cytoplasm (e.g., from glycolysis) cannot cross the IMM directly. Two shuttles transfer its reducing equivalents:
| Shuttle | Cytoplasmic Donor | Mitochondrial Acceptor | ATP Yield |
|---|---|---|---|
| Glycerol-3-phosphate shuttle | NADH → DHAP → glycerol-3-P | FAD (enters at Complex II) | ~1.5 ATP |
| Malate-aspartate shuttle | NADH → OAA → malate | NAD⁺ (enters at Complex I) | ~2.5 ATP |
The malate-aspartate shuttle is more energy-efficient and predominates in the heart and liver; the glycerol-3-phosphate shuttle is the major shuttle in most other tissues.
Inhibitors and Uncouplers
| Agent | Site of Action | Mechanism |
|---|---|---|
| Rotenone, Amytal, Metformin | Complex I | Block NADH → CoQ electron transfer |
| Malonate | Complex II | Competitive inhibition of succinate binding |
| Antimycin A | Complex III | Blocks CoQH₂ oxidation |
| Cyanide, CO, Azide | Complex IV | Bind cytochrome a₃; block O₂ reduction |
| Oligomycin | Complex V (F₀) | Blocks H⁺ channel; stops ATP synthesis |
| DNP (dinitrophenol), FCCP | IMM (uncouplers) | Lipid-soluble proton carriers; dissipate H⁺ gradient without making ATP; energy released as heat |
| Thermogenin (UCP1) | Brown fat IMM | Physiologic uncoupler; produces heat in neonates and cold-adapted organisms |
Note on uncouplers: When the H⁺ gradient is dissipated (e.g., by DNP), electron transport actually speeds up (no back-pressure) but ATP synthesis falls to zero - energy is entirely wasted as heat. DNP was historically used as a weight-loss drug; several deaths resulted.
Reactive Oxygen Species (ROS)
Electron leakage from the ETC (mainly at Complexes I and III) generates ROS: superoxide (O₂⁻), H₂O₂, and hydroxyl radicals (OH•). These damage DNA, proteins, and lipid membranes (peroxidation). Cellular defenses include:
- Superoxide dismutase (SOD): O₂⁻ → H₂O₂
- Catalase: H₂O₂ → H₂O + O₂
- Glutathione peroxidase: H₂O₂ + GSH → H₂O
Clinical Correlates
- Ischemia/hypoxia: No O₂ → ETC stops → no PMF → no ATP → mitochondrial swelling → irreversible cell injury (necrosis)
- Cyanide poisoning: Inhibits Complex IV; all carriers upstream become fully reduced; O₂ cannot be used; cells die despite normal O₂ delivery
- Doxorubicin cardiotoxicity: Binds cardiolipin in the IMM; inhibits succinate oxidation, inactivates cytochrome oxidase, inhibits ATP synthase → decreased ATP in cardiomyocytes
- Mitochondrial myopathies: Mutations in mtDNA encoding ETC subunits; present with exercise intolerance, weakness, lactic acidosis, ragged red fibers on muscle biopsy
- AZT (zidovudine): Inhibits mitochondrial DNA polymerase γ → mtDNA depletion → severe mitochondrial myopathy
Biochemistry - Lippincott Illustrated Reviews, 8e, pp. 224-241; Basic Medical Biochemistry - A Clinical Approach, 6e, pp. 864-884
Digestion and absorption of carbohydrates
Finding Sources
Finding Sources
Four excellent sources found. Let me read the two most comprehensive ones in parallel.
Reading File
Reading File
Excellent content from both sources. Let me now read more of the Basic Medical Biochemistry section (absorption/transport part) and fetch the key diagrams in parallel.
Reading File
Loading Image
Excellent diagram. Now let me get the GLUT transporter details and the intestinal absorption mechanisms.
Reading File
Finding Sources
Let me continue reading for the GLUT transporter table and absorption mechanisms.
Reading File
Let me get the transport/GLUT section and fetch the absorption diagram.
Reading File
Loading Image
I have comprehensive content. Let me read the GLUT transporter table section now.
Reading File
I now have all the content needed for a comprehensive answer. Let me also quickly get the GLUT transporter section content.
Reading File
Loading Image
I now have all the content and diagrams needed. Let me compile the comprehensive answer.
Digestion and Absorption of Carbohydrates
Sources: Basic Medical Biochemistry - A Clinical Approach, 6e; Harper's Illustrated Biochemistry, 32e
I. Major Dietary Carbohydrates
Carbohydrates are the largest source of dietary calories (40-45% of caloric intake in the average diet). The principal dietary carbohydrates are:
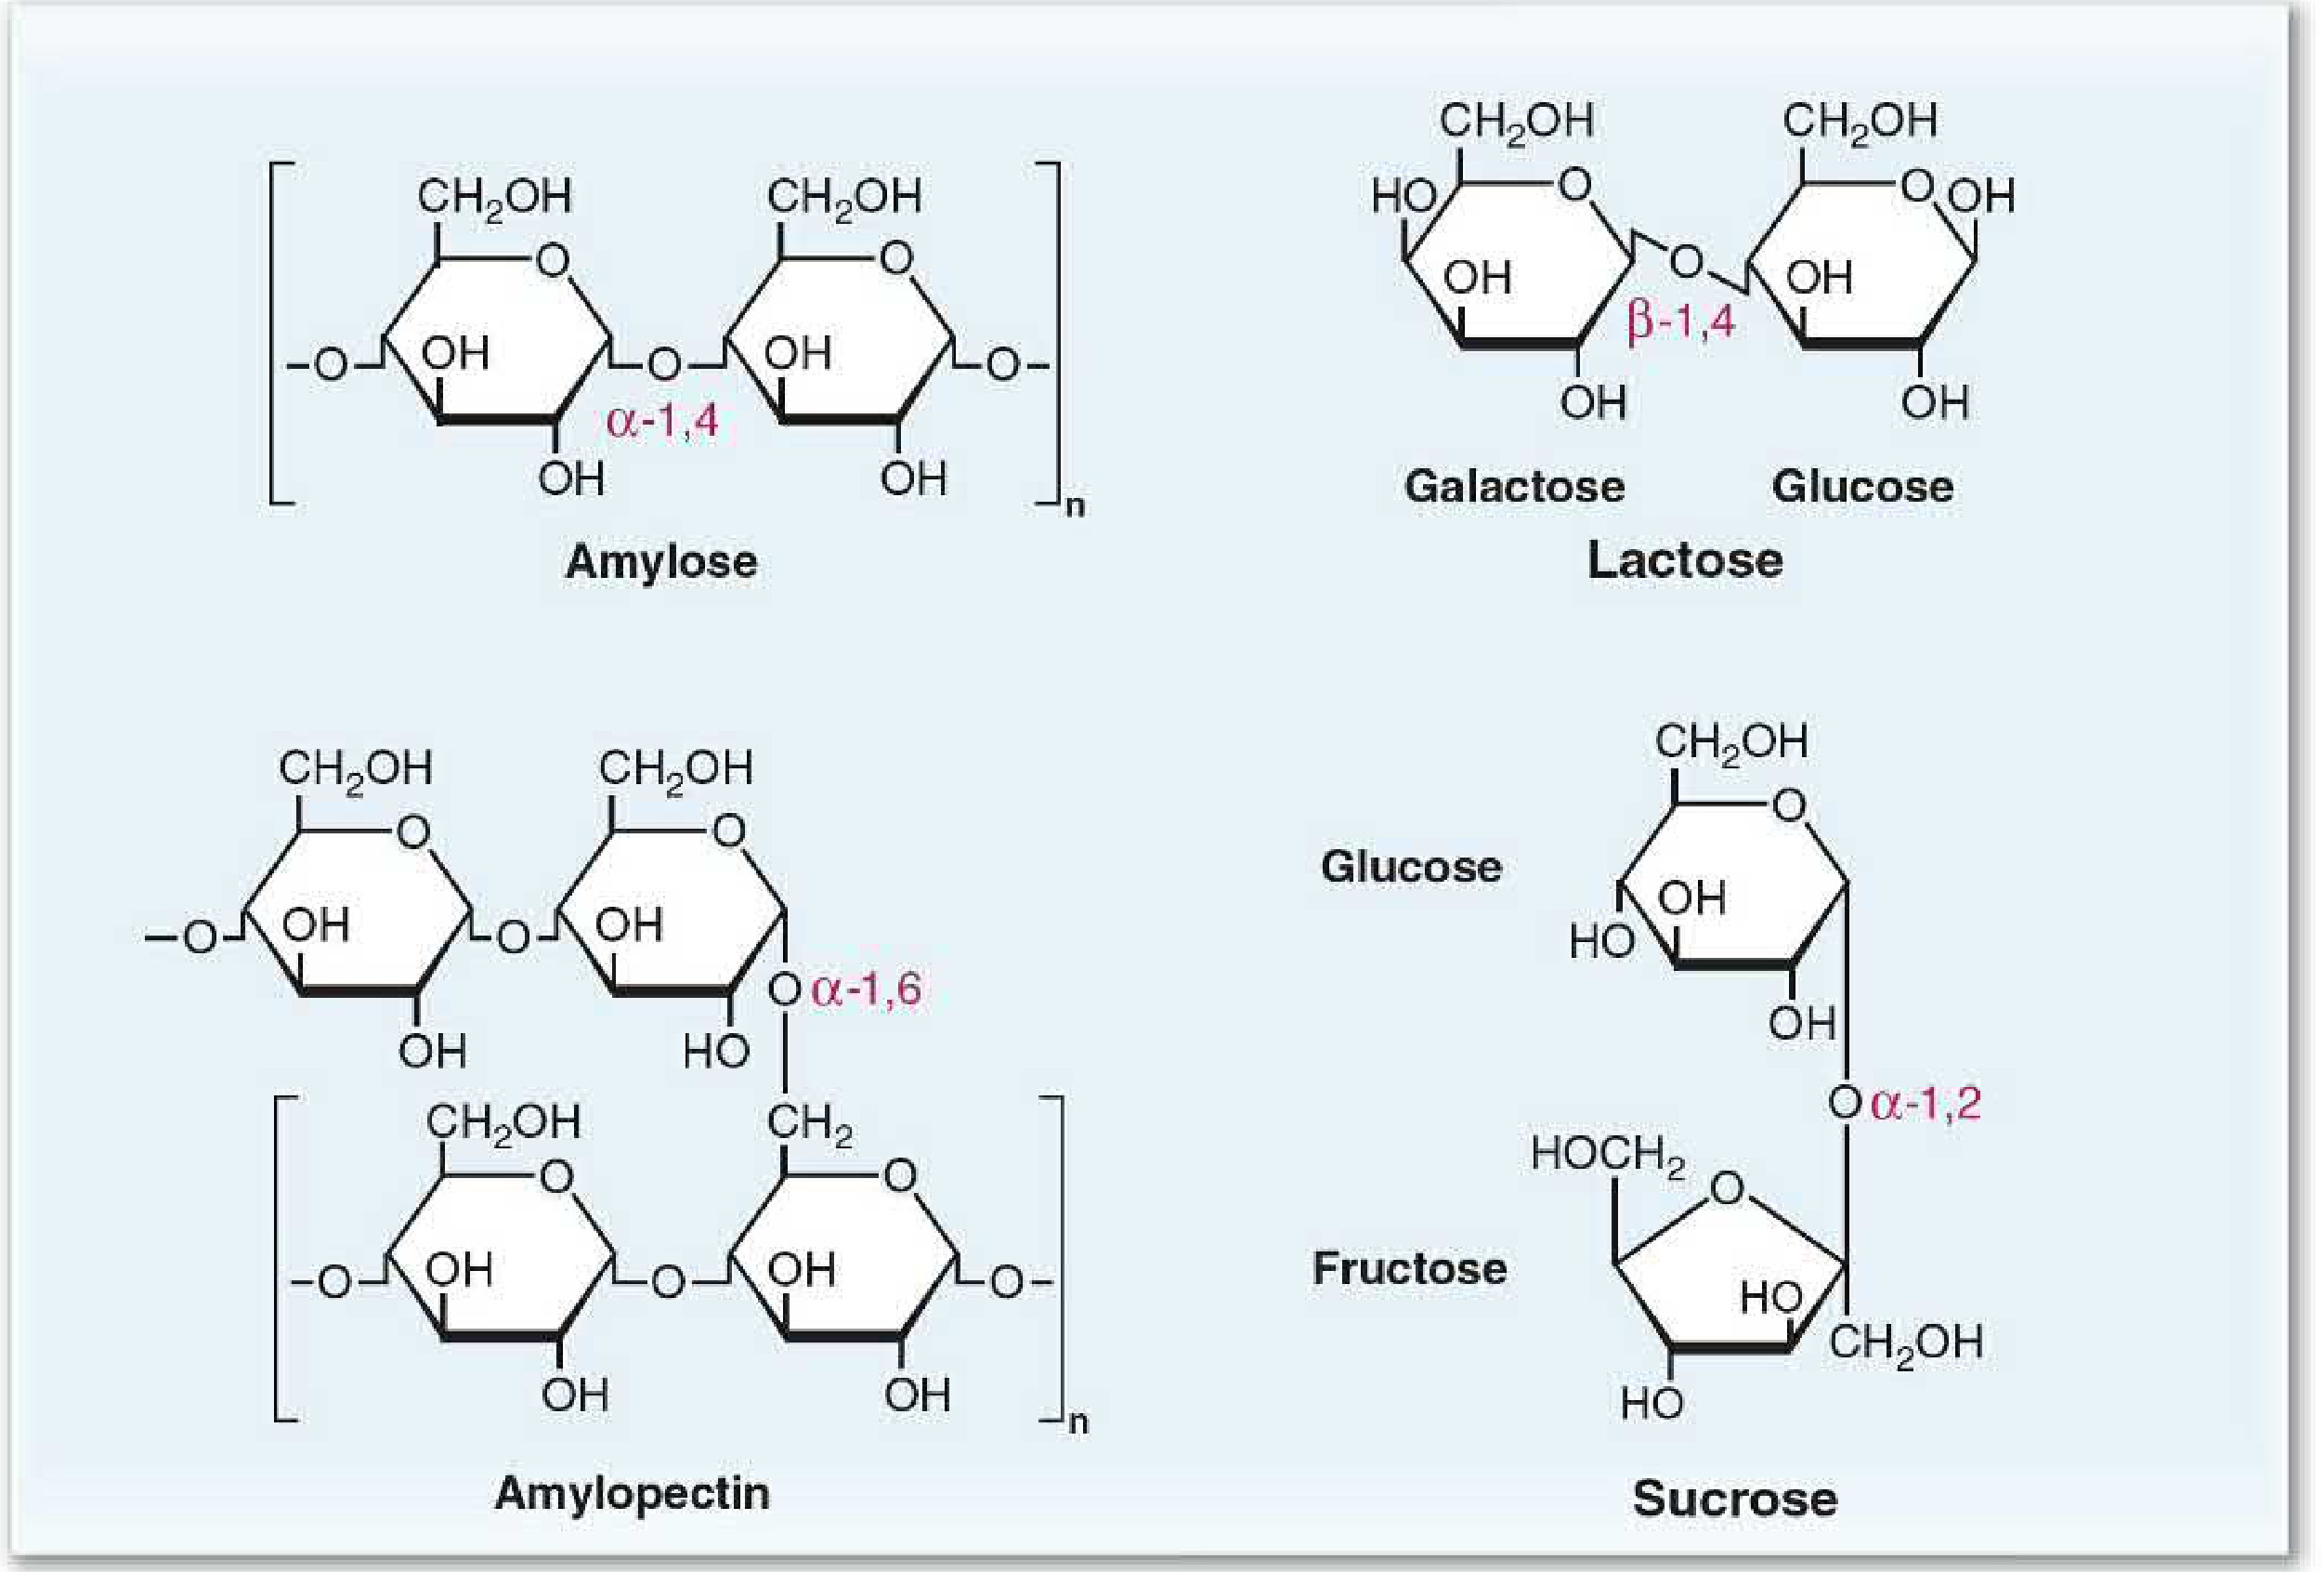
| Carbohydrate | Type | Bond | Components |
|---|---|---|---|
| Amylose | Polysaccharide | α-1,4-glycosidic (straight chain) | Glucose only |
| Amylopectin | Polysaccharide | α-1,4 + α-1,6-glycosidic (branched) | Glucose only |
| Glycogen | Polysaccharide | α-1,4 + α-1,6 (more branches than amylopectin) | Glucose only |
| Lactose | Disaccharide | β-1,4-glycosidic | Glucose + Galactose |
| Sucrose | Disaccharide | α-1,2-glycosidic | Glucose + Fructose |
| Maltose | Disaccharide | α-1,4-glycosidic | Glucose + Glucose |
| Cellulose | Polysaccharide | β-1,4-glycosidic | Glucose (indigestible) |
Starches (amylose + amylopectin) make up ~50-60% of carbohydrate calories. Human enzymes cannot hydrolyze β-1,4 bonds, so cellulose and most other plant fiber pass undigested.
II. Digestion - Step by Step
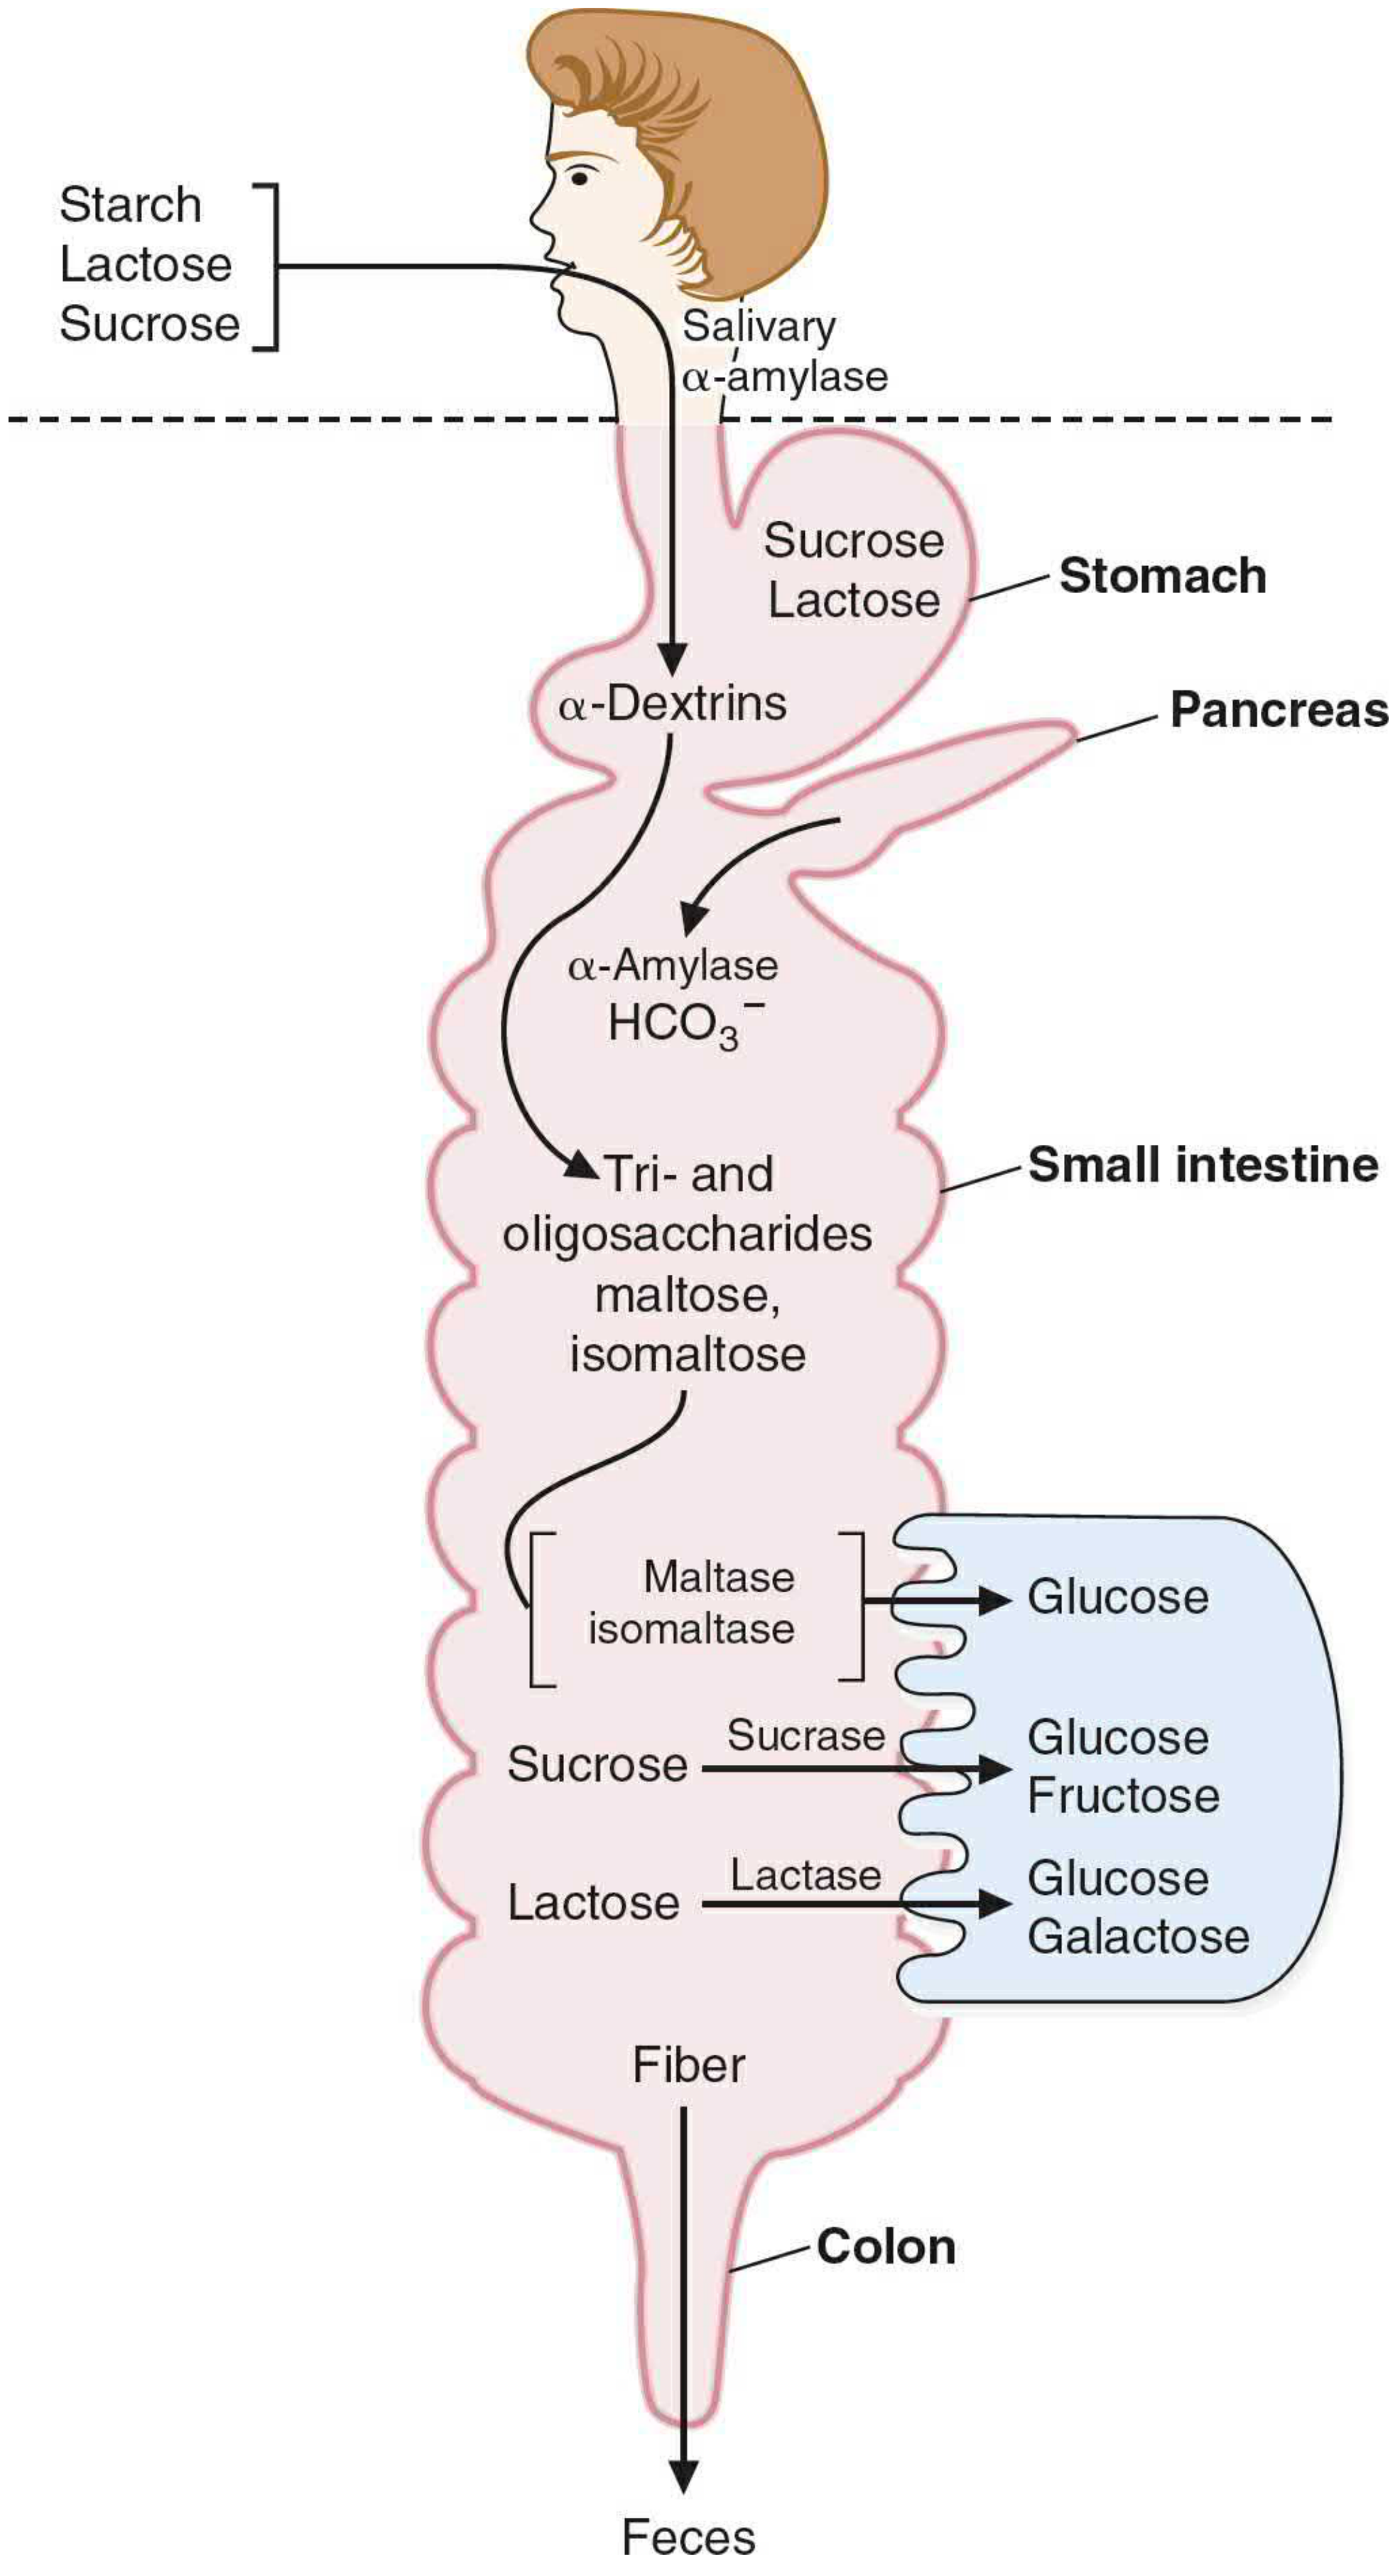
A. Mouth - Salivary α-Amylase
- Salivary α-amylase (from parotid/submandibular glands) begins starch digestion
- Cleaves internal α-1,4-glycosidic bonds randomly → produces α-dextrins (shorter polysaccharides)
- Cannot cleave at branch points (α-1,6 bonds) or terminal bonds
- Inactivated in the stomach by HCl (low pH) - so salivary digestion is brief
B. Stomach
- No carbohydrate-digesting enzymes secreted
- Acid inactivates salivary amylase
- Sucrose and lactose pass through unchanged
- Mechanical breakdown continues
C. Small Intestine (Main Site of Digestion)
Pancreatic secretions into the duodenum:
- Pancreatic α-amylase - continues cleaving α-1,4 bonds → produces:
- Maltose (disaccharide)
- Maltotriose (trisaccharide)
- Limit dextrins (4-9 glucosyl residues with α-1,6 branch points)
- Bicarbonate - neutralizes gastric acid, restoring optimal pH for enzymatic activity
Brush Border Enzymes (on the luminal membrane of intestinal epithelial cells):
| Enzyme | Substrate | Products | Location |
|---|---|---|---|
| Glucoamylase (α-glucosidase) | α-1,4 bonds at nonreducing ends (exoglycosidase) | Glucose | Highest in ileum |
| Sucrase-isomaltase (bifunctional) | Sucrose (sucrase domain) | Glucose + Fructose | Highest in jejunum |
| Isomaltose/limit dextrins (isomaltase domain) | Glucose + Glucose | ||
| Lactase (β-galactosidase) | Lactose (β-1,4 bond) | Glucose + Galactose | Jejunum |
| Trehalase | Trehalose (α,α-1,1 bond - in mushrooms) | Glucose + Glucose | |
| Maltase | Maltose (α-1,4) | Glucose + Glucose |
All brush border disaccharidases are integral membrane proteins anchored to the luminal membrane by a N-terminal hydrophobic domain. They are heavily glycosylated to protect against intestinal proteases.
Regional distribution of digestion:
- Duodenum: pancreatic amylase produces maltose, maltotriose, limit dextrins
- Jejunum: sucrase-isomaltase is most active here - handles sucrose and branched products
- Ileum: glucoamylase continues digesting any remaining oligomers (final opportunity)
III. Absorption of Monosaccharides
The final products of digestion (glucose, galactose, fructose) are absorbed across intestinal epithelial cells via two distinct mechanisms:
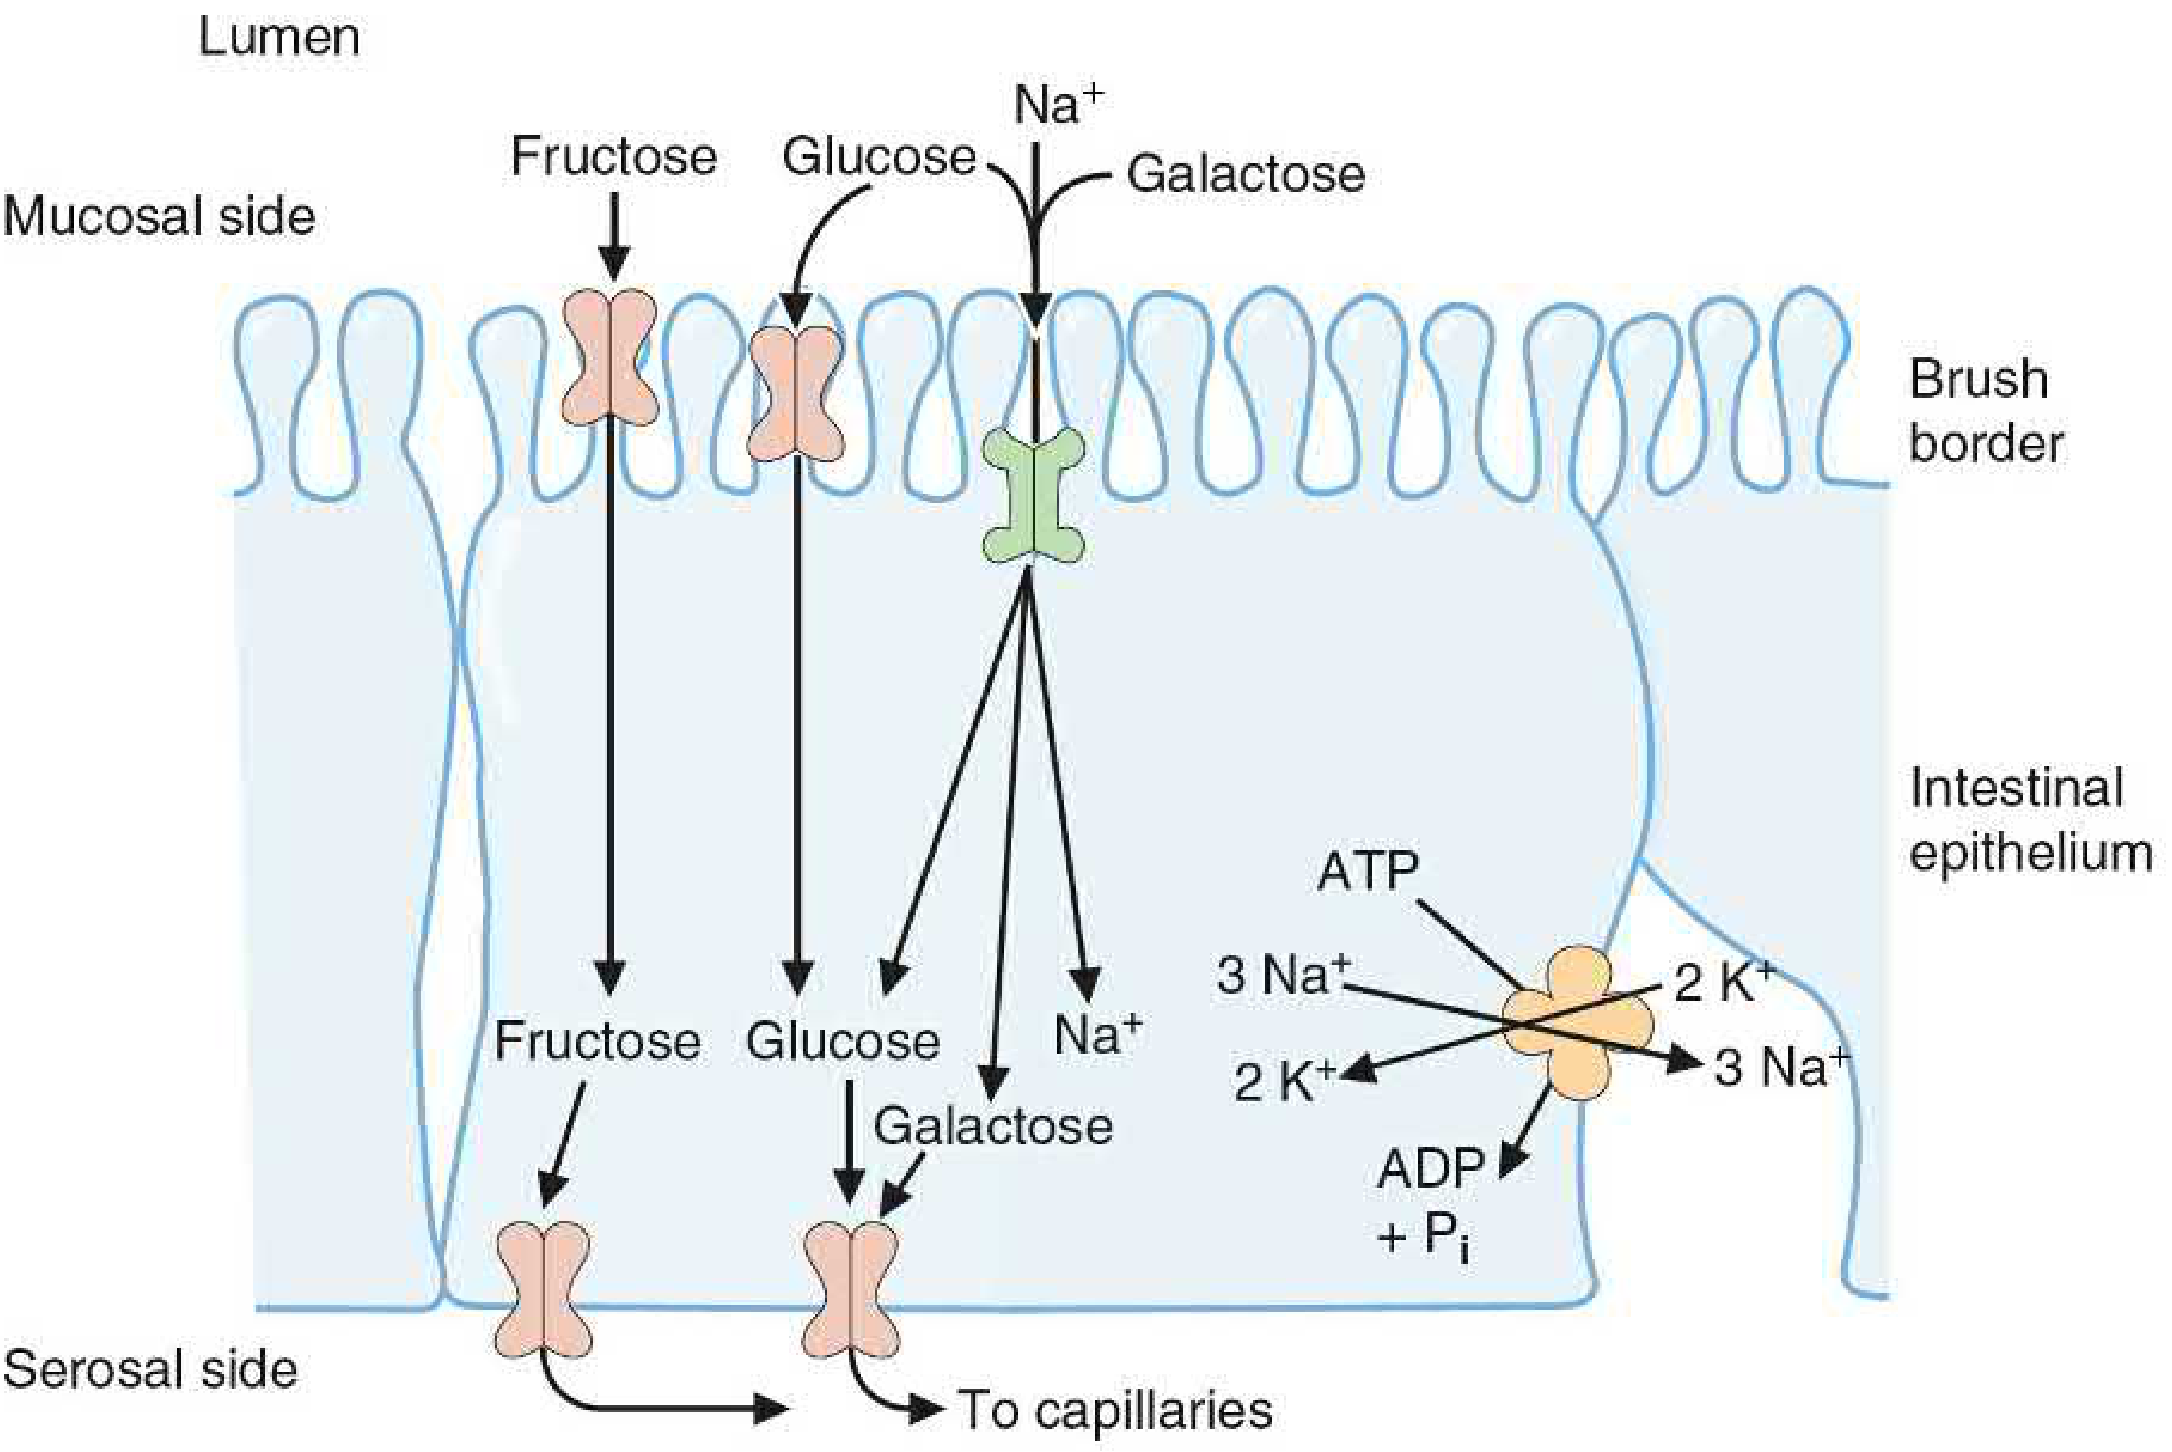
A. Na⁺-Dependent Active Transport (SGLT-1)
- Glucose and galactose are absorbed by SGLT-1 (Sodium-Glucose Linked Transporter 1) on the luminal/mucosal side of enterocytes
- SGLT-1 cotransports 1 glucose (or galactose) + 2 Na⁺ simultaneously into the cell
- The driving force is the low intracellular Na⁺ maintained by Na⁺/K⁺-ATPase on the serosal (basolateral) side - this is secondary active transport (indirectly ATP-dependent)
- Glucose and galactose compete for the same SGLT-1 transporter
- This allows glucose/galactose to be absorbed even against a concentration gradient
B. Facilitated Diffusion (GLUT Transporters)
- Fructose enters enterocytes via GLUT-5 on the luminal side - simple facilitated diffusion (no Na⁺ coupling)
- All three monosaccharides exit the cell on the serosal/basolateral side via GLUT-2 into the portal circulation
- Fructose and sugar alcohols are absorbed only down their concentration gradient - after a large intake, some remains in the lumen → bacterial fermentation → bloating, osmotic diarrhea
C. GLUT Transporter Summary
| Transporter | Sugar Transported | Tissue Location | Notes |
|---|---|---|---|
| SGLT-1 | Glucose, Galactose | Intestine, kidney | Na⁺-dependent (active) |
| GLUT-1 | Glucose | RBCs, brain, placenta | High affinity; constitutive |
| GLUT-2 | Glucose, Fructose, Galactose | Liver, intestine (serosal), kidney, β-cells | Low affinity, high capacity; bidirectional |
| GLUT-3 | Glucose | Neurons | Very high affinity; brain glucose supply |
| GLUT-4 | Glucose | Muscle, adipose tissue | Insulin-regulated (translocates to membrane) |
| GLUT-5 | Fructose | Small intestine, testes | Na⁺-independent |
After absorption, monosaccharides travel via the hepatic portal vein to the liver, which is the first organ to process dietary glucose, galactose, and fructose.
IV. Fate of Undigested Carbohydrates: Dietary Fiber
Polysaccharides that cannot be digested by human enzymes (cellulose, hemicellulose, pectins, gums, lignin) pass to the colon, where colonic bacteria metabolize them:
Products of bacterial fermentation:
- Gases: H₂, CO₂, CH₄ (methane) → flatulence
- Short-chain fatty acids (SCFAs):
- Acetic acid (C2)
- Propionic acid (C3)
- Butyric acid (C4) - preferred fuel for colonic epithelial cells; also has antiproliferative activity (protective against colorectal cancer)
- SCFAs can be absorbed by colonic mucosa and provide ~10% of total daily calories
Types of dietary fiber:
| Type | Examples | Sources |
|---|---|---|
| Insoluble | Cellulose, hemicellulose, lignin | Whole wheat, bran, vegetables |
| Soluble | Pectins, β-glucan, gums, mucilages | Oats, apples, legumes, citrus |
Soluble fibers (especially pectins and β-glucan) can lower blood cholesterol by binding bile acids in the intestine, reducing their reabsorption and forcing the liver to convert more cholesterol to new bile acids.
V. Glycemic Index
The glycemic index (GI) compares the rise in blood glucose after eating a carbohydrate versus an equivalent amount of glucose:
- High GI (near 1.0): glucose, galactose, lactose, maltose, most starches → rapid absorption, sharp insulin spike
- Low GI: fructose, sugar alcohols, resistant starch, soluble fiber (GI ~0 for non-starch polysaccharides)
Low-GI foods are considered more beneficial because they cause less fluctuation in insulin secretion, which helps with glycemic control.
VI. Clinical Correlates
Lactose Intolerance
- Most common carbohydrate malabsorption worldwide
- Congenital lactase deficiency - rare; presents in infancy with failure to thrive on breast milk or formula
- Adult-onset (primary) lactase deficiency - physiologic: lactase activity falls after weaning in most mammals and most humans. Persists into adulthood only in populations of North European origin and nomadic sub-Saharan/Arabian groups
- Mechanism: undigested lactose → bacterial fermentation → gas (CO₂, H₂) + lactic acid → osmotic diarrhea, bloating, abdominal cramps ~30-60 min after dairy ingestion
Sucrase-Isomaltase Deficiency
- Congenital deficiency common among the Inuit (Indigenous Arctic populations)
- Presents in infancy with sucrose intolerance: persistent diarrhea and failure to thrive when sucrose is introduced to the diet
Glucose-Galactose Malabsorption
- Rare autosomal recessive mutation in SGLT-1 gene
- Presents in neonates with severe osmotic diarrhea upon feeding (fructose is tolerated since it uses GLUT-5)
Hydrogen Breath Test
Used to diagnose carbohydrate malabsorption: unabsorbed sugars are fermented by colonic bacteria → H₂ exhaled in breath. A positive test (elevated H₂) after ingesting a test sugar confirms malabsorption of that sugar.
Diabetes and Dietary Fiber
High-fiber diets slow carbohydrate absorption, blunt postprandial glucose spikes, and reduce insulin demand - a cornerstone of dietary management in type 2 diabetes.
Basic Medical Biochemistry - A Clinical Approach, 6e, pp. 758-774; Harper's Illustrated Biochemistry, 32e
Digestion and absorption of lipids
Finding Sources
Finding Sources
Finding Sources
Finding Sources
Reading File
Good start from Harper's. Let me now search for the detailed chapter sections and read the Basic Medical Biochemistry lipid digestion content in parallel.
Finding Sources
Finding Sources
Finding Sources
Finding Sources
Excellent - several good sources found. Let me read the most detailed ones in parallel - Costanzo Physiology and Medical Physiology for the absorption sections, plus the Harrison's lipid digestion figure.
Reading File
Reading File
Excellent content from both sources. Let me now read more of Costanzo's absorption steps section and fetch the key diagrams in parallel.
Reading File
Loading Image
Excellent - perfect diagram of chylomicron formation. Let me now read the abnormalities section more and also get the Harrison's lipid digestion figure.
Reading File
Loading Image
I now have comprehensive content and excellent diagrams. Let me compile the full answer.
Digestion and Absorption of Lipids
Sources: Costanzo Physiology, 7e; Harper's Illustrated Biochemistry, 32e; Medical Physiology (Boron & Boulpaep); Harrison's Principles of Internal Medicine, 22e
I. Overview
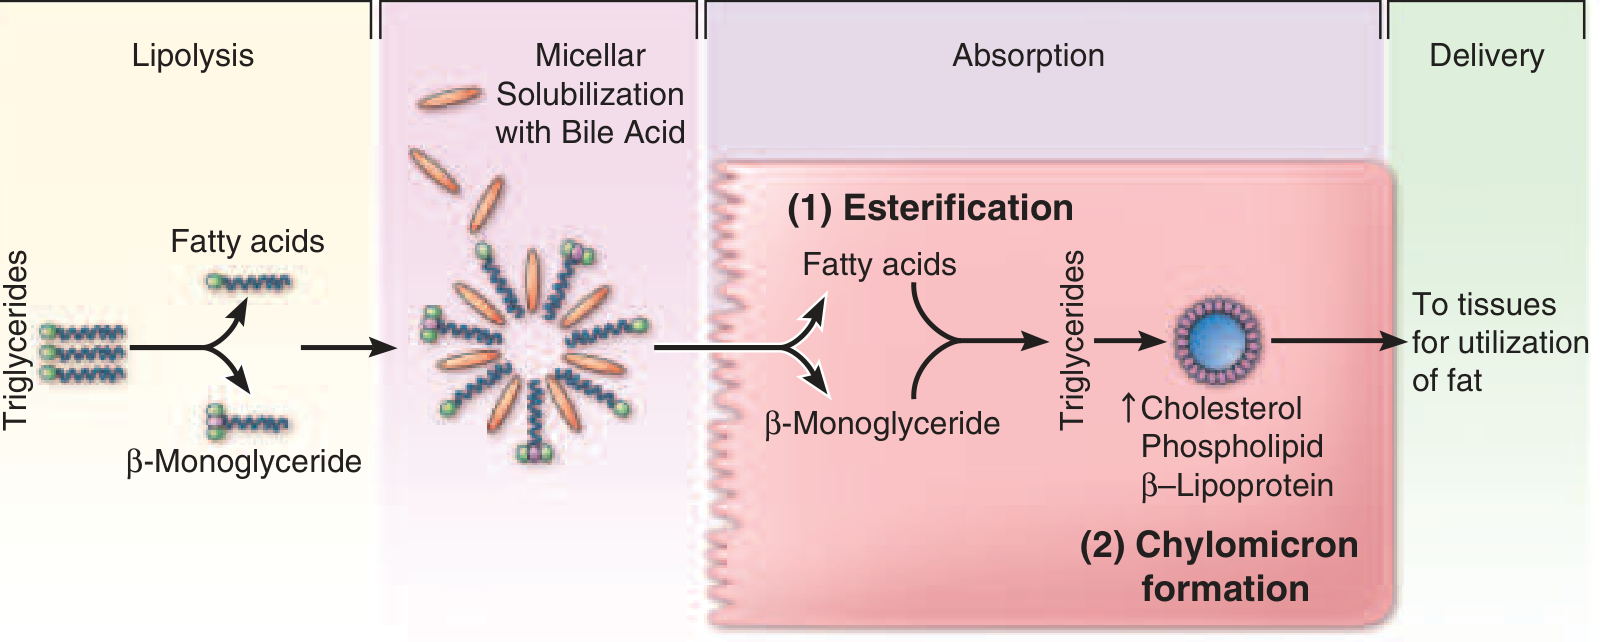
The major dietary lipids are triacylglycerols (TAG, ~90% of dietary fat), phospholipids, and cholesterol esters. Because lipids are hydrophobic, digestion and absorption require:
- Mechanical and chemical emulsification (lipid droplets → smaller particles)
- Enzymatic hydrolysis (lipases, phospholipase, esterase)
- Micellar solubilization (bile salts form mixed micelles to transport products through the aqueous lumen)
- Uptake into enterocytes, re-esterification, and chylomicron assembly
- Secretion into lymphatics (not portal blood)
Fat-soluble vitamins (A, D, E, K), cholesterol, and carotenes are absorbed dissolved within lipid micelles - their absorption is severely impaired on very-low-fat diets or when micelle formation is disrupted.
II. Digestion - Phase by Phase
A. Mouth
- Lingual lipase (from serous glands of tongue) begins hydrolysis of TAG at the sn-3 ester bond → 1,2-diacylglycerols + free fatty acids
- Limited contribution but relevant in neonates (where pancreatic lipase is immature)
B. Stomach
- Gastric lipase (from chief cells) continues hydrolysis at sn-3 bonds → 1,2-diacylglycerols + free fatty acids
- Free fatty acids and partial glycerides produced here act as emulsifying agents - they begin coating fat droplets, increasing the surface area for subsequent pancreatic enzymes
- Critical gastric function: slow, regulated emptying of chyme into the duodenum. CCK (cholecystokinin) is secreted when dietary lipids first appear in the small intestine and slows gastric emptying, allowing adequate time for pancreatic digestion
C. Small Intestine (Main Site of Digestion)
Stimulation of secretion:
- CCK (from I cells of duodenum/jejunum in response to fat and protein):
- Stimulates pancreatic enzyme secretion
- Stimulates gallbladder contraction → bile into duodenum
- Secretin (from S cells in response to acid):
- Stimulates pancreatic HCO₃⁻ secretion → neutralizes gastric acid
- Optimal pH for pancreatic lipase is ~6; acid inactivates it
Bile Salts and Emulsification:
- Bile salts (synthesized in liver from cholesterol, stored in gallbladder) are amphipathic - hydrophilic face and hydrophobic face
- They coat fat droplets, reducing surface tension and breaking them into smaller droplets → emulsification greatly increases surface area for enzymatic attack
- Liver secretes ~2 g/day cholesterol and bile salts into bile; dietary cholesterol adds ~0.5 g/day
Pancreatic Enzymes:
| Enzyme | Substrate | Products | Notes |
|---|---|---|---|
| Pancreatic lipase | TAG (positions 1 and 3, sn-1 and sn-3 ester bonds) | 2-monoacylglycerol + 2 free fatty acids | Requires colipase; inhibited by bile salts alone |
| Colipase | (not an enzyme itself) | Anchors lipase at lipid-water interface | Secreted as procolipase; activated by trypsin; displaces bile salts that inhibit lipase |
| Cholesterol ester hydrolase (pancreatic esterase) | Cholesterol esters | Free cholesterol + fatty acids | Secreted active; also hydrolyzes ester bonds of TAG → glycerol |
| Phospholipase A₂ | Phospholipids (sn-2 bond) | Lysolecithin + fatty acid | Secreted as proenzyme; activated by trypsin |
Key detail on colipase: Bile salts, while essential for emulsification, actually inhibit pancreatic lipase by displacing it from the lipid-water interface. Colipase (secreted as procolipase, activated by trypsin in the lumen) anchors at the interface and binds pancreatic lipase, restoring its activity. Without colipase, fat digestion would fail even in the presence of adequate lipase.
Final products of luminal digestion:
- 2-Monoacylglycerols (2-MAG)
- Free fatty acids (FFA) - long-chain (LCFA) and medium-chain (MCFA)
- Free cholesterol
- Lysolecithin (lysophospholipid)
- Glycerol (water-soluble; does not need micelles)
Note: Only ~25% of ingested TAG is completely hydrolyzed to glycerol + 3 fatty acids; the major product is 2-monoacylglycerol + 2 FFA.
III. Micellar Solubilization
Hydrophobic digestion products (FFA, 2-MAG, cholesterol, lysolecithin) are incorporated into mixed micelles with bile salts:
- Mixed micelles are cylindrical disk structures, ~4-6 nm diameter (50 Å)
- Exterior: hydrophilic face of bile salts (faces the aqueous lumen)
- Interior: hydrophobic lipid products, fat-soluble vitamins, cholesterol
- Micelles are water-soluble → can diffuse through the unstirred water layer adjacent to the brush border
- Most ingested lipid is absorbed by the mid-jejunum
- Bile salts are NOT absorbed with the lipids - they remain in the lumen, travel to the ileum, and are reabsorbed there into the enterohepatic circulation → returned to liver via portal vein → re-secreted in bile (recycled 6-10x/day)
IV. Uptake into Enterocytes and Intracellular Processing
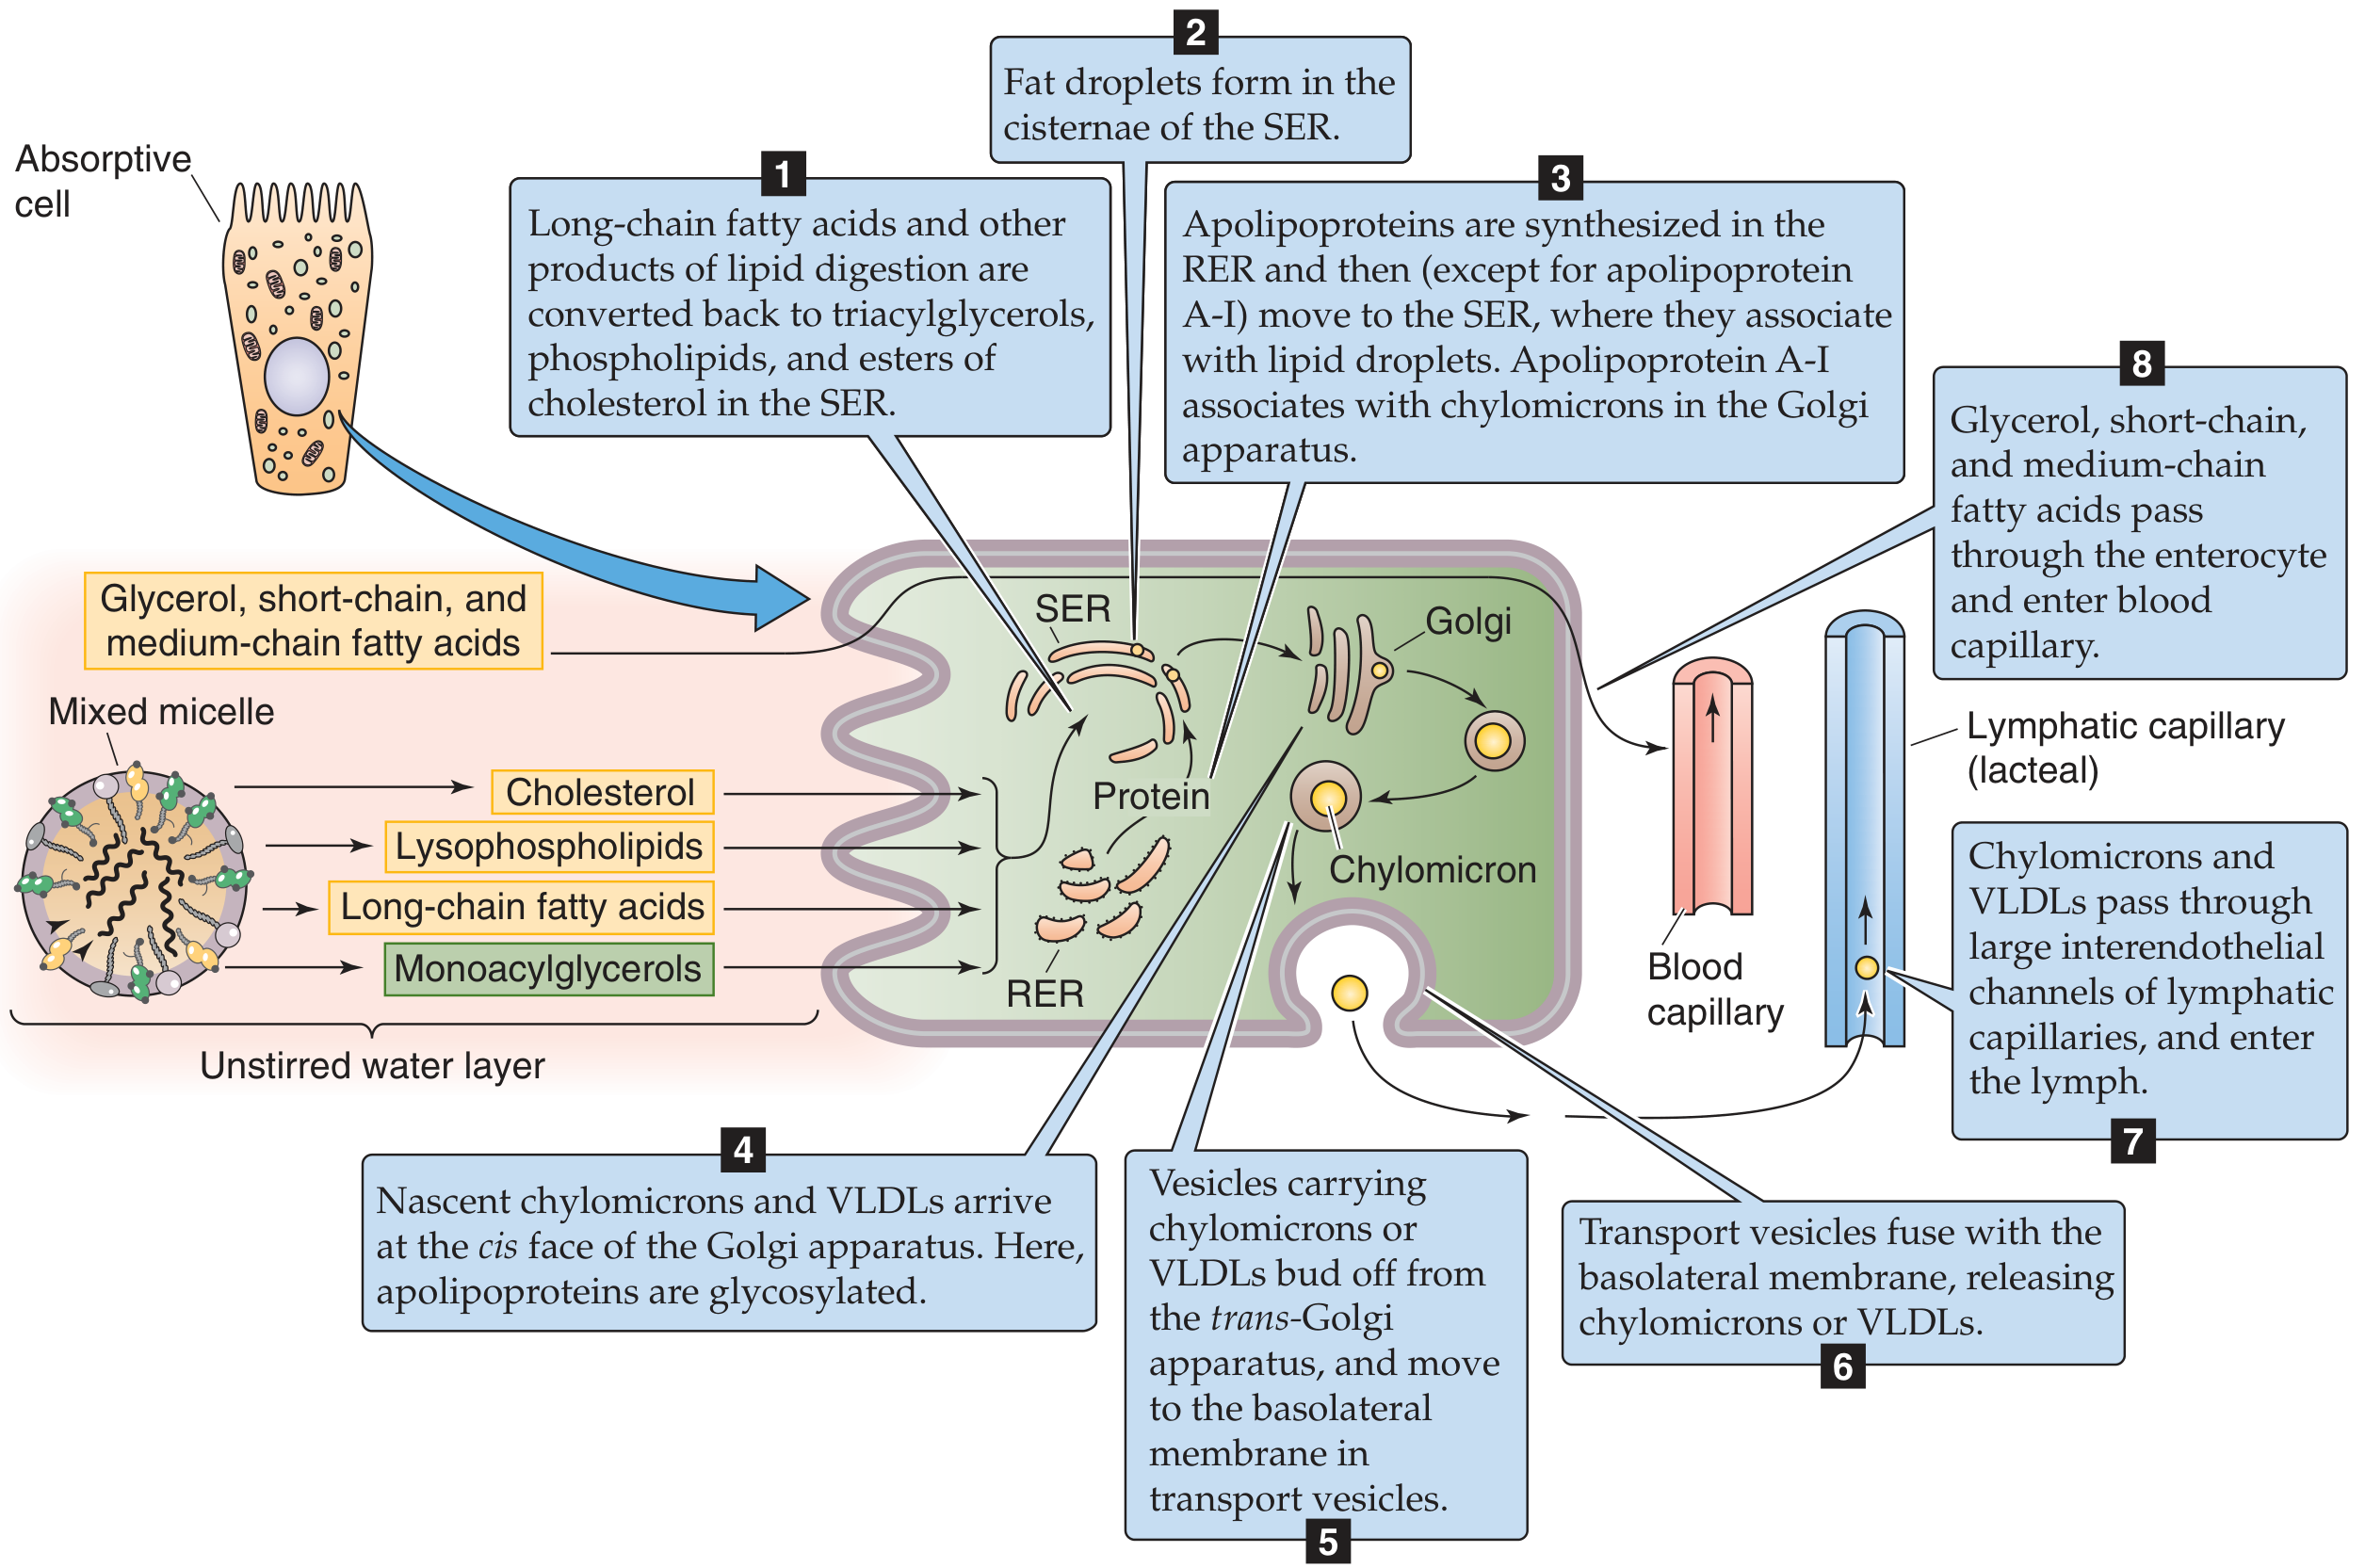
Step 1: Entry across the Brush Border
- Lipid products diffuse passively from the micelle down their concentration gradient across the lipid bilayer of the brush border membrane
- The micelles per se do NOT enter the cell
- Glycerol and short/medium-chain fatty acids (≤12C) - water-soluble enough to pass directly into the portal blood without further processing
Step 2: Re-esterification in the Smooth Endoplasmic Reticulum (SER)
Inside the enterocyte, long-chain fatty acids and 2-MAG are re-esterified:
- 2-MAG pathway: 2-MAG + 2 LCFA (via acyl CoA intermediates) → TAG (main pathway in intestinal cells)
- Phosphatidic acid pathway: glycerol-3-phosphate → used when glycerol is available (from glycerol released inside the cell)
- Lysolecithin → re-esterified to phosphatidylcholine (lecithin) by lysolecithin acyltransferase, or synthesized de novo
- Cholesterol → re-esterified to cholesterol esters (by ACAT: acyl-CoA:cholesterol acyltransferase)
Step 3: Apolipoprotein Synthesis
- Apoproteins (apolipoproteins) are synthesized in the rough ER (RER)
- Key apolipoproteins for chylomicrons: Apo B-48 (intestine-specific, essential structural apoprotein), Apo A-I, Apo A-II, Apo A-IV
- Apolipoproteins migrate from RER to SER where they associate with lipid droplets (except Apo A-I, which joins in the Golgi)
Step 4-7: Chylomicron Assembly and Secretion
- Nascent chylomicrons form in the SER: core of TAG + cholesterol esters; surface of phospholipids + apolipoproteins
- Nascent chylomicrons travel to the Golgi (cis face) where apolipoproteins are glycosylated
- Transport vesicles bud off from the trans-Golgi and migrate to the basolateral membrane
- Exocytosis releases chylomicrons into the lamina propria
Step 8: Entry into Lymphatics (NOT portal blood)
- Chylomicrons (avg. diameter ~1000 Å = 100 nm) are too large to cross the fenestrae of blood capillaries
- They enter the lymphatic capillaries (lacteals) through larger interendothelial channels
- Lymph → lacteals → cisternae chyli → thoracic duct → left subclavian vein → systemic circulation
V. Fate of Different Chain-Length Fatty Acids
| Fatty Acid Type | Chain Length | Processing | Route to Circulation |
|---|---|---|---|
| Short-chain FA | C2-C4 | Water-soluble; no re-esterification | Directly into portal blood |
| Medium-chain FA (MCFA) | C6-C12 | Water-soluble; not re-esterified in enterocyte | Directly into portal blood (not packaged into chylomicrons) |
| Long-chain FA (LCFA) | >C12 | Re-esterified to TAG in SER → chylomicrons | Via lymphatics → systemic blood |
Clinical application: MCT (medium-chain triglyceride) oil is used therapeutically in patients with fat malabsorption (e.g., short bowel syndrome, lymphatic obstruction) because MCFAs bypass the normal chylomicron pathway entirely and go directly into portal blood.
VI. Enterohepatic Circulation of Bile Salts
- Bile salts secreted by the liver (~2g/day) are recycled 6-10 times per day
- After completing their role in micellar solubilization, bile salts remain in the intestinal lumen
- In the terminal ileum: actively reabsorbed by the Na⁺-dependent bile acid transporter (IBAT/SLC10A2)
- Portal vein → liver → re-conjugated and re-secreted into bile
- A small amount (~5%) escapes reabsorption and is lost in feces → must be replaced by new synthesis from cholesterol
VII. Clinical Correlates - Causes of Fat Malabsorption (Steatorrhea)
Steatorrhea (excess fat in feces, fatty, foul-smelling stools) results from failure at any step:
| Cause | Mechanism |
|---|---|
| Chronic pancreatitis / Cystic fibrosis | Inadequate pancreatic lipase and colipase → undigested TAG in feces |
| Zollinger-Ellison syndrome | Gastrinoma → massive H⁺ secretion → duodenal pH too low → lipase inactivated |
| Bile salt deficiency (ileal resection, cholestasis, SIBO) | Impaired micelle formation → fat-soluble vitamins and LCFA not absorbed |
| Abetalipoproteinemia | Absence of Apo B-48 → chylomicrons cannot be assembled → massive fat accumulation in enterocytes; presents with steatorrhea, acanthocytosis, retinitis pigmentosa, ataxia |
| Ileal resection | Interrupts enterohepatic circulation → bile salt depletion → impaired micelle formation |
| Orlistat | Pharmacologic inhibitor of pancreatic lipase → used to treat obesity by preventing TAG hydrolysis |
VIII. Absorption of Cholesterol
- Dietary cholesterol (~0.5 g/day) + biliary cholesterol (~2 g/day) enter the intestinal lumen
- Incorporated into mixed micelles → passively absorbed by enterocytes
- NPC1L1 (Niemann-Pick C1-Like 1 protein) on the brush border - the primary cholesterol transporter; ezetimibe blocks this transporter → used to lower blood cholesterol
- Inside the enterocyte: esterified by ACAT → incorporated into chylomicrons
- Only ~50% of dietary cholesterol is absorbed (vs. ~98% of dietary fat)
Costanzo Physiology, 7e, pp. 383-390; Harper's Illustrated Biochemistry, 32e, pp. 539-541; Medical Physiology (Boron & Boulpaep), pp. 1383-1386; Harrison's Principles of Internal Medicine, 22e
Renal function tests
Finding Sources
Finding Sources
Good sources found. Let me read the main sections from Smith & Tanagho Urology, Henry's Clinical Diagnosis (GFR/creatinine), and Miller's Anesthesia in parallel.
Reading File
Reading File
Reading File
Excellent content from all three sources. Let me now read the continuation of the Smith & Tanagho section (BUN ratio, urine tests, tubular function) and the Miller's Anesthesia GFR section.
Reading File
Reading File
Excellent content. Let me now read the urinalysis and tubular function sections, and also look for urinary tests sections.
Reading File
Finding Sources
That hit references. Let me read the urinalysis and tubular function sections from the earlier block.
Reading File
Finding Sources
Let me now search for the urinalysis and tubular function test sections plus the Quick Compendium content.
Reading File
Finding Sources
Excellent content. Let me now read the Quick Compendium BUN:Cr ratio section continuation and the CKD staging section.
Reading File
Finding Sources
Reading File
I now have comprehensive content covering all major renal function tests. Let me compile the full answer.
Renal Function Tests
Sources: Smith & Tanagho's General Urology, 19e; Miller's Anesthesia, 10e; Quick Compendium of Clinical Pathology, 5e; Henry's Clinical Diagnosis and Management by Laboratory Methods
Overview
Renal function tests assess the ability of the kidneys to filter waste, concentrate/dilute urine, and maintain electrolyte and acid-base homeostasis. They are broadly classified into:
- Glomerular function tests (GFR, creatinine, BUN)
- Tubular function tests (concentration/dilution, FENa, urine osmolality)
- Urinalysis (dipstick + microscopy)
- Newer biomarkers (Cystatin C, microalbumin, β₂-microglobulin)
Key reference ranges (Miller's Anesthesia, 10e):
| Test | Reference Range | Units |
|---|---|---|
| Urea nitrogen (BUN) | 5-25 | mg/dL |
| Creatinine | 0.5-1.5 | mg/dL |
| Sodium | 133-147 | mmol/L |
| Potassium | 3.2-5.2 | mmol/L |
| Chloride | 94-110 | mmol/L |
| CO₂ (bicarb) | 22-32 | mmol/L |
| Uric acid | 2.5-7.5 | mg/dL |
| Calcium | 8.5-10.5 | mg/dL |
| Phosphorus | 2.2-4.2 | mg/dL |
| Urine specific gravity | 1.002-1.030 | |
| Urine pH | 4.5-8.0 | |
| Urine protein | 0 | mg/dL |
| Urine RBCs | 0-3 | per HPF |
| Urine WBCs | 0-5 | per HPF |
| Casts | 0-2 | per LPF |
I. Glomerular Function Tests
A. Glomerular Filtration Rate (GFR)
The GFR is the gold-standard measure of kidney function. Normal GFR is approximately 125 mL/min (or ~90-120 mL/min/1.73 m²).
Clinical thresholds:
- GFR 50% of normal - kidney function begins to decline but patient usually remains asymptomatic; serum creatinine/BUN start rising
- GFR 30% of normal - moderate renal insufficiency; nocturia, anemia, decreased appetite, calcium/phosphorus abnormalities
- GFR 5-10% of normal - End-Stage Renal Disease (ESRD); uremia, acidemia, volume overload, neurologic/cardiac/respiratory manifestations → renal replacement therapy required
Direct measurement of GFR:
- Inulin clearance - the true gold standard (freely filtered, not secreted or reabsorbed), but requires intravenous infusion - impractical clinically
- Radionuclide methods (e.g., ¹²⁵I-iothalamate, ⁹⁹mTc-DTPA) - research and transplant evaluation
B. Serum Creatinine
Creatinine is the end product of creatine metabolism in skeletal muscle. It is:
- Produced at a constant daily rate (reflecting muscle mass)
- Freely filtered at the glomerulus
- Minimally secreted by the distal tubule (slightly overestimates GFR)
- Not significantly affected by dietary intake (unlike BUN)
Normal values:
- Adults: 0.8-1.2 mg/dL (Smith & Tanagho) / 0.5-1.5 mg/dL (Miller's)
- Young children: 0.4-0.8 mg/dL
- Pregnancy: 0.5-1.0 mg/dL (lower due to increased GFR)
Important caveats:
- Serum creatinine remains within normal range until ~50% of renal function is lost - insensitive for early CKD
- A 50% reduction in GFR may cause only a doubling of creatinine (e.g., 1.0 → 2.0 mg/dL), which can be missed without a baseline value
- Falsely elevated by: Jaffe reaction interference (cephalosporins, ketones, glucose, fructose, ascorbic acid)
- Low muscle mass (elderly, malnourished, amputees) → falsely low creatinine despite reduced GFR
C. Estimated GFR (eGFR) Equations
Several formulas estimate GFR from serum creatinine without requiring urine collection:
1. Cockcroft-Gault Formula:
CrCl (mL/min) = [(140 - Age) × Ideal Body Weight (kg)] / [Serum Creatinine (mg/dL) × 72]
× 0.85 (if female)
- Corrects for age (declining muscle mass) and sex
- Overestimates GFR in obese, edematous, or cachectic patients (IBW ≠ actual body weight in these groups)
- Does not account for extrarenal elimination or tubular secretion
2. MDRD (Modification of Diet in Renal Disease) Formula:
eGFR = 186.3 × Cr⁻¹·¹⁵⁴ × Age⁻⁰·²⁰³ × 1.212 (if Black) × 0.742 (if female)
- Validated in adults with GFR <60 mL/min/1.73 m² (ages 18-70)
- Not reliable when GFR >60 mL/min/1.73 m² - tends to underestimate
- Not validated in pregnant women, children, or acutely ill hospitalized patients
3. CKD-EPI (Chronic Kidney Disease Epidemiology Collaboration) Formula:
- Most accurate equation currently available
- Reliable across both low and high GFR ranges
- Better predictor of ESRD risk, cardiovascular mortality, and all-cause mortality than MDRD
- Uses creatinine, age, sex, and race
D. Creatinine Clearance (24-hour Urine)
A timed (usually 24-hour) urine collection allows direct calculation:
CrCl (mL/min) = [Urine Creatinine (mg/dL) × Urine Volume (mL)] / [Plasma Creatinine (mg/dL) × Collection Time (min)]
- Normal: 90-110 mL/min (uncorrected); 70-140 mL/min (corrected for body surface area)
- More accurate than serum creatinine alone but limited by collection errors (incomplete 24-h urine is the major pitfall)
E. Blood Urea Nitrogen (BUN)
Urea is the primary metabolite of protein catabolism, excreted entirely by the kidneys. However, urea is:
- Freely filtered at the glomerulus
- Partially reabsorbed in the tubule (especially when flow is slow → higher BUN in dehydration)
Normal: 5-25 mg/dL
BUN is less specific than creatinine for renal insufficiency because it is affected by:
- Dietary protein intake (high protein → high BUN)
- Hydration status (dehydration → high BUN)
- GI bleeding (blood digestion = protein load → high BUN)
- Liver disease (impaired urea synthesis → low BUN)
- Steroid use, tissue catabolism, exercise
BUN rises significantly only after ~two-thirds of renal function is lost.
F. BUN:Creatinine Ratio
Normal ratio: ~10:1
| Ratio | Interpretation |
|---|---|
| >20:1 (up to 40:1) | Prerenal azotemia (dehydration, bilateral obstruction, GI bleeding, high-protein diet) |
| <10:1 | Liver disease, overhydration, low protein intake, intrarenal disease |
| 10-20:1 | Normal or intrarenal pathology |
II. Tubular Function Tests
A. Urine Specific Gravity
Reflects the kidney's concentrating ability (number and weight of dissolved particles).
- Normal range: 1.002-1.030
- In renal failure: concentrating ability is progressively lost → specific gravity becomes fixed at 1.006-1.010 (isosthenuria)
- Diluting ability tends to be preserved until renal damage is extreme
B. Urine Osmolality
More precise than specific gravity. Reflects molar concentration of all solutes.
- Normal range: 50-1200 mOsm/kg (varies with hydration)
- Maximum concentration (after water deprivation): >800 mOsm/kg
- In prerenal AKI: urine osmolality >500 mOsm/kg (kidney conserving water)
- In intrinsic renal AKI (ATN): urine osmolality 300-400 mOsm/kg (isoosmotic = tubular dysfunction)
C. Fractional Excretion of Sodium (FENa)
The FENa is one of the most useful tests to differentiate prerenal from intrinsic renal (ATN) causes of acute kidney injury:
FENa (%) = [Urine Na × Plasma Creatinine] / [Plasma Na × Urine Creatinine] × 100
| FENa | Interpretation |
|---|---|
| <1% | Prerenal azotemia (kidney avidly retaining sodium; tubular function intact) |
| >2% | Intrinsic renal failure / ATN (tubules unable to reabsorb sodium) |
Caveat: FENa may be misleadingly low (<1%) in contrast nephropathy, myoglobinuria, and early obstruction. In patients receiving diuretics, FE Urea (<35% = prerenal; >35% = renal) is more reliable.
D. Urine Concentration/Dilution Tests
- Water deprivation test: urine osmolality should rise to >800 mOsm/kg in normal subjects; failure indicates inability to concentrate → tubular dysfunction or AVP deficiency (diabetes insipidus)
- DDAVP (desmopressin) test: differentiates central from nephrogenic DI
III. Urinalysis
A. Dipstick (Chemical Analysis)
| Parameter | Normal | Abnormal Significance |
|---|---|---|
| pH | 4.5-8.0 | Acidic in metabolic acidosis; alkaline in UTI (urease-producing organisms), RTA |
| Specific gravity | 1.002-1.030 | Low = dilute/CKD; Fixed 1.010 = isosthenuria |
| Protein | Negative (<150 mg/day) | See proteinuria section |
| Glucose | Negative | Glycosuria = diabetes or renal glycosuria |
| Ketones | Negative | DKA, starvation |
| Blood | Negative | Hematuria (glomerular, tubular, lower tract) |
| Bilirubin | Negative | Conjugated hyperbilirubinemia |
| Leukocyte esterase | Negative | UTI, pyuria |
| Nitrites | Negative | Gram-negative bacteriuria |
B. Proteinuria
- Normal: <150 mg/day (mostly Tamm-Horsfall protein from tubular cells)
- Microalbuminuria: 30-300 mg/day albumin = earliest marker of diabetic nephropathy and hypertensive nephropathy
- Significant proteinuria: >300 mg/day
- Nephrotic range proteinuria: >3.5 g/day
Dipstick is most sensitive to albumin and relatively insensitive to other proteins (Bence-Jones protein, light chains).
Spot urine protein:creatinine ratio (mg/mg) correlates with 24-h protein excretion and is now widely used to avoid 24-h collection:
- Ratio of 0.3 ≈ 300 mg/g ≈ 300 mg/day
- Normal: <0.2
C. Urine Microscopy
| Finding | Significance |
|---|---|
| RBC casts | Glomerulonephritis (pathognomonic) |
| WBC casts | Pyelonephritis, tubulointerstitial nephritis |
| Granular ("muddy brown") casts | Acute tubular necrosis (ATN) |
| Waxy/broad casts | Advanced CKD (wide, dilated tubules) |
| Hyaline casts | Normal (concentrated urine, fever, exercise) |
| Fatty casts / oval fat bodies | Nephrotic syndrome |
| Dysmorphic RBCs / acanthocytes | Glomerular bleeding |
| WBCs (pyuria) | UTI, tubulointerstitial nephritis |
| Eosinophils in urine | Acute interstitial nephritis (allergic) |
| Crystals | Varies: uric acid (gout, hyperuricemia), calcium oxalate (ethylene glycol poisoning), struvite (UTI with urease organisms) |
IV. Newer / Emerging Biomarkers
Cystatin C
- Produced by nearly all nucleated cells, freely filtered by the glomerulus, completely reabsorbed and catabolized by the proximal tubule (none excreted in urine normally)
- Not influenced by muscle mass, age, or sex → superior to creatinine in detecting early GFR decline
- Superior to creatinine as a predictor of cardiovascular mortality
- Used to calculate eGFR (CKD-EPI Cystatin C equation) and as an early indicator of evolving CKD
β₂-Microglobulin and Lysozyme (Urine)
- Normally filtered and reabsorbed by the proximal tubule
- Elevated urine levels indicate proximal tubular dysfunction (e.g., Fanconi syndrome, heavy metal toxicity)
NGAL (Neutrophil Gelatinase-Associated Lipocalin)
- Rises in serum and urine within 2-4 hours of AKI - far earlier than creatinine (which may not rise for 24-48 h)
- Useful for early detection of AKI in ICU patients, post-cardiac surgery, and contrast nephropathy
Microalbumin
- The microalbumin assay detects as little as 0.3 mg/dL albumin - sensitive early marker of glomerular dysfunction
- Screening for CKD in diabetics and hypertensives: annual eGFR + microalbumin test recommended by KDIGO/NKF
V. AKI Differentiation - Integrated Approach
| Parameter | Prerenal | Intrinsic Renal (ATN) | Postrenal |
|---|---|---|---|
| BUN:Cr ratio | >20:1 | <20:1 | Variable |
| Urine specific gravity | >1.020 | <1.010 | Variable |
| Urine osmolality | >500 mOsm/kg | 300-400 mOsm/kg | Variable |
| FENa | <1% | >2% | Variable |
| FE Urea | <35% | >35% | - |
| Urine microscopy | Normal | Muddy brown granular casts | Normal or mild |
| Response to fluids | Improves | Does not improve | - |
Postrenal AKI (obstructive) is best diagnosed by renal ultrasound (hydronephrosis).
VI. CKD Staging (KDIGO)
| Stage | GFR (mL/min/1.73 m²) | Description |
|---|---|---|
| G1 | ≥90 | Normal or high GFR + evidence of kidney damage |
| G2 | 60-89 | Mildly decreased |
| G3a | 45-59 | Mildly to moderately decreased |
| G3b | 30-44 | Moderately to severely decreased |
| G4 | 15-29 | Severely decreased |
| G5 | <15 | Kidney failure (ESRD) |
CKD is defined as GFR <60 mL/min/1.73 m² OR albuminuria for ≥3 consecutive months, regardless of GFR.
Screening for CKD is recommended annually in high-risk groups: diabetes mellitus, hypertension, and family history of renal disease (NKF guidelines).
Smith & Tanagho's General Urology, 19e, pp. 70-74; Miller's Anesthesia, 10e, pp. 8432-8435; Quick Compendium of Clinical Pathology, 5e, pp. 18-20; Henry's Clinical Diagnosis and Management by Laboratory Methods
This is a shared conversation. Sign in to Orris to start your own chat.