Describe myocardial infarction in detail for medical exam
myocardial infarction ECG ST elevation pathology
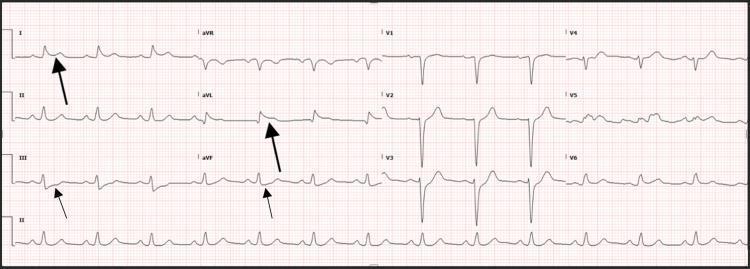
This diagnostic image is a 12-lead electrocardiogram (ECG) displayed on standard grid paper, illustrating findings characteristic of high lateral ST-segment elevation myocardial infarction (STEMI). The primary visual pathology includes significant ST-segment elevation (STE) in the high lateral leads, specifically lead I and lead aVL, marked by large black arrows. This is accompanied by prominent reciprocal ST-segment depression (STD) in the inferior leads, III and aVF, highlighted by small black arrows. The QRS complexes appear relatively narrow without evidence of pathological Q waves at this stage. The ECG serves as an educational tool for identifying early ischemic changes and reciprocal patterns in the setting of acute coronary syndrome (ACS). It is highly relevant for medical training in cardiology, emergency medicine, and critical care, demonstrating the visual cues used to diagnose arterial occlusion (such as the left anterior descending or diagonal branches) in a post-cardiac arrest clinical context.
A 12-lead electrocardiogram (ECG) recorded on standard grid paper, demonstrating acute diagnostic findings consistent with an ST-elevation myocardial infarction (STEMI). The tracing shows normal sinus rhythm with a physiological heart rate. The primary pathology is significant ST-segment elevation (STE) visible in the precordial leads, most prominently in V2, V3, and V4, measuring approximately 2–3 mm above the isoelectric baseline. These anterior leads also display upright, peaked T waves associated with the acute ST elevation. The QRS complexes maintain relatively normal duration and morphology without evidence of bundle branch blocks. These findings are clinically diagnostic of acute myocardial injury in the territory of the left anterior descending (LAD) coronary artery, often indicating complications such as acute stent thrombosis or new-onset occlusion in the anteroseptal and apical regions. The limb leads (I, II, III, aVR, aVL, aVF) show relatively stable baselines compared to the precordial changes. This ECG serves as a critical educational tool for identifying hyperacute ischemic changes in a post-intervention clinical context.
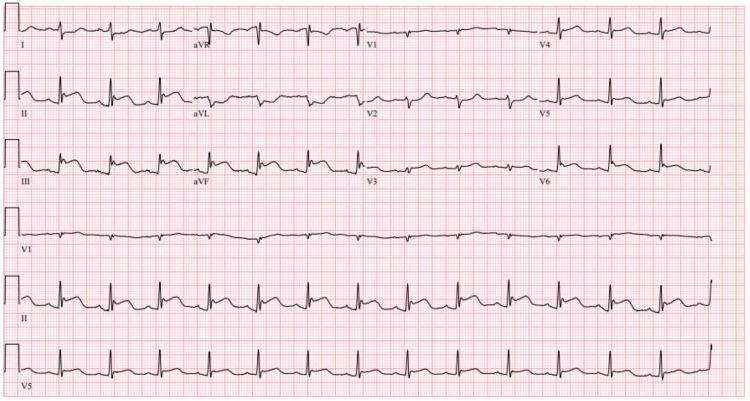
A standard 12-lead electrocardiogram (ECG) printed on standard red grid paper, demonstrating findings consistent with an acute inferior wall myocardial infarction (STEMI). The primary visual pathology includes significant ST-segment elevation in the inferior leads (II, III, and aVF). In lead III, the ST elevation is more pronounced than in lead II, a feature often associated with right ventricular involvement or a right coronary artery (RCA) occlusion. Reciprocal ST-segment depressions are visible in the lateral leads, particularly in lead I and aVL. The precordial leads (V1-V6) show mild ST-segment changes, with some flattening in V2 and V3. The QRS complexes are relatively narrow, and the baseline rhythm appears to be a regular sinus rhythm. This diagnostic image serves as a classic educational example of an ST-elevation myocardial infarction (STEMI) involving the inferior myocardial wall, highlighting the importance of recognizing regional lead patterns and reciprocal changes in emergency cardiology.
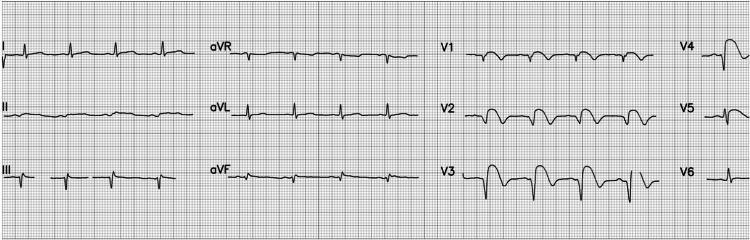
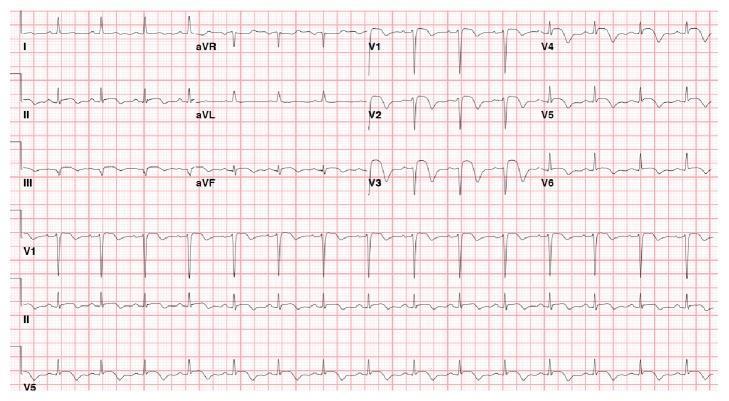
A 12-lead electrocardiogram (ECG) demonstrating an acute ST-elevation myocardial infarction (STEMI) with characteristic anterior and anterolateral findings. The tracing displays a normal sinus rhythm with a heart rate of approximately 84 beats per minute and normal P wave morphology. Significant pathology is localized to the precordial leads, specifically V2 through V5, which exhibit pronounced ST-segment elevation. This elevation presents with a convex 'tombstoning' morphology, a high-risk indicator of extensive myocardial injury. Additionally, evolving QS waves are visible in leads V2 and V3, indicating necrotic changes or transmural infarction. These findings are clinically consistent with an acute occlusion of the left anterior descending (LAD) coronary artery. The limb leads (I, II, III, aVR, aVL, aVF) show relatively stable baselines, though mild reciprocal changes or secondary ST-T wave abnormalities may be present in the inferior leads. This diagnostic image serves as a classic educational example of early-stage STEMI progression and the visual identification of localized ischemic injury on electrocardiography.
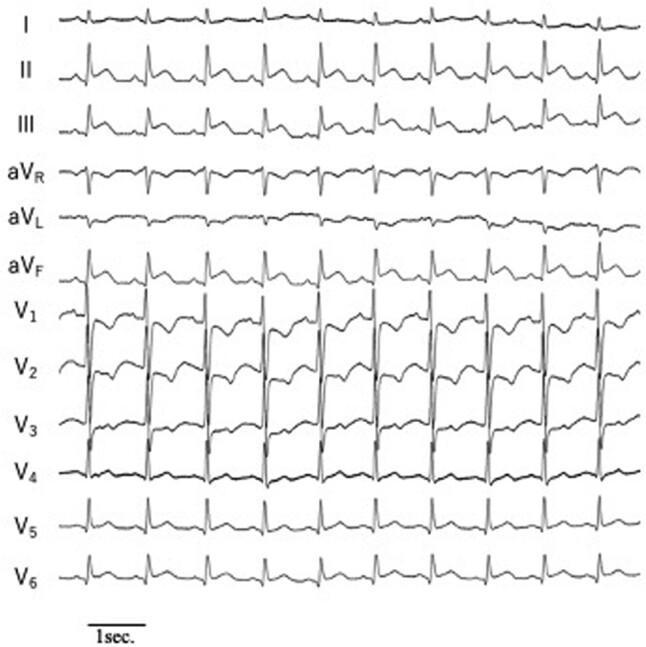
A diagnostic electrocardiogram (ECG) tracing displaying twelve leads arranged vertically from I to V6. The primary pathology is localized to the inferior leads (II, III, and aVF), which exhibit significant ST-segment elevation above the isoelectric line, merging into upright T waves. This finding is characteristic of an acute ST-elevation myocardial infarction (STEMI) involving the inferior wall of the myocardium. In the precordial leads (V1-V6), there is a progressive increase in R-wave amplitude from V1 through V4, followed by a slight decrease in V5 and V6. The QRS complexes in V1-V3 show sharp upward spikes, while V4-V6 display more rounded morphologies. Conversely, leads I, aVR, and aVL show relative ST-segment depression, which may represent reciprocal changes. The tracing demonstrates a regular rhythm with consistent QRS morphology across the cardiac cycles shown, serving as a classic clinical example for cardiology training and emergency medicine diagnostics.
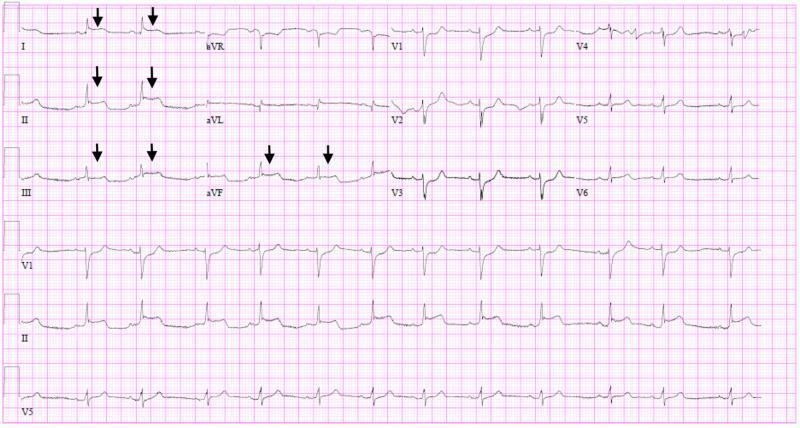
A standard 12-lead electrocardiogram (ECG) displayed on a pink grid background, illustrating acute myocardial changes in a clinical patient. The tracing shows a regular rhythm with discernible P waves and narrow QRS complexes. Significant pathology is highlighted by black arrows pointing to pronounced ST-segment elevations (STE) in the inferior limb leads (II, III, and aVF) and the lateral lead I. The morphology of the ST-segment elevation in these leads is convex (tombstoning) or upwardly sloped, merging with peaked T waves. Concomitantly, there are evident reciprocal ST-segment depressions (STD) in the precordial leads, specifically V1 through V4, where the ST segments exhibit a down-sloping morphology. The magnitude of elevation is most prominent in lead II. These findings are highly characteristic of an acute ST-elevation myocardial infarction (STEMI) pattern, which in this clinical context—associated with COVID-19 and elevated troponins—indicates severe myocardial injury or fulminant myocarditis mimicking an inferior-lateral infarction. The ECG serves as an educational example of identifying regional ST-segment changes and reciprocal patterns in cardiovascular emergency medicine.
"myocardial infarction"[MeSH Terms] AND "diagnosis"[MeSH Terms]
Myocardial Infarction - Comprehensive Medical Exam Review
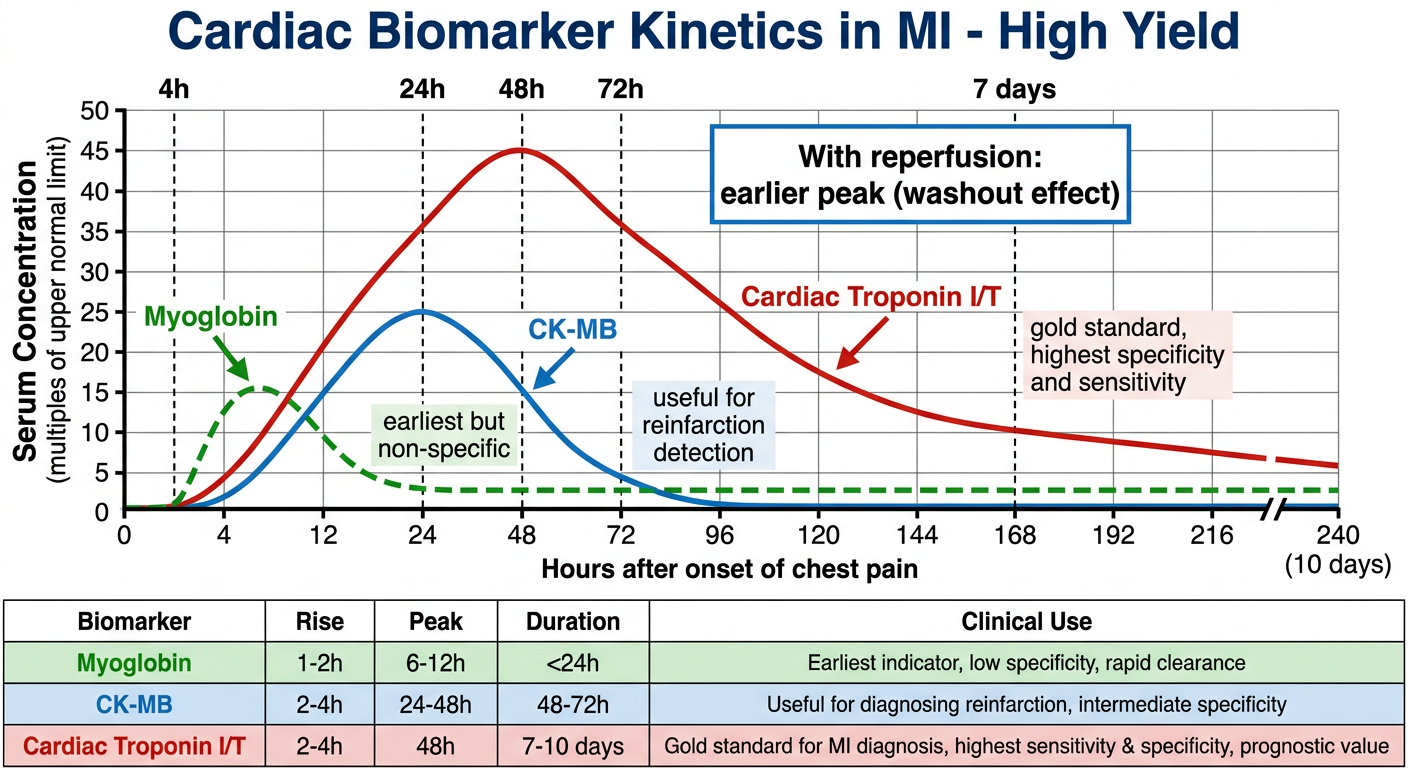
1. Definition
- Robbins & Kumar Basic Pathology, p.353
2. Epidemiology & Risk Factors
- ~10% of MIs occur before age 40; ~45% before age 65
- Men > Women in risk, but the gap narrows with age; women are relatively protected during reproductive years due to estrogen
- Post-menopausal women have accelerated IHD - IHD is the most common cause of death in older women
- Major underlying cause: atherosclerosis
3. Classification - 4th Universal Definition (5 Types)
| Type | Description |
|---|---|
| Type 1 | Spontaneous MI - plaque rupture/erosion with thrombosis |
| Type 2 | MI due to ischemic imbalance (supply/demand mismatch without plaque rupture, e.g., spasm, anemia, tachyarrhythmia) |
| Type 3 | Sudden cardiac death before biomarkers available |
| Type 4 | PCI-related MI (Type 4a: periprocedural; Type 4b: stent thrombosis) |
| Type 5 | CABG-associated MI |
- Sabiston Textbook of Surgery, p.2839
- STEMI - ST-segment elevation; complete transmural occlusion; higher mortality (~10% in-hospital)
- NSTEMI - No ST elevation; subendocardial; partial occlusion or spasm; lower in-hospital mortality (~6%)
4. Pathogenesis
Coronary Artery Occlusion Sequence
- Plaque disruption - an atheromatous plaque is eroded or suddenly disrupted by endothelial injury, intraplaque hemorrhage, or mechanical forces - exposing subendothelial collagen and necrotic plaque contents
- Platelet activation - platelets adhere, aggregate, and release thromboxane A₂, ADP, and serotonin, further amplifying aggregation and causing vasospasm
- Coagulation cascade - activation by tissue factor exposure adds to the growing thrombus
- Complete occlusion - within minutes, the enlarging thrombus may completely occlude the coronary artery lumen
- Robbins & Kumar Basic Pathology, p.353-354
Myocardial Response to Ischemia
| Timeframe | Event |
|---|---|
| Seconds | Aerobic metabolism ceases; ATP drops; lactic acid accumulates |
| Minutes | Loss of contractility (reversible) |
| 20-40 minutes | Irreversible damage and coagulative necrosis of myocytes |
| First injury | Sarcolemmal membrane disruption allows intracellular macromolecules to leak |
Key: Ischemia of 20-40 minutes = point of no return (irreversible necrosis)
- Robbins & Kumar Basic Pathology, p.354
Why Subendocardium is Most Vulnerable
- Last region to receive blood from epicardial vessels
- Highest intramural pressures during systole impede blood inflow
- Damage starts subendocardially and spreads outward (wavefront phenomenon)
- Guyton & Hall Medical Physiology
5. Patterns of Infarction by Vessel
| Vessel Occluded | Frequency | Territory Infarcted |
|---|---|---|
| LAD (proximal) | 40-50% | Anterior LV wall, anterior 2/3 of septum, apex |
| RCA (proximal) | 30-40% | Inferior/posterior LV, posterior 1/3 of septum, RV |
| LCX (proximal) | 15-20% | Lateral LV |
-
Right dominant heart (90%): RCA gives rise to posterior descending artery → posterior septum + posterior LV
-
Isolated RV infarcts: only 1-3% of IHD cases
-
Posterior/posteroseptal MIs extend into RV in 15-30% of cases
-
Robbins & Kumar Basic Pathology, p.355-357
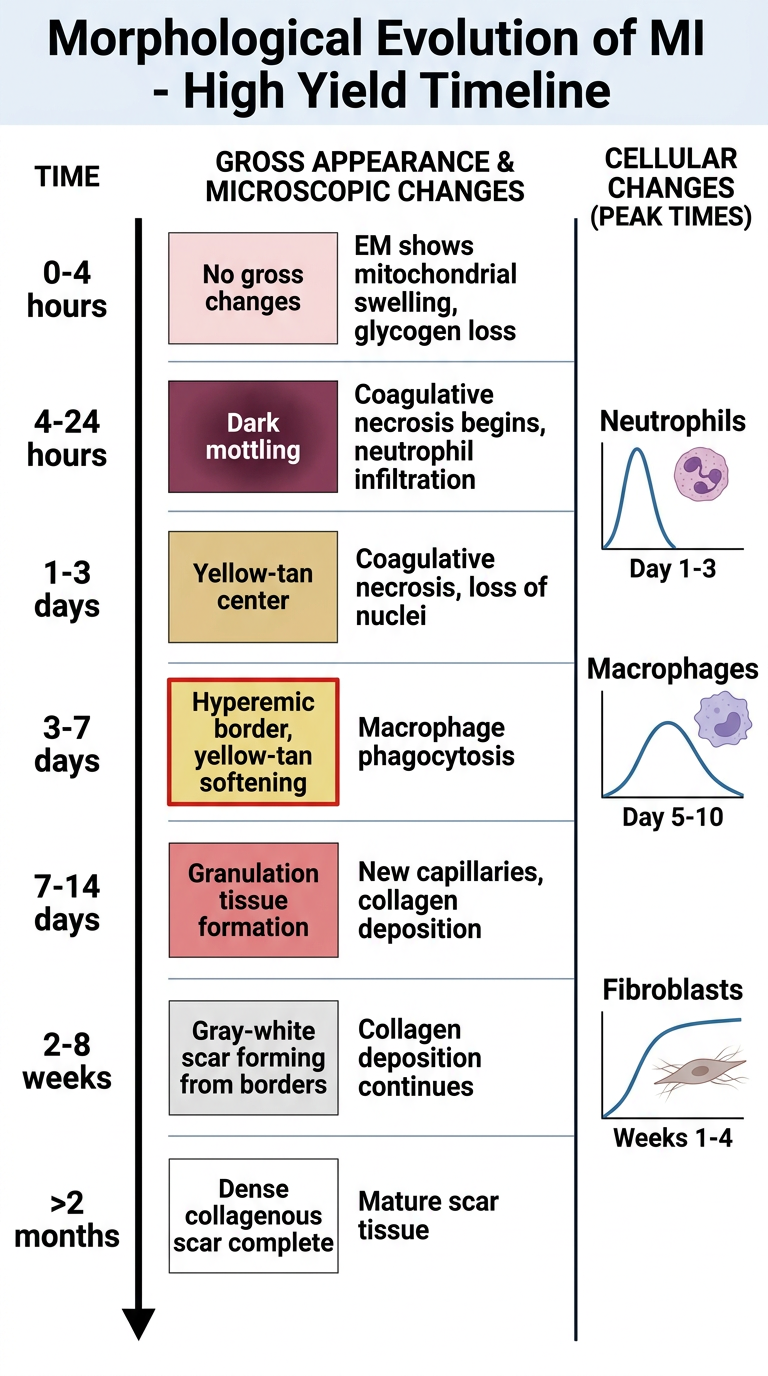
6. Morphological Changes (Gross & Microscopic) - HIGH-YIELD TABLE
| Time Frame | Gross Features | Light Microscopy | EM Findings |
|---|---|---|---|
| 0-½ hour | None | None | Relaxation of myofibrils, glycogen loss, mitochondrial swelling |
| ½-4 hours | None | Usually none; variable waviness of fibers at border | Sarcolemmal disruption; mitochondrial amorphous densities |
| 4-12 hours | Occasionally dark mottling | Onset of coagulative necrosis; edema; hemorrhage | - |
| 12-24 hours | Dark mottling | Coagulative necrosis; pyknotic nuclei; hypereosinophilic myocytes; marginal contraction band necrosis; early neutrophilic infiltrate | - |
| 1-3 days | Mottling with yellow-tan infarct center | Coagulative necrosis with loss of nuclei and striations; increased neutrophils | - |
| 3-7 days | Hyperemic border; central yellow-tan softening | Disintegration of dead myofibers; dying neutrophils; early macrophage phagocytosis at border | - |
| 7-10 days | Maximally yellow-tan and soft, with depressed red-tan margins | Well-developed macrophage phagocytosis; early granulation tissue at margins | - |
| 10-14 days | Red-gray depressed infarct borders | Granulation tissue with new blood vessels and collagen deposition | - |
| 2-8 weeks | Gray-white scar, progressing from border toward core | Increased collagen, decreased cellularity | - |
| >2 months | Scarring complete | Dense collagenous scar | - |
"Wavy fibers" at infarct edges = characteristic of very early MI (4-12 hrs), reflecting stretching of non-contractile dead fibers Contraction band necrosis = marker of reperfusion injury
-
<12 hours: grossly invisible; use triphenyl tetrazolium chloride (TTC) stain - infarct appears pale (enzyme leakage), normal tissue stains red
-
Infarcts heal from borders toward core (healing requires migration of inflammatory cells and new vessels from margins)
-
Robbins & Kumar Basic Pathology, Table 9.2, p.357-359
7. Reperfusion Injury
- Stunned myocardium - post-ischemic noncontractile state lasting days despite viable tissue; due to persistent biochemical abnormalities
- Reperfusion arrhythmias - due to electrical instability
- Contraction band necrosis - hypercontraction of sarcomeres in reperfused cells; a hallmark of reperfusion on histology
- Microvascular injury - vascular damage can paradoxically limit restored flow ("no-reflow" phenomenon)
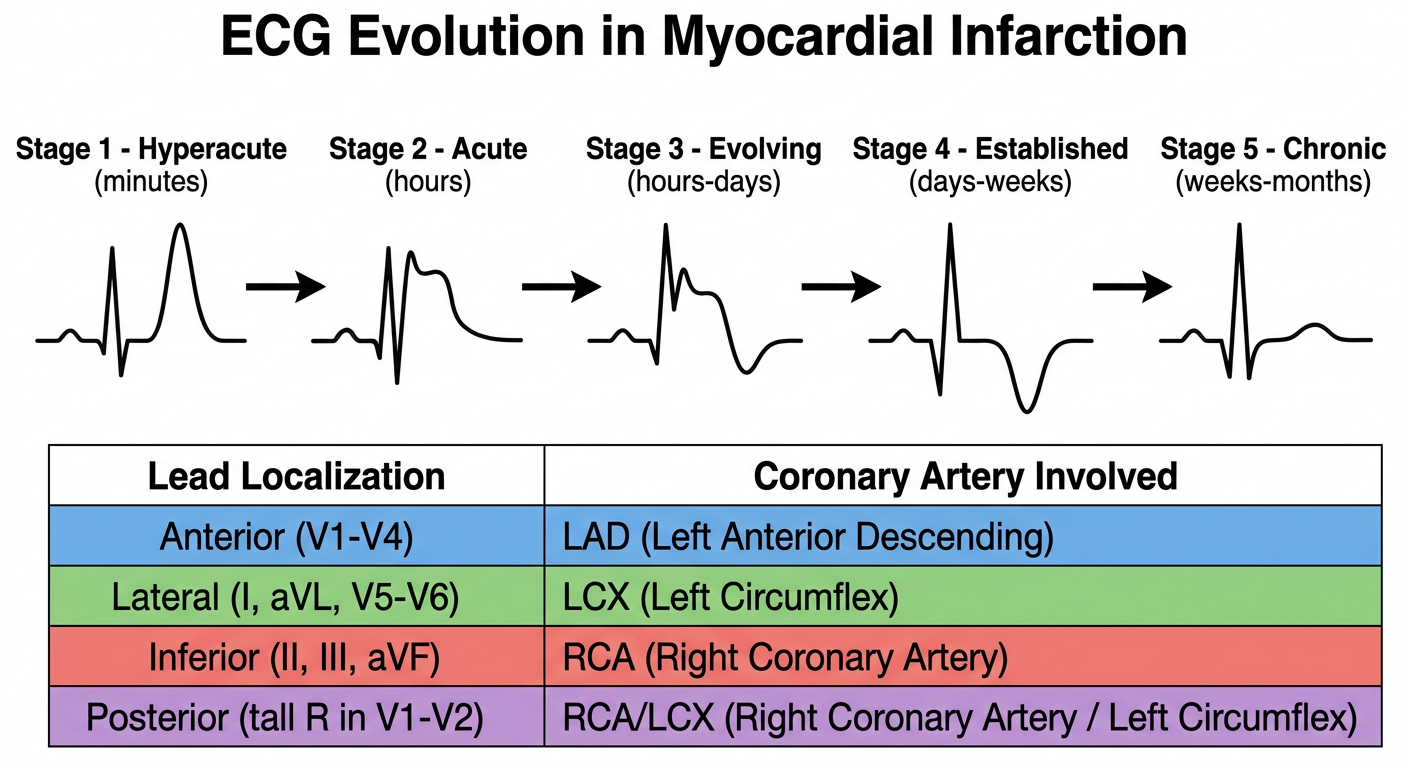
8. ECG Changes - Pathophysiology
| Defect | Current Flow | ECG Change in Overlying Lead |
|---|---|---|
| Rapid repolarization (accelerated K⁺ channel opening) | Out of infarct | ST elevation |
| Decreased resting membrane potential (K⁺ loss) | Into infarct (TQ depression) | Manifests as ST elevation |
| Delayed depolarization | Out of infarct | ST elevation |
- Hyperacute T waves - tall peaked T waves (minutes)
- ST elevation - hallmark of acute transmural injury (STEMI pattern)
- T-wave inversion - as injury evolves
- Pathological Q waves - develop over days-weeks; indicate completed transmural necrosis (dead tissue is electrically silent; remaining healthy muscle contributes a vector pointing away from the infarct zone)
"Non-Q-wave MIs do exist" - absence of Q waves does not exclude MI; NSTEMI classically shows no Q waves
- Ganong's Review of Medical Physiology, Table 29-3
ECG Localization
| Territory | Leads with Changes | Artery |
|---|---|---|
| Anterior/septal | V1-V4 | LAD |
| High lateral | I, aVL | LAD diagonal / LCX |
| Inferior | II, III, aVF | RCA (or LCX in left-dominant) |
| Posterior | Tall R in V1-V2, ST depression V1-V3 | RCA/LCX |
| Right ventricular | V4R | RCA |
9. Clinical Features
- Chest pain/pressure - typically crushing, squeezing, or pressure-like; retrosternal; radiates to jaw, left arm, back, epigastrium; >20 minutes duration (unlike stable angina)
- Dyspnea - from pulmonary edema/reduced cardiac output
- Nausea/vomiting - especially with inferior MI (vagal activation)
- Diaphoresis (cold clammy sweat)
- Palpitations - from arrhythmias
- "Silent MI" (painless) - common in diabetics, elderly, women
- Tachycardia/bradycardia (inferior MI → bradycardia via vagal activation or AV block)
- Hypotension (cardiogenic shock if severe)
- S3/S4 gallop
- New murmur (papillary muscle dysfunction, VSD)
- Pulmonary crackles (LV failure)
- Distended neck veins + hypotension (RV infarct triad, Kussmaul sign)
10. Cardiac Biomarkers
| Biomarker | Rise | Peak | Return to Normal | Notes |
|---|---|---|---|---|
| Troponin I/T | 2-4 hours | 48 hours | 7-10 days | Highest sensitivity and specificity; gold standard |
| CK-MB | 2-4 hours | 24-48 hours | ~72 hours | Useful for detecting reinfarction (returns to normal faster) |
| Myoglobin | 1-2 hours | 6-12 hours | 24 hours | Earliest to rise but non-specific |
-
With reperfusion, both troponin and CK-MB peak earlier (rapid washout from necrotic tissue)
-
TnI and TnT are not normally found in circulation - any elevation is significant
-
High-sensitivity troponin (hsTnT/hsTnI) allows serial testing at 0h and 1-3h
-
Robbins & Kumar Basic Pathology, p.360; Fig. 9.13
11. Diagnosis - Criteria
- Symptoms of ischemia
- New ECG changes
- Development of pathological Q waves
- Imaging evidence of new wall motion abnormality or loss of viable myocardium
- Intracoronary thrombus on angiography/autopsy
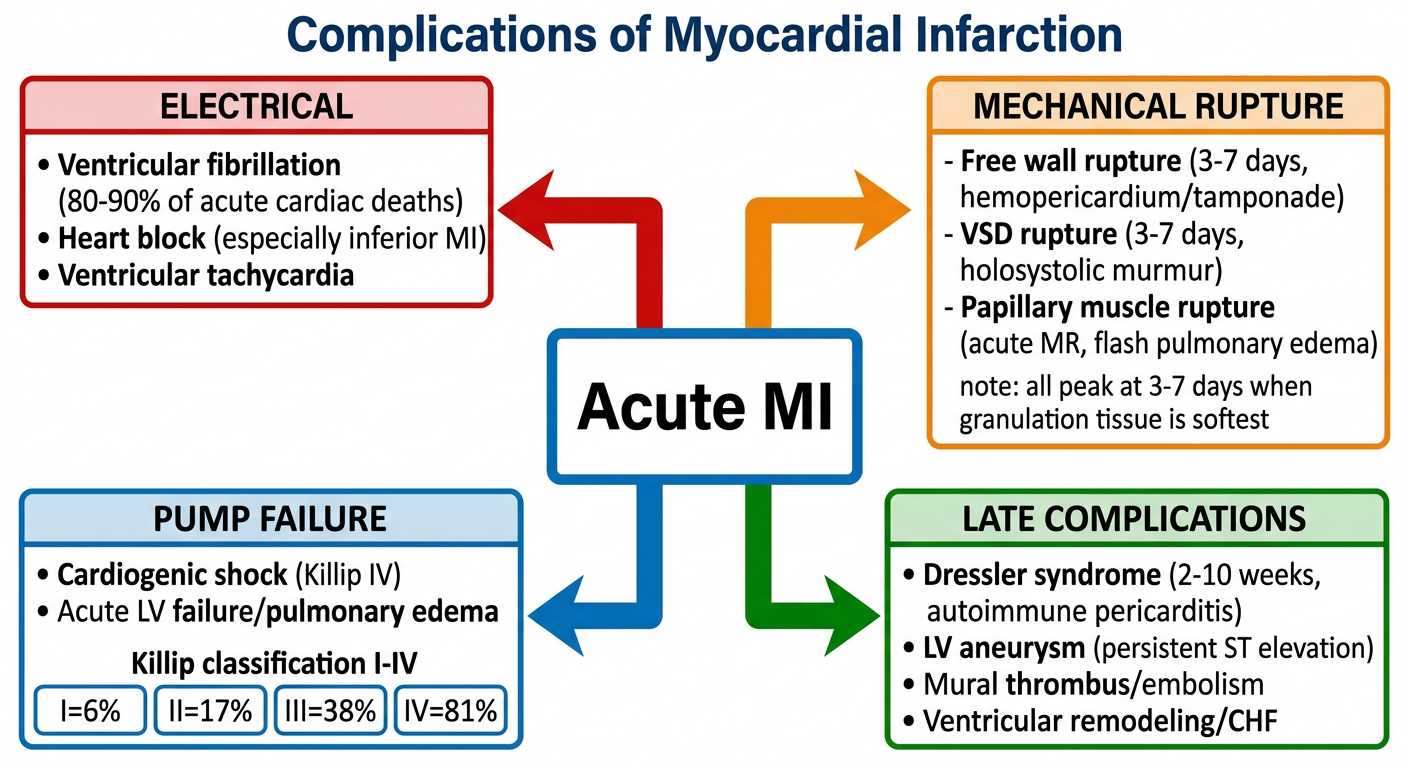
12. Complications
| Complication | Timing | Features |
|---|---|---|
| Ventricular free wall rupture | 3-7 days | Least common but most fatal; hemopericardium → tamponade |
| Ventricular septal rupture (VSD) | 3-7 days | Most common rupture; new holosystolic murmur + step-up in O₂ sat RV |
| Papillary muscle rupture | 3-7 days | Acute severe mitral regurgitation; flash pulmonary edema |
Rupture occurs at 3-7 days because this is when necrotic myocardium is maximally lysed and replaced by soft, friable granulation tissue.
- Arrhythmias - most common cause of death (VF in 80-90% of cardiac deaths from ischemia); greatest risk in first 24h
- Cardiogenic shock - severe pump failure; mortality ~50-80%
- Acute LV failure/pulmonary edema - due to systolic stretch of necrotic segments; non-contractile areas undergo outward bulging (dyskinesis)
- Pericarditis (Dressler syndrome) - autoimmune; occurs 2-10 weeks post-MI; fever, pleuritic chest pain, pericardial rub
- Mural thrombus - especially with large anterior MI; risk of systemic embolism; use anticoagulation
- LV aneurysm - late complication; persistent ST elevation; risk of arrhythmia, thrombus, failure
- Ventricular remodeling - dilatation and hypertrophy of non-infarcted myocardium; risk of heart failure
- Reinfarction - risk highest in first year
| Class | Features | Mortality |
|---|---|---|
| I | No signs of HF | ~6% |
| II | S3, basilar rales <50% of lungs | ~17% |
| III | Pulmonary edema (rales >50%) | ~38% |
| IV | Cardiogenic shock | ~67-81% |
- Robbins & Kumar Basic Pathology, p.360; Guyton & Hall
13. Management
Immediate (MONA/Time-sensitive)
- Oxygen if SpO₂ <90%
- Aspirin 300 mg (loading dose) immediately - antiplatelet
- Nitroglycerin - for chest pain relief (contraindicated if RV infarct or PDE5 inhibitor use)
- Morphine - pain relief (use cautiously - delays P2Y12 absorption)
- Antiplatelet therapy - add P2Y12 inhibitor (ticagrelor or prasugrel preferred; clopidogrel alternative)
- Anticoagulation - UFH, LMWH, or fondaparinux
Reperfusion Strategy (for STEMI)
- Primary PCI - the preferred strategy; door-to-balloon time <90 minutes (from first medical contact)
- Thrombolysis - if PCI unavailable within 120 minutes; door-to-needle <30 minutes; streptokinase or tPA (alteplase)
- Contraindications: active bleeding, prior hemorrhagic stroke, recent surgery, uncontrolled hypertension
- CABG - for multivessel disease, failed PCI, mechanical complications
Post-MI / Secondary Prevention
| Drug | Indication |
|---|---|
| Dual antiplatelet (DAPT) | Aspirin + P2Y12 inhibitor for 12 months (post-stent) |
| Beta-blocker | Reduce mortality, arrhythmias, reinfarction |
| ACE inhibitor/ARB | Reduce remodeling, especially if LVEF <40% |
| Statin (high-intensity) | Plaque stabilization, reduce LDL |
| Aldosterone antagonist (eplerenone) | If LVEF ≤40% + HF symptoms or diabetes |
Important 2025-2026 update: Two recent meta-analyses (PMID 40897190, PMID 41211954) in The Lancet and NEJM (2025-2026) challenge routine beta-blocker use post-MI in patients with mildly reduced or normal ejection fraction, suggesting the benefit may be limited. This represents an evolving area - beta-blockers remain standard of care for reduced EF (EF <40%).
14. Out-of-Hospital vs In-Hospital Mortality
- In-hospital mortality: ~7-8% overall (STEMI ~10%, NSTEMI ~6%)
- Out-of-hospital (STEMI): ~1 in 3 die, usually from VF within 1 hour of symptom onset before reaching hospital
- Major cause of death: ventricular fibrillation (accounts for 80-90% of cardiac deaths in the acute phase)
15. Special Considerations
- Stunned - viable but transiently dysfunctional myocardium following brief ischemia or post-reperfusion; recovers spontaneously
- Hibernating - chronically underperfused but viable myocardium; persistently dysfunctional but recovers with revascularization
- Subendocardial = usually NSTEMI; partial occlusion or severe fixed stenosis with transient demand mismatch; no Q waves
- Transmural = usually STEMI; complete occlusion; Q waves develop
- Women more often present with dyspnea, jaw pain, nausea, fatigue without classic chest pain
- Higher risk of misdiagnosis; higher in-hospital mortality partly due to older age at presentation
Quick Summary Table for Exams
| Feature | STEMI | NSTEMI |
|---|---|---|
| Occlusion | Complete (transmural) | Partial/subendocardial |
| ECG | ST elevation, Q waves | ST depression, T-wave inversion, or normal |
| Troponin | Elevated | Elevated |
| Treatment | Urgent reperfusion (PCI/lytics) | Risk-stratify; early invasive or conservative |
| In-hospital mortality | ~10% | ~6% |
- Robbins & Kumar Basic Pathology, pp. 353-361
- Ganong's Review of Medical Physiology, 26th Ed., Table 29-3
- Guyton & Hall Medical Physiology, pp. 271-273
- Sabiston Textbook of Surgery - MI Classification (4th Universal Definition)
- Recent updates: Beta-blockers post-MI meta-analysis, Lancet 2025 (PMID 40897190); NEJM 2026 (PMID 41211954)
Give me schematic presentation of some points like pathophy.
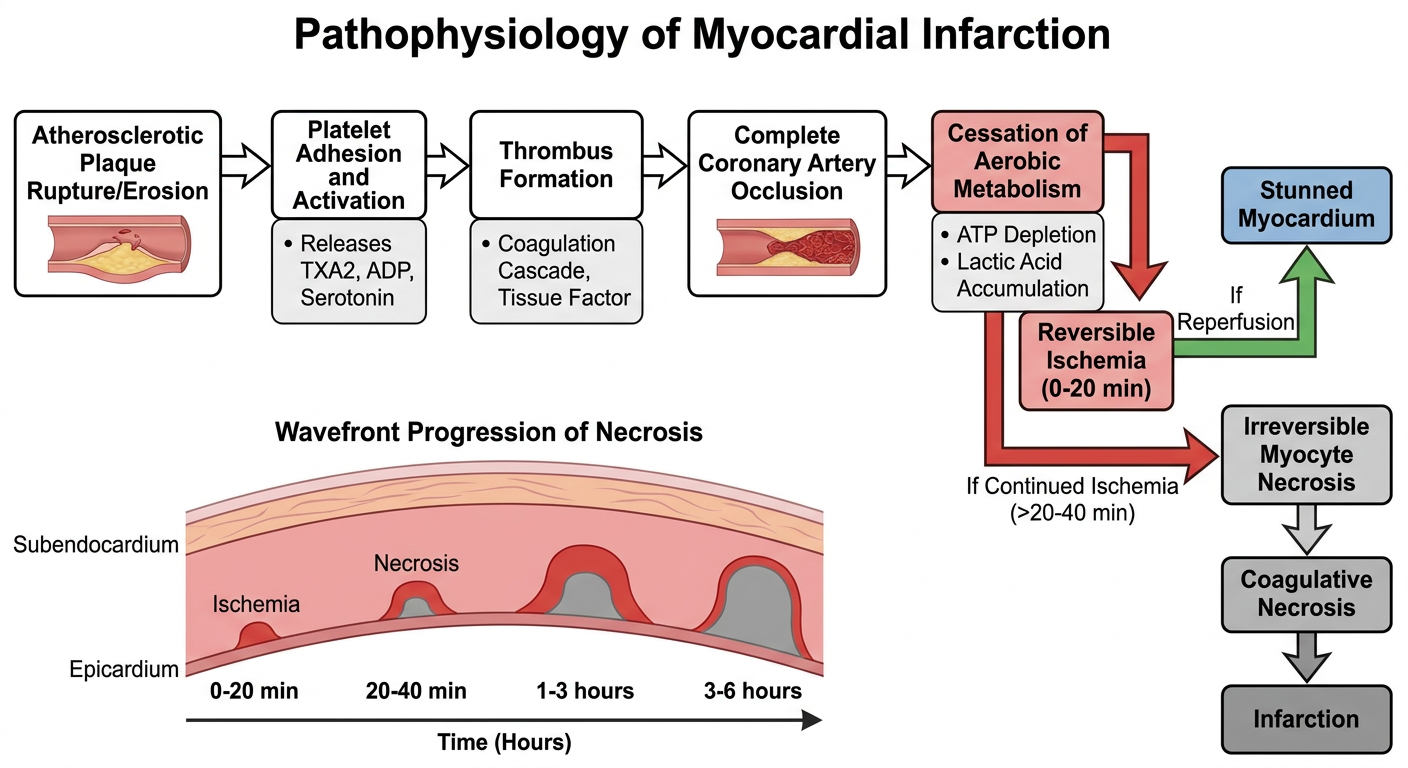
Medical schematic diagram of myocardial infarction pathophysiology. Clean white background, professional medical education style with clear flowchart arrows and boxes. Show the sequence: Atherosclerotic plaque rupture/erosion → Platelet adhesion and activation (releases TXA2, ADP, serotonin) → Thrombus formation (coagulation cascade, tissue factor) → Complete coronary artery occlusion → Cessation of aerobic metabolism (ATP depletion, lactic acid accumulation) → Reversible ischemia (0-20 min) branching to: if reperfusion = stunned myocardium; if continued ischemia (>20-40 min) → Irreversible myocyte necrosis → Coagulative necrosis → Infarction. Include a wavefront progression showing subendocardial necrosis first, then transmural spread over 3-6 hours. Use color coding: red for ischemia, gray for necrosis, blue for reversible injury, green for reperfusion pathway. Title: "Pathophysiology of Myocardial Infarction". Clear bold labels, readable fonts, medical textbook quality.
Medical schematic diagram showing ECG changes in myocardial infarction over time. Clean white background, educational cardiology style. Show a timeline with 5 stages with corresponding ECG waveform sketches: Stage 1 - Hyperacute (minutes): tall peaked T waves; Stage 2 - Acute (hours): ST elevation (tombstone pattern), beginning T-wave changes; Stage 3 - Evolving (hours-days): ST elevation with T-wave inversion beginning; Stage 4 - Established (days-weeks): pathological Q waves with T-wave inversion, ST returning to baseline; Stage 5 - Chronic (weeks-months): persistent Q waves, normalized ST-T. Below that, show a lead localization table: Anterior (V1-V4) = LAD; Lateral (I, aVL, V5-V6) = LCX; Inferior (II, III, aVF) = RCA; Posterior (tall R in V1-V2) = RCA/LCX. Color-coded clearly, arrows showing progression of changes, bold text labels. Title: "ECG Evolution in Myocardial Infarction". Professional medical textbook quality.
Medical schematic showing morphological timeline of myocardial infarction healing. Clean professional medical diagram on white background. Vertical timeline from 0 to greater than 2 months with horizontal sections showing: 0-4 hours: no gross changes, EM shows mitochondrial swelling, glycogen loss; 4-24 hours: dark mottling, coagulative necrosis begins, neutrophil infiltration; 1-3 days: yellow-tan center, coagulative necrosis, loss of nuclei; 3-7 days: hyperemic border, yellow-tan softening, macrophage phagocytosis; 7-14 days: granulation tissue formation, new capillaries, collagen deposition; 2-8 weeks: gray-white scar forming from borders; greater than 2 months: dense collagenous scar complete. Include small color-coded boxes for each stage showing gross appearance color changes. On the right side, show the cellular changes: neutrophils peak day 1-3, macrophages peak day 5-10, fibroblasts weeks 1-4. Bold readable labels. Title: "Morphological Evolution of MI - High Yield Timeline". Medical education quality, exam-focused.
Medical schematic diagram of myocardial infarction complications. Clean white background, professional medical education flowchart style. Central box: "Acute MI" with branches going outward to: 1) ELECTRICAL (top left, red): Ventricular fibrillation (80-90% of acute cardiac deaths), Heart block (especially inferior MI), Ventricular tachycardia; 2) MECHANICAL RUPTURE (top right, orange): - Free wall rupture (3-7 days, hemopericardium/tamponade) - VSD rupture (3-7 days, holosystolic murmur) - Papillary muscle rupture (acute MR, flash pulmonary edema) - note: all peak at 3-7 days when granulation tissue is softest; 3) PUMP FAILURE (bottom left, blue): Cardiogenic shock (Killip IV), Acute LV failure/pulmonary edema, Killip classification I-IV boxes with mortality %: I=6%, II=17%, III=38%, IV=81%; 4) LATE COMPLICATIONS (bottom right, green): Dressler syndrome (2-10 weeks, autoimmune pericarditis), LV aneurysm (persistent ST elevation), Mural thrombus/embolism, Ventricular remodeling/CHF. Use bold colored arrows, clear labels, exam-focused layout. Title: "Complications of Myocardial Infarction". Medical textbook quality.
Medical schematic showing cardiac biomarker kinetics after myocardial infarction. Clean white background, graph with X-axis labeled "Hours after onset of chest pain" from 0 to 240 hours (10 days), Y-axis labeled "Serum Concentration (multiples of upper normal limit)". Three clearly labeled curves: 1) Myoglobin - dashed green line: rises at 1-2h, peaks at 6-12h, returns to normal by 24h - earliest but non-specific; 2) CK-MB - solid blue line: rises at 2-4h, peaks at 24-48h, returns to normal at 72h - useful for reinfarction detection; 3) Cardiac Troponin I/T - solid red line (tallest): rises at 2-4h, peaks at 48h, remains elevated for 7-10 days - gold standard, highest specificity and sensitivity. Add vertical dashed lines marking: 4h, 24h, 48h, 72h, 7 days. Add text boxes noting: "With reperfusion: earlier peak (washout effect)". Below the graph, add a small table with columns: Biomarker, Rise, Peak, Duration, Clinical Use. Bold labels, color-coded, professional quality. Title: "Cardiac Biomarker Kinetics in MI - High Yield". Medical education style.
Error calling model 'gemini-3-pro-image' (RESOURCE_EXHAUSTED): 429 RESOURCE_EXHAUSTED. {'error': {'code': 429, 'message': 'Resource has been exhausted (e.g. check quota).', 'status': 'RESOURCE_EXHAUSTED'}}
We encountered an error while processing your request. Please try again or reach out to us for help.
Give me schematic presentation of some points like pathophy.
Medical schematic diagram of myocardial infarction complications. Clean white background, professional medical education flowchart style. Central box: "Acute MI" with branches going outward to: 1) ELECTRICAL (top left, red): Ventricular fibrillation (80-90% of acute cardiac deaths), Heart block (especially inferior MI), Ventricular tachycardia; 2) MECHANICAL RUPTURE (top right, orange): - Free wall rupture (3-7 days, hemopericardium/tamponade) - VSD rupture (3-7 days, holosystolic murmur) - Papillary muscle rupture (acute MR, flash pulmonary edema) - note: all peak at 3-7 days when granulation tissue is softest; 3) PUMP FAILURE (bottom left, blue): Cardiogenic shock (Killip IV), Acute LV failure/pulmonary edema, Killip classification I-IV boxes with mortality %: I=6%, II=17%, III=38%, IV=81%; 4) LATE COMPLICATIONS (bottom right, green): Dressler syndrome (2-10 weeks, autoimmune pericarditis), LV aneurysm (persistent ST elevation), Mural thrombus/embolism, Ventricular remodeling/CHF. Use bold colored arrows, clear labels, exam-focused layout. Title: "Complications of Myocardial Infarction". Medical textbook quality.
Medical schematic showing cardiac biomarker kinetics after myocardial infarction. Clean white background, graph with X-axis labeled "Hours after onset of chest pain" from 0 to 240 hours (10 days), Y-axis labeled "Serum Concentration (multiples of upper normal limit)". Three clearly labeled curves: 1) Myoglobin - dashed green line: rises at 1-2h, peaks at 6-12h, returns to normal by 24h - earliest but non-specific; 2) CK-MB - solid blue line: rises at 2-4h, peaks at 24-48h, returns to normal at 72h - useful for reinfarction detection; 3) Cardiac Troponin I/T - solid red line (tallest): rises at 2-4h, peaks at 48h, remains elevated for 7-10 days - gold standard, highest specificity and sensitivity. Add vertical dashed lines marking: 4h, 24h, 48h, 72h, 7 days. Add text boxes noting: "With reperfusion: earlier peak (washout effect)". Below the graph, add a small table with columns: Biomarker, Rise, Peak, Duration, Clinical Use. Bold labels, color-coded, professional quality. Title: "Cardiac Biomarker Kinetics in MI - High Yield". Medical education style.
1. Pathophysiology of MI
2. ECG Evolution in MI
3. Morphological Timeline (High Yield for Path Exams)
4. Complications of MI
5. Cardiac Biomarker Kinetics