
Md anaesthesia exam , Respiratory Physiology Compliance (static & dynamic) Airway resistance Work of breathing Time constant Pressure-volume relationship Flow-volume loop Dead space Alveolar ventilation
flow volume loop normal COPD obstructive restrictive pattern spirometry
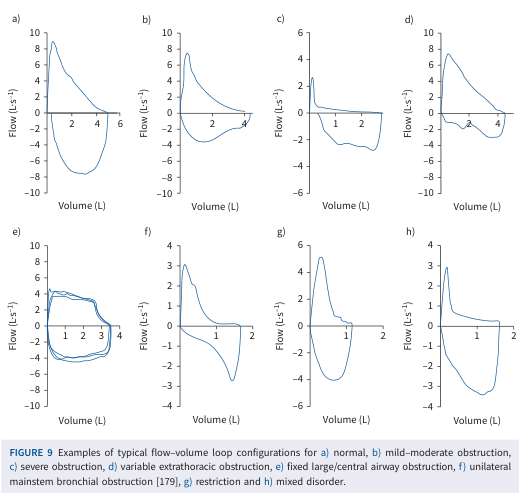
Summary : This figure presents eight typical flow–volume loop configurations, each illustrating a different pattern of pulmonary function abnormality, including normal, obstructive, restrictive, and mixed disorders. flow–volume loop plots: # Title & Axes : • Figure title: "Examples of typical flow–volume loop configurations for a) normal, b) mild–moderate obstruction, c) severe obstruction, d) variable extrathoracic obstruction, e) fixed large/central airway obstruction, f) unilateral mainstem bronchial obstruction, g) restriction and h) mixed disorder." • X-axis: "Volume (L)" with tick labels ranging from 0 to 6 (varies by panel). • Y-axis: "Flow (L·s⁻¹)" with tick labels ranging from -10 to 10 (varies by panel). # Panels & Data Points : • Panel a) Normal: Loop with peak expiratory flow near 10 L·s⁻¹, volume up to ~6 L, smooth descending limb. • Panel b) Mild–moderate obstruction: Lower peak flow (~8 L·s⁻¹), volume up to ~4 L, scooped-out descending limb. • Panel c) Severe obstruction: Peak flow ~6 L·s⁻¹, volume up to ~2.5 L, pronounced scooping and reduced flow. • Panel d) Variable extrathoracic obstruction: Peak flow ~6 L·s⁻¹, volume up to ~4 L, plateau in inspiratory limb. • Panel e) Fixed large/central airway obstruction: Loops with both inspiratory and expiratory plateaus, volume up to ~4 L, flow range -8 to 8 L·s⁻¹. • Panel f) Unilateral mainstem bronchial obstruction: Peak flow ~3 L·s⁻¹, volume up to ~2 L, irregular loop shape. • Panel g) Restriction: Peak flow ~6 L·s⁻¹, volume up to ~2 L, steep and narrow loop. • Panel h) Mixed disorder: Peak flow ~4 L·s⁻¹, volume up to ~2 L, combination of scooping and restriction features. # Design Encodings : • Each panel shows a single blue line representing the flow–volume loop. • Axes are consistent in style, with horizontal and vertical grid lines. • No additional colour or marker encodings. # Distribution & Trends : • Normal loop (a) is tall and broad, with a rapid rise and gradual fall. • Obstructive loops (b, c) show reduced peak flow and scooped-out descending limbs. • Restrictive loop (g) is narrow and steep, with reduced volume. • Fixed obstruction (e) shows plateaus in both inspiratory and expiratory limbs. • Mixed disorder (h) combines features of obstruction and restriction. # Analysis : • The figure visually distinguishes between normal, obstructive, restrictive, and mixed pulmonary function patterns. • Obstructive patterns are characterised by reduced peak flow and scooping; restrictive patterns by reduced volume and steep loops. • Fixed and variable obstructions show plateaus, while mixed disorders combine features. • These loop shapes are diagnostic for different types of airway and lung pathology.
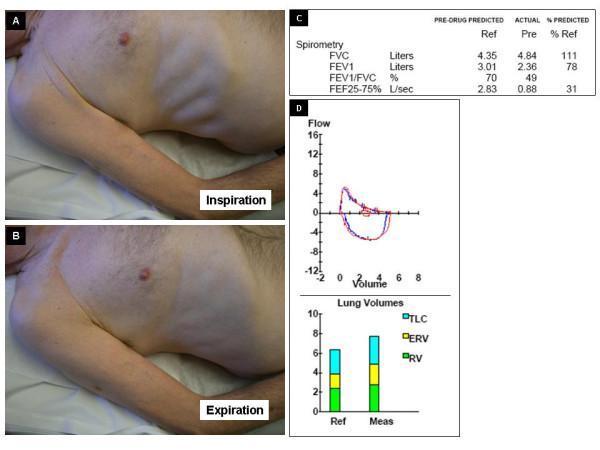
A multi-panel clinical graphic illustrating the physical and diagnostic findings of Hoover's sign in a patient with airway obstruction. Panels A and B contain clinical photographs of a male patient's torso in a lateral recumbent position. Panel A (Inspiration) demonstrates a paradoxical inward retraction of the lower rib cage and intercostal spaces, a classic physical sign of diaphragmatic flattening often seen in severe COPD or emphysema. Panel B (Expiration) shows the relative expansion or outward movement of the same region. Panel C provides a spirometry data table showing an obstructive pattern: a reduced FEV1/FVC ratio (49%) and low FEF25-75% (31% of predicted). Panel D includes a flow-volume loop demonstrating characteristic expiratory flow limitation and a bar chart of lung volumes. The lung volume chart highlights significant hyperinflation and gas trapping, characterized by an elevated Residual Volume (RV) and Total Lung Capacity (TLC) compared to reference values. This composite image serves to correlate physical examination findings of abnormal chest wall dynamics with quantitative pulmonary function testing in obstructive lung disease.
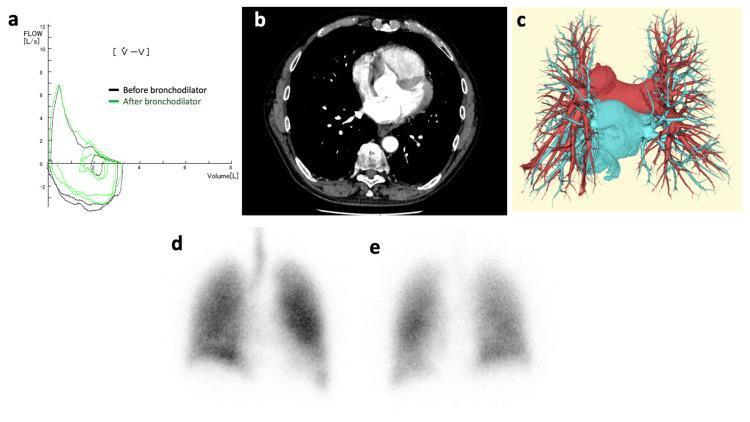
A multi-panel figure illustrating diagnostic findings in a patient with pulmonary and cardiovascular pathology. (a) A flow-volume loop (spirometry) showing a characteristic downward convex (scooped) expiratory limb indicative of obstructive lung disease, comparing pre-bronchodilator (black) and post-bronchodilator (green) states. (b) Axial contrast-enhanced chest CT at the level of the pulmonary arteries showing no acute thromboembolism. (c) Three-dimensional CT reconstruction of the pulmonary vasculature, with pulmonary arteries color-coded in red and pulmonary veins in blue; no pulmonary arteriovenous malformations or fistulas are identified. (d, e) Nuclear medicine ventilation-perfusion (V/Q) scintigraphy scans; the images demonstrate a V/Q mismatch without focal defects, suggesting a right-to-left shunt. Collectively, these images are used to evaluate platypnea-orthodeoxia syndrome (POS), focusing on identifying potential anatomical causes such as shunts or obstructive impairment.
lung compliance pressure volume curve static dynamic hysteresis surfactant
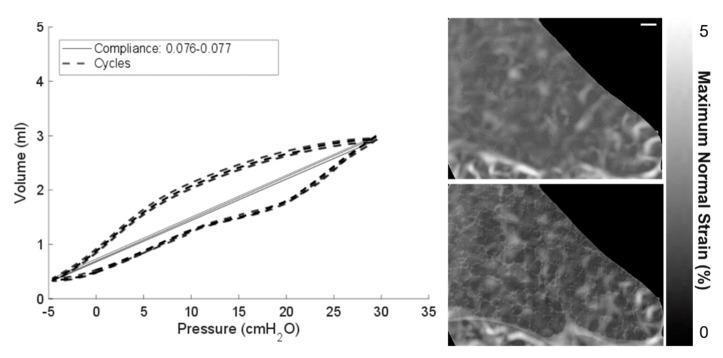
This composite educational graphic details lung mechanical ventilation reliability and tissue strain analysis using digital volume correlation (DVC). The left panel displays a Pressure-Volume (P-V) curve plot, showing the relationship between Pressure (cmH2O, x-axis from -5 to 35) and Volume (ml, y-axis from 0 to 5). Four ventilation cycles are overlaid as dashed lines, demonstrating sigmoidal hysteretic loops characteristic of respiratory compliance. A solid grey line indicates a consistent compliance range of 0.076–0.077. The right panel consists of two vertically stacked DVC strain field images of lung tissue within an intact thorax, labeled with a 200 µm scale bar. The top image shows the unfiltered strain field, while the bottom image shows the same field after Paganin filtering. The filtered version displays improved contrast between tissue and air by reducing noise within tissue boundaries. Both images include a grayscale color bar indicating 'Maximum Normal Strain (%)' ranging from 0 to 5. This figure illustrates the application of biomedical engineering principles to visualize local lung tissue deformation and characterize pulmonary mechanics during mechanical loading.
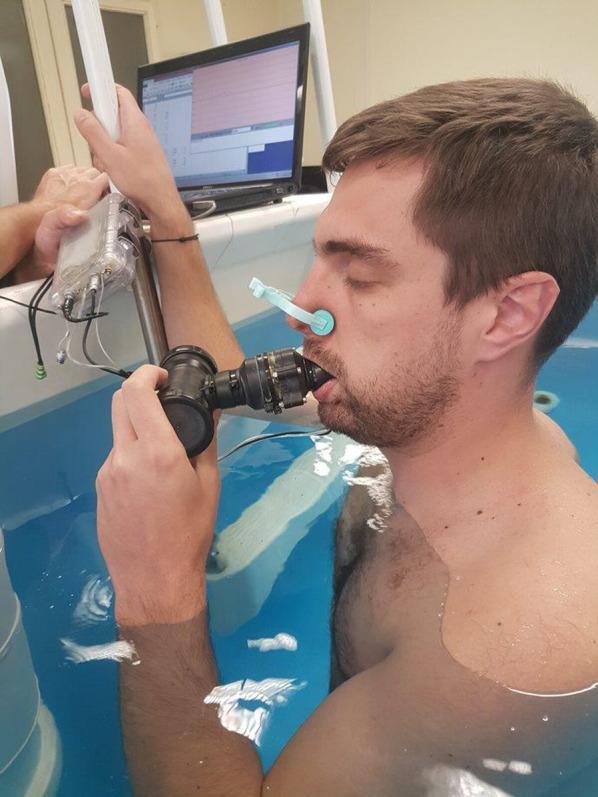
This clinical photograph illustrates a research setup for measuring static respiratory compliance during head-out-of-water immersion. A male subject is shown immersed in water up to the level of the sternal notch, a condition that physiologically alters respiratory mechanics due to hydrostatic pressure on the chest wall. The subject is wearing a nose clip to ensure a closed respiratory system, breathing exclusively through a mouthpiece. The mouthpiece is integrated with a pressure sensor and connected via tubing to a calibrated syringe (partially visible) used to manipulate lung volumes. In the background, a computer monitor displays real-time physiological data and waveforms, likely recording the relationship between pressure and volume changes. This experimental design is used in sports medicine and pulmonary physiology to study the effects of immersion on the respiratory system, specifically evaluating parameters like tidal volume, expiratory reserve volume, and overall respiratory system compliance (Crs).
work of breathing Campbell diagram pressure volume respiratory
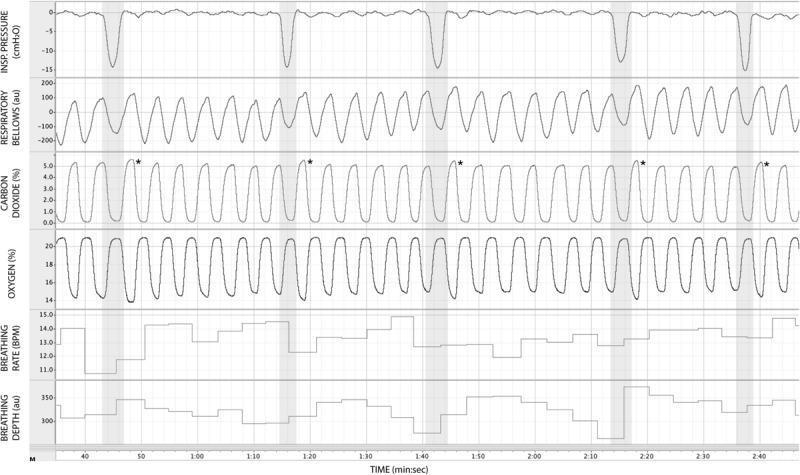
This physiological trace diagram displays multiple respiratory and gas exchange parameters recorded over approximately two minutes and forty seconds during an experimental study on inspiratory resistance. The figure is organized into six vertically stacked panels: inspiratory pressure (cmH2O), respiratory bellows (arbitrary units), carbon dioxide (%), oxygen (%), breathing rate (BPM), and breathing depth (au). Five vertical gray bars indicate periods where an external inspiratory resistance of 55 cmH2O was applied. During these resistance periods, the 'Inspiratory Pressure' trace shows significant negative deflections, reaching approximately -15 cmH2O, reflecting increased inspiratory effort. The 'Carbon Dioxide' trace reveals rhythmic oscillations corresponding to the respiratory cycle; asterisks (*) are placed above the peaks immediately following each gray period to highlight an increase in end-tidal carbon dioxide (PETCO2). The 'Oxygen' trace shows inverse oscillations to CO2. The bottom panels utilize step-graphs to track dynamic changes in breathing frequency and volume (depth). This visualization demonstrates the acute physiological and compensatory responses of the respiratory system to sudden, external mechanical loads.
![This physiological data plot illustrates respiratory mechanics across four stacked time-series graphs (0-60 seconds) during normal breathing. The top plot displays 'Pressure at venturi throat [cmH2O]', showing cyclic negative pressure spikes corresponding to inspiratory effort. The second plot shows 'Flow [L/s]', with positive deflections representing inspiration and negative deflections representing expiration. The third plot displays 'Tidal Volume [L]', depicting the cumulative volume inhaled and exhaled per breath, peaking at approximately 0.8L. The bottom plot compares 'Circumference of Chest and Abdomen [mm]', featuring a blue line for chest expansion (ranging 830-840mm) and a red line for abdominal expansion (ranging 740-750mm). Dashed vertical lines mark the start of each inspiration index (InspInd), synchronizing the mechanical pressure drops and flow changes with physical chest/abdomen movement. This visualization is used in critical care and respiratory physiology to evaluate breathing patterns, work of breathing, and thoracoabdominal synchrony.](https://cdn.orris.care/cdss_images/pmc_clinical_VQA_73c5a7ffc8dcfd89d0bc7e4fb8d7918848b8ac5a1216664d3c77b8e425e73a4e.jpg)
This physiological data plot illustrates respiratory mechanics across four stacked time-series graphs (0-60 seconds) during normal breathing. The top plot displays 'Pressure at venturi throat [cmH2O]', showing cyclic negative pressure spikes corresponding to inspiratory effort. The second plot shows 'Flow [L/s]', with positive deflections representing inspiration and negative deflections representing expiration. The third plot displays 'Tidal Volume [L]', depicting the cumulative volume inhaled and exhaled per breath, peaking at approximately 0.8L. The bottom plot compares 'Circumference of Chest and Abdomen [mm]', featuring a blue line for chest expansion (ranging 830-840mm) and a red line for abdominal expansion (ranging 740-750mm). Dashed vertical lines mark the start of each inspiration index (InspInd), synchronizing the mechanical pressure drops and flow changes with physical chest/abdomen movement. This visualization is used in critical care and respiratory physiology to evaluate breathing patterns, work of breathing, and thoracoabdominal synchrony.
Respiratory Physiology for MD Anaesthesia - Complete Notes
1. COMPLIANCE (Static & Dynamic)
Definition
- Unit: L/cmH₂O
- Reciprocal of compliance = Elastance
- Normal lung compliance: 0.2 L/cmH₂O
- Chest wall compliance: ~0.2 L/cmH₂O (similar to lung alone)
- Combined lung + chest wall compliance: ~0.1 L/cmH₂O (less than either alone - "balloon within a balloon")
Transpulmonary Pressure
Static Compliance
- Measured under no-flow (static) conditions - airway occluded, no movement
- Reflects pure elastic properties of lung + chest wall
- Measured on the linear portion of the P-V curve
- Cdyn static = Tidal Volume / (Plateau pressure - PEEP)
- Best done at slow inflation rates to avoid resistive pressure components
Dynamic Compliance
- Measured during active breathing/ventilation (includes resistive component)
- C(dyn) = Tidal Volume / (Peak inspiratory pressure - PEEP)
- Always lower than static compliance because peak pressure includes resistive pressure loss across airways
- Falls as respiratory frequency increases - particularly when lung units have unequal time constants (e.g., obstructive disease)
Time constant (τ) and dynamic compliance
Factors Affecting Compliance
| Factor | Effect on Compliance |
|---|---|
| ARDS, pulmonary fibrosis, edema | Decreased (PV curve flatter, shifted right) |
| Emphysema | Increased (tissue loss, steeper PV curve, shifted left) |
| Surfactant deficiency (IRDS) | Decreased |
| Obesity, supine position, anesthesia | Decreased (chest wall) |
| Increasing lung volume (approaching TLC) | Decreased |
| Decreasing lung volume (approaching RV) | Decreased |
| Optimal: at normal FRC range | Maximum |
Hysteresis
2. AIRWAY RESISTANCE
Definition
- Normal: ~1 cmH₂O/L/s (or ~0.5-2 cmH₂O/L/s)
- Elevated in asthma (up to 10× normal in severe attacks)
- ETT (8mm ID) adds ~5 cmH₂O/L/min; (7mm ID) adds ~8 cmH₂O/L/min
Distribution of Resistance
- ~80% of resistance is in large airways (pharynx, larynx, trachea, bronchi up to 7th generation)
- Small airways despite narrow diameter contribute only ~20% because they are arranged in parallel, and total cross-sectional area increases enormously (up to 10× that of trachea at terminal bronchioles)
Laminar vs Turbulent Flow
- F = ΔP × π r⁴ / (8 η L)
- Resistance ∝ L / r⁴ (resistance increases to 4th power as radius decreases)
- Affected by viscosity
- Occurs in large airways and at branches
- Requires greater driving pressure for same flow
- Affected by gas density (not viscosity)
- Predicted by Reynolds number (Re) = ρdv/η
- Re > 4000 → turbulent; Re < 2000 → laminar
- This is why Heliox (helium-oxygen, density 1/7 of air) reduces work of breathing in upper airway obstruction - low density keeps Re in laminar range
Factors Modifying Airway Resistance
| Factor | Effect |
|---|---|
| Increasing lung volume | Decreases resistance (airways stretch open) |
| Decreasing lung volume → RV | Resistance rises exponentially |
| Anesthesia (FRC decreases) | Increases resistance |
| Bronchoconstriction (asthma, histamine) | Increases resistance |
| Forced expiration in COPD | Dynamic airway collapse → flow limitation |
| ETT in situ | Adds significant resistance |
Equal Pressure Point (EPP) - Anaesthesia Key Concept
- P(alveolar) = P(elastic recoil) + P(pleural)
- Moving toward the mouth, intraluminal pressure drops
- At the EPP, intraluminal pressure = surrounding pleural pressure
- Distal to EPP: intraluminal pressure < pleural pressure → dynamic compression
- Pursed-lip breathing in COPD: raises alveolar recoil pressure and moves EPP toward larger, cartilaginous (non-collapsible) airways
3. WORK OF BREATHING (WOB)
Concept
- Expressed in joules or cmH₂O·L
- Normal WOB: ~0.3-0.6 J/breath, ~2-3% of total O₂ consumption
- In respiratory failure: WOB may consume up to 50% of total O₂ delivery
Components of WOB
- Work done against elastic recoil of lungs and chest wall
- Stored during inspiration, released during passive expiration
- Increases when compliance is reduced (fibrosis, ARDS)
- Work done to overcome airway and tissue resistance
- Dissipated as heat
- Increases with obstructive disease, increased flow rates
- Negligible at normal breathing rates
- Important during high-frequency oscillatory ventilation (HFOV)
Clinical Relevance
- Anaesthetic breathing circuits, ETT, and heat-moisture exchangers (HMEs) all add resistive load
- Mechanical ventilation takes over WOB in respiratory failure
- Spontaneous breathing trials (SBT) assess if patient can tolerate this work
- In emphysema: compliance is increased (less elastic WOB) but resistance is markedly increased (more resistive WOB) - net result is increased WOB
4. TIME CONSTANT (τ)
Definition
What it Represents
- After 1τ: 63% of equilibrium volume achieved
- After 2τ: 86% complete
- After 3τ: 95% complete
- After 5τ: considered complete (>99%)
Clinical Importance - Anaesthesia Key Points
- R↑ → τ↑ → slower filling/emptying
- At normal respiratory rates, lungs cannot empty completely before next breath
- Results in gas trapping and auto-PEEP (intrinsic PEEP)
- Strategy: use long expiratory time (low I:E ratio, e.g., 1:3 or 1:4)
- C↓ → τ↓ → faster filling/emptying
- Units fill rapidly but to smaller volumes
- Rapid shallow breathing pattern is efficient
- In heterogeneous lung disease, some units have fast τ, others slow τ
- At higher breathing frequencies, slow units don't fill adequately
- Results in frequency-dependent compliance (C(dyn) falls with increasing RR)
- Pendelluft: gas movement between adjacent units with different τ
Mechanical Ventilation Implications
- Inspiratory time must be ≥ 3τ for adequate lung filling
- Expiratory time must be ≥ 3τ to prevent gas trapping
- In ARDS (τ↓): shorter time constants allow higher RR with smaller V(T) (lung-protective ventilation)
- In COPD (τ↑): longer expiratory times essential
5. PRESSURE-VOLUME (P-V) RELATIONSHIP
The P-V Curve
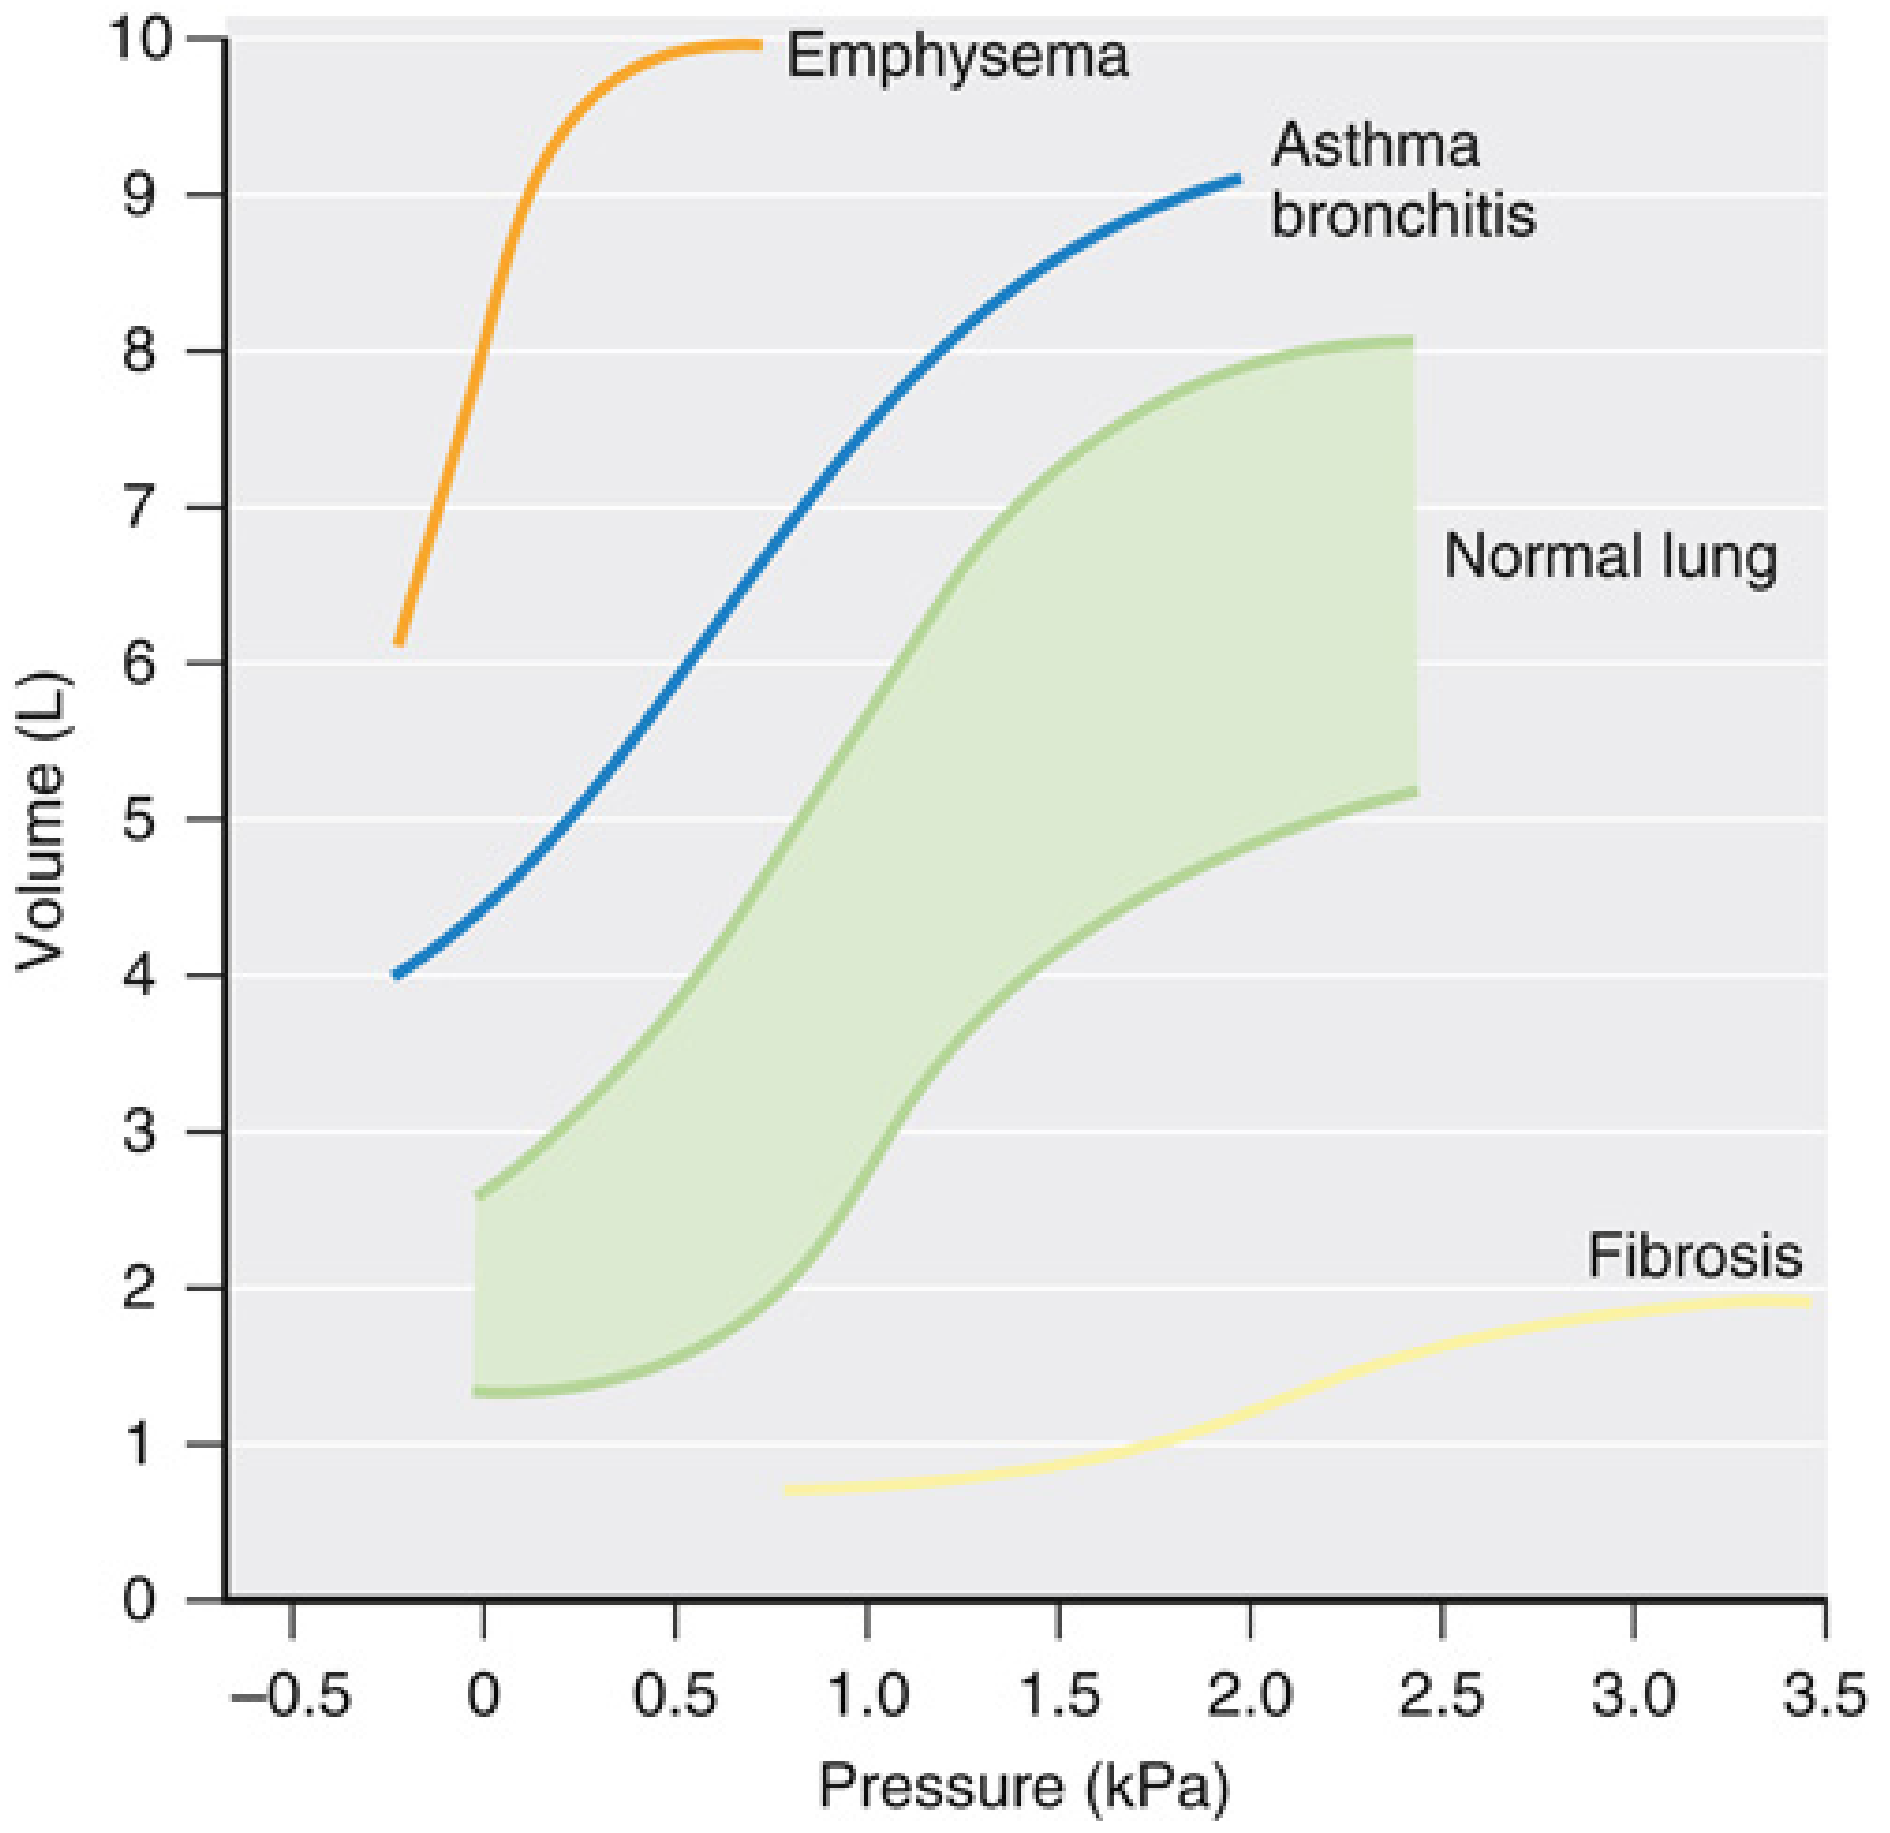
Key Features of the Normal P-V Curve
- Sigmoidal (S-shaped) - not linear
- Compliance (slope) is maximum at mid-range lung volumes (around FRC)
- Compliance is lowest at very high or very low lung volumes
- Hysteresis: deflation limb sits above inflation limb
Interpretation by Disease
| Condition | Curve Shape | Compliance | Clinical Implication |
|---|---|---|---|
| Normal | Sigmoid | 0.2 L/cmH₂O | Reference |
| Fibrosis/ARDS | Flat, rightward shift | Reduced | High driving pressures, barotrauma risk |
| Emphysema | Steep, leftward shift | Increased | Gas trapping, dynamic compression |
| Asthma/bronchitis | Parallel upward shift | Unchanged | Increased lung volume, normal slope |
| Surfactant deficiency | Reduced (↑ surface tension) | Reduced | Atelectasis |
P-V Curve in ARDS (for exam)
- Inflation limb shows:
- Lower inflection point (LIP): where alveolar recruitment begins (begin PEEP above this)
- Upper inflection point (UIP): overdistension begins (keep tidal P-V below this)
- PEEP set above LIP reduces atelectrauma; TV set to keep peak pressure below UIP reduces volutrauma
Combined Lung + Chest Wall
- Lungs "want" to collapse (elastic recoil inward)
- Chest wall "wants" to expand (elastic recoil outward)
- These forces balance exactly → FRC is the equilibrium (resting) volume
- Above FRC: both forces oppose expansion
- Below FRC: chest wall still wants to expand, opposes further deflation
6. FLOW-VOLUME LOOP
Construction
- X-axis: Volume (L) - from RV to TLC (or TLC to RV)
- Y-axis: Flow (L/s) - expiration above zero line, inspiration below
- Performed by maximal inspiration to TLC, then forced expiration to RV, then maximal inspiration back to TLC
Normal Loop Features
- Expiratory limb: rapid rise to peak expiratory flow (PEF), then linear decline to RV
- Inspiratory limb: smooth semicircular, effort-dependent throughout
- Peak expiratory flow ~8-10 L/s; peak inspiratory flow ~5-8 L/s
Key Concept: Effort Dependence vs Independence
- Early expiration (high volume): effort-dependent (more effort = more flow)
- Late expiration (low volume): effort-independent - maximum flow limited by dynamic airway compression; the expiratory curve becomes the MEFV envelope (maximal expiratory flow-volume)
- Inspiration: entirely effort-dependent throughout
Pattern Recognition (High-Yield for Exams)
| Pattern | Loop Feature | Conditions |
|---|---|---|
| Obstructive | Scooped/concave expiratory limb, reduced PEF, increased RV | COPD, asthma |
| Restrictive | Narrow loop (reduced TLC + RV), steep but short expiratory limb, normal or ↑ FEV1/FVC | Fibrosis, pleural disease |
| Fixed upper airway obstruction | Plateau on BOTH inspiratory AND expiratory limbs | Tracheal stenosis, goitre |
| Variable extrathoracic | Plateau on inspiratory limb only (e.g., vocal cord paralysis) | Vocal cord dysfunction, epiglottitis |
| Variable intrathoracic | Plateau on expiratory limb only | Tracheomalacia |
Anaesthesia Applications
- Pre-operative assessment of obstructive vs restrictive disease
- Diagnosis of upper airway obstruction (critical for anticipated difficult airway)
- Post-extubation stridor assessment
- Monitoring of bronchodilator response
7. DEAD SPACE
Definitions
- Volume of conducting airways (nose → terminal bronchioles) where no gas exchange occurs
- Normal: ~150 mL (or ~2 mL/kg body weight) in a healthy young adult
- Increases with body height, age (>50-60 years), and lung size
- Alveoli that are ventilated but not perfused (V/Q = ∞)
- Negligible in healthy individuals
- Increases in: pulmonary embolism, shock (reduced pulmonary perfusion), ARDS
- In healthy lungs, anatomical ≈ physiological dead space
- In disease, physiological dead space can be up to 10× anatomical (1-2 L)
Bohr Equation (Physiological Dead Space)
- V(D)/V(T) = dead space fraction
- PaCO₂ = arterial CO₂ (gold standard; approximates alveolar CO₂ in healthy lungs)
- P(E)CO₂ = mixed expired CO₂
Measurement of Anatomical Dead Space (Fowler Method)
- Single-breath nitrogen washout after O₂ inhalation
- Expired N₂ plotted against expired volume
- Phase I = pure dead space (O₂, no N₂)
- Phase III plateau = alveolar N₂
- Dead space = volume to the midpoint of the rising phase (area method)
Factors Increasing Dead Space - Anaesthesia
| Factor | Mechanism |
|---|---|
| Pulmonary embolism | ↑ Alveolar dead space |
| Deliberate hypotension, low CO | ↓ Pulmonary perfusion → ↑ alveolar VD |
| PEEP excess | Zone 1 formation |
| Age | Structural changes |
| ETT + breathing circuit | ↑ Apparatus dead space |
| Semi-recumbent/supine position | ↓ relative perfusion of apex |
| Anticholinergics/bronchodilators | ↑ Anatomical (bronchodilation) |
8. ALVEOLAR VENTILATION
Definition
Formula
- f = 12 breaths/min, V(T) = 500 mL, V(D) = 150 mL
- V̇A = 12 × (500 - 150) = 4,200 mL/min (4.2 L/min)
- Total minute ventilation (V̇E) = 12 × 500 = 6,000 mL/min
- Dead space ventilation = 12 × 150 = 1,800 mL/min
Alveolar Ventilation Equation
- Hypoventilation → PaCO₂ ↑
- Hyperventilation → PaCO₂ ↓
Rapid Shallow Breathing Index (RSBI)
-
105 breaths/min/L predicts weaning failure
- Reflects inadequate alveolar ventilation per unit effort
Practical Implications - Anaesthesia
| Scenario | Effect on V̇A |
|---|---|
| Respiratory rate 20, V(T) 300 mL (rapid shallow) | V̇A = 20 × (300-150) = 3,000 mL/min - INADEQUATE |
| Respiratory rate 6, V(T) 800 mL (slow deep) | V̇A = 6 × (800-150) = 3,900 mL/min - Better |
| Increased V(D) (e.g., PE) without ↑V(T) | V̇A falls → hypercapnia |
| Controlled ventilation with low V(T) | Must ↑ RR to maintain V̇A |
Relationship to Gas Exchange
- Alveolar CO₂ (PAco₂) ≈ PaCO₂ (assuming normal V/Q)
- Alveolar O₂ (PAO₂) = PIO₂ - (PaCO₂/RQ)
- Decreased V̇A → ↑PaCO₂ and ↓PAO₂ (hypercapnia + hypoxia)
Summary Table - High-Yield Exam Values
| Parameter | Normal Value |
|---|---|
| Static compliance (lung) | 0.2 L/cmH₂O |
| Combined (lung + chest wall) compliance | 0.1 L/cmH₂O |
| Airway resistance | ~1 cmH₂O/L/s |
| Work of breathing | 0.3-0.6 J/breath (~2-3% VO₂) |
| Time constant (τ = R×C) | ~0.2 seconds |
| Anatomical dead space | ~150 mL (2 mL/kg) |
| V(D)/V(T) ratio | 0.25-0.35 |
| Alveolar ventilation | ~4.2 L/min |
| Total minute ventilation | ~6 L/min |
Key Mnemonics for Exam
- Both limbs plateau → Fixed obstruction
- Only Inspiratory plateau → Extrathoracic variable (vocal cord, stridor - affects Inhaling)
- Only Expiratory plateau → Intrathoracic variable (tracheomalacia - affects Exhaling)