
Give me history points, clinical features, investigations and Management of inferior wall MI
ECG showing inferior wall myocardial infarction ST elevation leads II III aVF
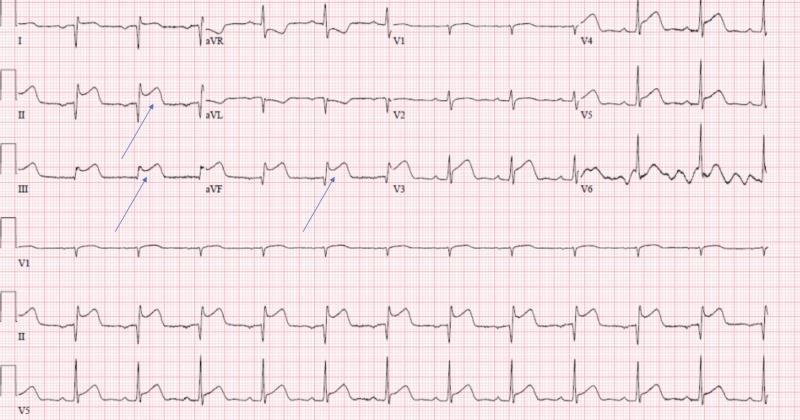
This diagnostic image is a 12-lead electrocardiogram (ECG) printed on standard red-grid paper, demonstrating findings consistent with an acute inferior wall ST-segment elevation myocardial infarction (STEMI). Significant ST-segment elevation is clearly visible in the inferior leads (II, III, and aVF), with the elevation in lead III being particularly prominent and exhibiting a convex-upward morphology. Reciprocal ST-segment depression is noted in the high lateral leads (I and aVL). Blue arrows in leads II, III, and aVF highlight the pathognomonic ST-segment displacement. The ECG also includes precordial leads V1-V6 and a rhythm strip at the bottom showing leads V1, II, and V5. Key educational features include the visualization of injury patterns in an anatomical vascular distribution (right coronary artery or left circumflex), making it an essential resource for students learning to identify acute coronary syndromes and distinguish between inferior and lateral wall changes.
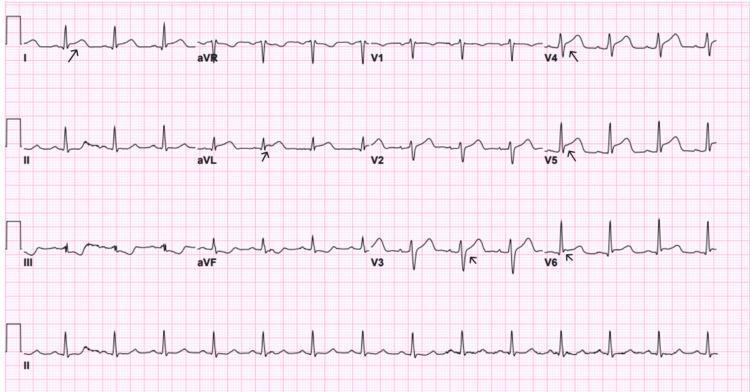
This diagnostic image is a 12-lead electrocardiogram (ECG) showing findings on day zero post-percutaneous coronary intervention (PCI) for an acute anterior wall myocardial infarction. The ECG demonstrates a sinus rhythm with persistent ST-segment elevation in the high lateral leads (I, aVL) and across the precordial leads (V3 through V6). Arrows highlight specific areas of ST-segment elevation and T-wave morphology. The precordial leads show a progression of the QRS complex with visible elevation relative to the isoelectric line, though resolving from previous shark-fin morphology. Leads V1 and V2 exhibit a right bundle branch block (RBBB) pattern, characterized by an rSR' configuration. There is also evidence of reciprocal ST-segment depression in the inferior leads (II, III, and aVF). This ECG is clinically significant for monitoring post-reperfusion status and identifying residual ischemia or evolving infarction patterns in the anterior and lateral myocardial territories.
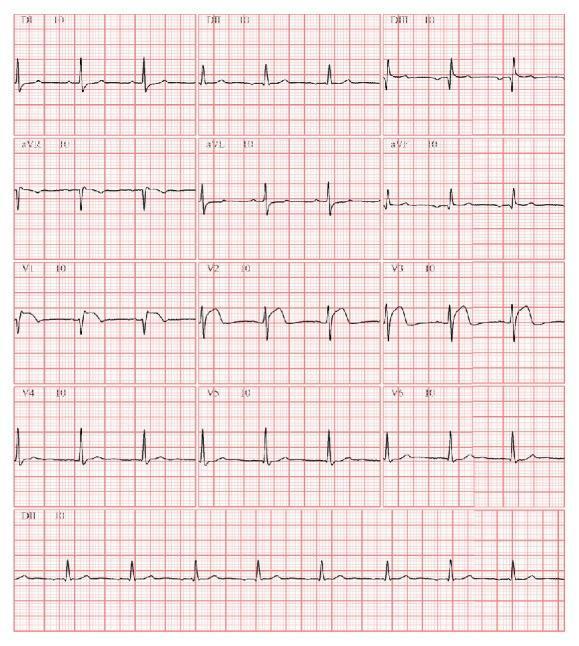
A 12-lead electrocardiogram (ECG) tracing demonstrating acute ischemic changes. The primary diagnostic finding is significant ST-segment elevation in the anterior precordial leads V1, V2, and V3, with V2 and V3 showing peak morphology and upright T waves, consistent with an acute ST-elevation myocardial infarction (STEMI) pattern. Reciprocal ST-segment depression is visible in the inferior leads (II, III, and aVF). The rhythm shows an ectopic atrial rhythm, characterized by P-wave morphology differing from the normal sinus rhythm. Small Q waves or an 'inferior inactive zone' are suggestive of old or evolving inferior wall changes. The QRS duration appears within normal limits. This ECG is a critical diagnostic tool in the emergency management of coronary artery occlusion and serves as an educational example of precordial ST-elevation with associated inferior reciprocal changes.
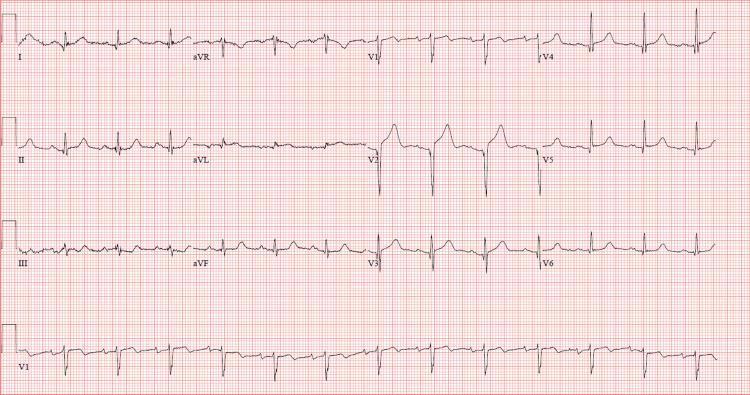
This diagnostic image is a 12-lead electrocardiogram (EKG/ECG) displayed on standard red grid paper, showing a sinus rhythm. The primary clinical findings include significant ST-segment elevation visible in the anterior precordial leads, specifically V2 and V3, as well as lead aVL. In lead V2, the ST elevation is accompanied by hyperacute, tall, peaked T-waves. These findings are highly suggestive of an acute anterior wall myocardial infarction or ischemia. The tracing shows no obvious reciprocal ST-segment depression in the inferior leads (II, III, aVF) within this view. The QRS complexes are narrow and the rhythm appears regular. This visual material is used in emergency medicine and cardiology for identifying acute coronary syndromes and localizing wall motion abnormalities corresponding to coronary artery territories, such as the left anterior descending artery.
"inferior myocardial infarction" AND management
Inferior Wall Myocardial Infarction (IWMI)
1. History Points
- Chest pain/discomfort: substernal or left-sided, described as pressure, heaviness, tightness, squeezing, or fullness (occasionally sharp/stabbing); radiating to jaw, neck, or either arm - Tintinalli's Emergency Medicine, p. 377
- Associated autonomic/vagal symptoms: nausea, vomiting, diaphoresis, lightheadedness, syncope - these are classically more prominent in inferior MI because of vagal stimulation from the inferior wall/RCA territory
- Dyspnea and palpitations may occur
- Ask about onset, duration, precipitating factors (exertion, cold exposure, emotional stress) and prior similar episodes
- Cardiac risk factor history: smoking, diabetes, hypertension, dyslipidemia, family history of premature CAD, prior MI/revascularization
- Specifically screen for symptoms suggesting right ventricular (RV) involvement - hypotension, and symptoms out of proportion to the ECG (RV infarction complicates ~30% of inferior MIs when the RCA occludes proximal to the acute marginal branch) - Goldman-Cecil Medicine
- Note that vagally-mediated bradycardia/hypotension with inferior MI can mimic or be confused with other conditions (e.g., gastroenteritis, vasovagal episodes) - Rosen's Emergency Medicine
2. Clinical Features (Examination)
- Bradycardia and hypotension - common because the RCA supplies the SA and AV nodes in most people, and there is increased vagal tone
- Heart block: sinus bradycardia, first-degree AV block, or higher-grade (Mobitz I/complete) AV block - usually supra-Hisian, transient, and typically resolves with reperfusion - Fuster and Hurst's The Heart
- Signs of RV infarction (if present): elevated jugular venous pressure, Kussmaul's sign, hypotension, with clear lung fields (distinguishing it from left heart failure) - Rosen's Emergency Medicine
- Relative absence of pulmonary edema compared with anterior MI, unless there is extensive LV involvement
- S4 gallop common; S3 if significant LV dysfunction develops
- Watch for complications: papillary muscle dysfunction/rupture (posteromedial papillary muscle, single blood supply from PDA - mitral regurgitation murmur), and rarely free wall rupture or VSD
3. Investigations
- ST-segment elevation in leads II, III, aVF, often with reciprocal ST depression in I and aVL
- Lead III elevation > lead II elevation suggests RCA occlusion; the reverse (II ≥ III) suggests left circumflex (LCX) occlusion
- Right-sided leads (V4R-V6R): mandatory in every inferior MI to detect RV infarction - ST elevation ≥1 mm in V4R is >90% sensitive/specific for acute RV injury - Tintinalli's Emergency Medicine
- Posterior leads (V7-V9): to detect associated true posterior/lateral extension from a dominant circumflex occlusion (seen as ST depression in V1-V3 on standard leads)
- Serial ECGs to track resolution of ST elevation (failure to resolve >50-70% within 1-2 hours after fibrinolysis suggests failed reperfusion, prompting rescue PCI)
- Echocardiography: regional wall motion abnormality of the inferior wall, RV function/dilatation, mechanical complications (MR from papillary muscle involvement, VSD, effusion)
- Coronary angiography: definitive study, identifies culprit vessel (RCA in ~80-90%, LCX in the remainder) and guides primary PCI
- Chest X-ray, baseline labs (renal function, electrolytes, lipid panel, glucose, CBC)
4. Management
- Oxygen only if SpO2 <90% or respiratory distress
- Aspirin 162-325 mg chewed
- P2Y12 inhibitor: clopidogrel, ticagrelor, or prasugrel (choice/timing depends on reperfusion strategy)
- Anticoagulation: unfractionated heparin, enoxaparin, or fondaparinux
- Pain control: morphine if needed, but use cautiously (see caveats below)
- Primary PCI is preferred - goal door-to-balloon time ≤90 minutes
- If timely PCI is unavailable (e.g., transfer time >120 min), give fibrinolytics (alteplase, tenecteplase, reteplase, streptokinase) - goal door-to-needle ≤30 minutes, followed by transfer for angiography
- Avoid or use nitrates and morphine cautiously, especially if RV infarction is suspected - these agents reduce preload and can precipitate severe hypotension in a preload-dependent RV-infarcted state
- Avoid diuretics in RV infarction for the same reason
- If hypotensive with clear lungs (suspect RV infarction): give IV fluid boluses to maintain RV preload; use inotropes (e.g., dobutamine) if fluids are insufficient; avoid vasodilators
- Symptomatic bradycardia/AV block: atropine first-line; temporary transvenous pacing for high-degree block (Mobitz II, complete heart block) or hemodynamically significant bradycardia unresponsive to atropine
- Beta-blockers: withhold in the acute setting if bradycardia, hypotension, or advanced AV block is present; introduce once the patient is hemodynamically stable
- Dual antiplatelet therapy (aspirin + P2Y12 inhibitor) for at least 12 months
- High-intensity statin
- ACE inhibitor/ARB, especially with LV dysfunction
- Beta-blocker once stable
- Risk factor modification (smoking cessation, diabetes/BP/lipid control) and cardiac rehabilitation