
MRI findings in multiple sclerosis
Reading File
MRI is the cornerstone of MS diagnosis. Key findings include periventricular white matter lesions (Dawson's fingers), juxtacortical and infratentorial plaques, enhancing active lesions on gadolinium, and "black holes" in chronic disease. The McDonald criteria rely heavily on MRI to demonstrate dissemination in space (DIS) and time (DIT).
Searching sources...
Finding Sources
Searching PubMed
"multiple sclerosis"[MeSH Terms] AND "magnetic resonance imaging"[MeSH Terms]
Finding Sources
Finding Sources
Good - I have multiple strong sources. Let me read the key sections from Goldman-Cecil, Harrison's, and Grainger & Allison's radiology textbook.
Reading File
Reading File
Now let me read more from Goldman-Cecil (the MRI section continues) and also get Harrison's content plus search for any images.
Reading File
Finding Sources
Finding Sources
Excellent. I have rich content and image URLs. Let me read the key sections with more detail and grab the images.
Reading File
Reading File
Reading File
I now have comprehensive content from multiple authoritative textbooks with images. Let me read the continuation from Grainger & Allison to get the black holes and serial MRI monitoring content, then compile my answer.
Reading File
I now have comprehensive content from multiple textbooks. Let me compile the full answer with images.
MRI Findings in Multiple Sclerosis
MRI is the single most important paraclinical tool for diagnosing and monitoring MS. More than 95% of patients with clinically definite MS have an abnormal brain MRI; a normal brain MRI should prompt consideration of an alternative diagnosis.
1. Lesion Characteristics - General
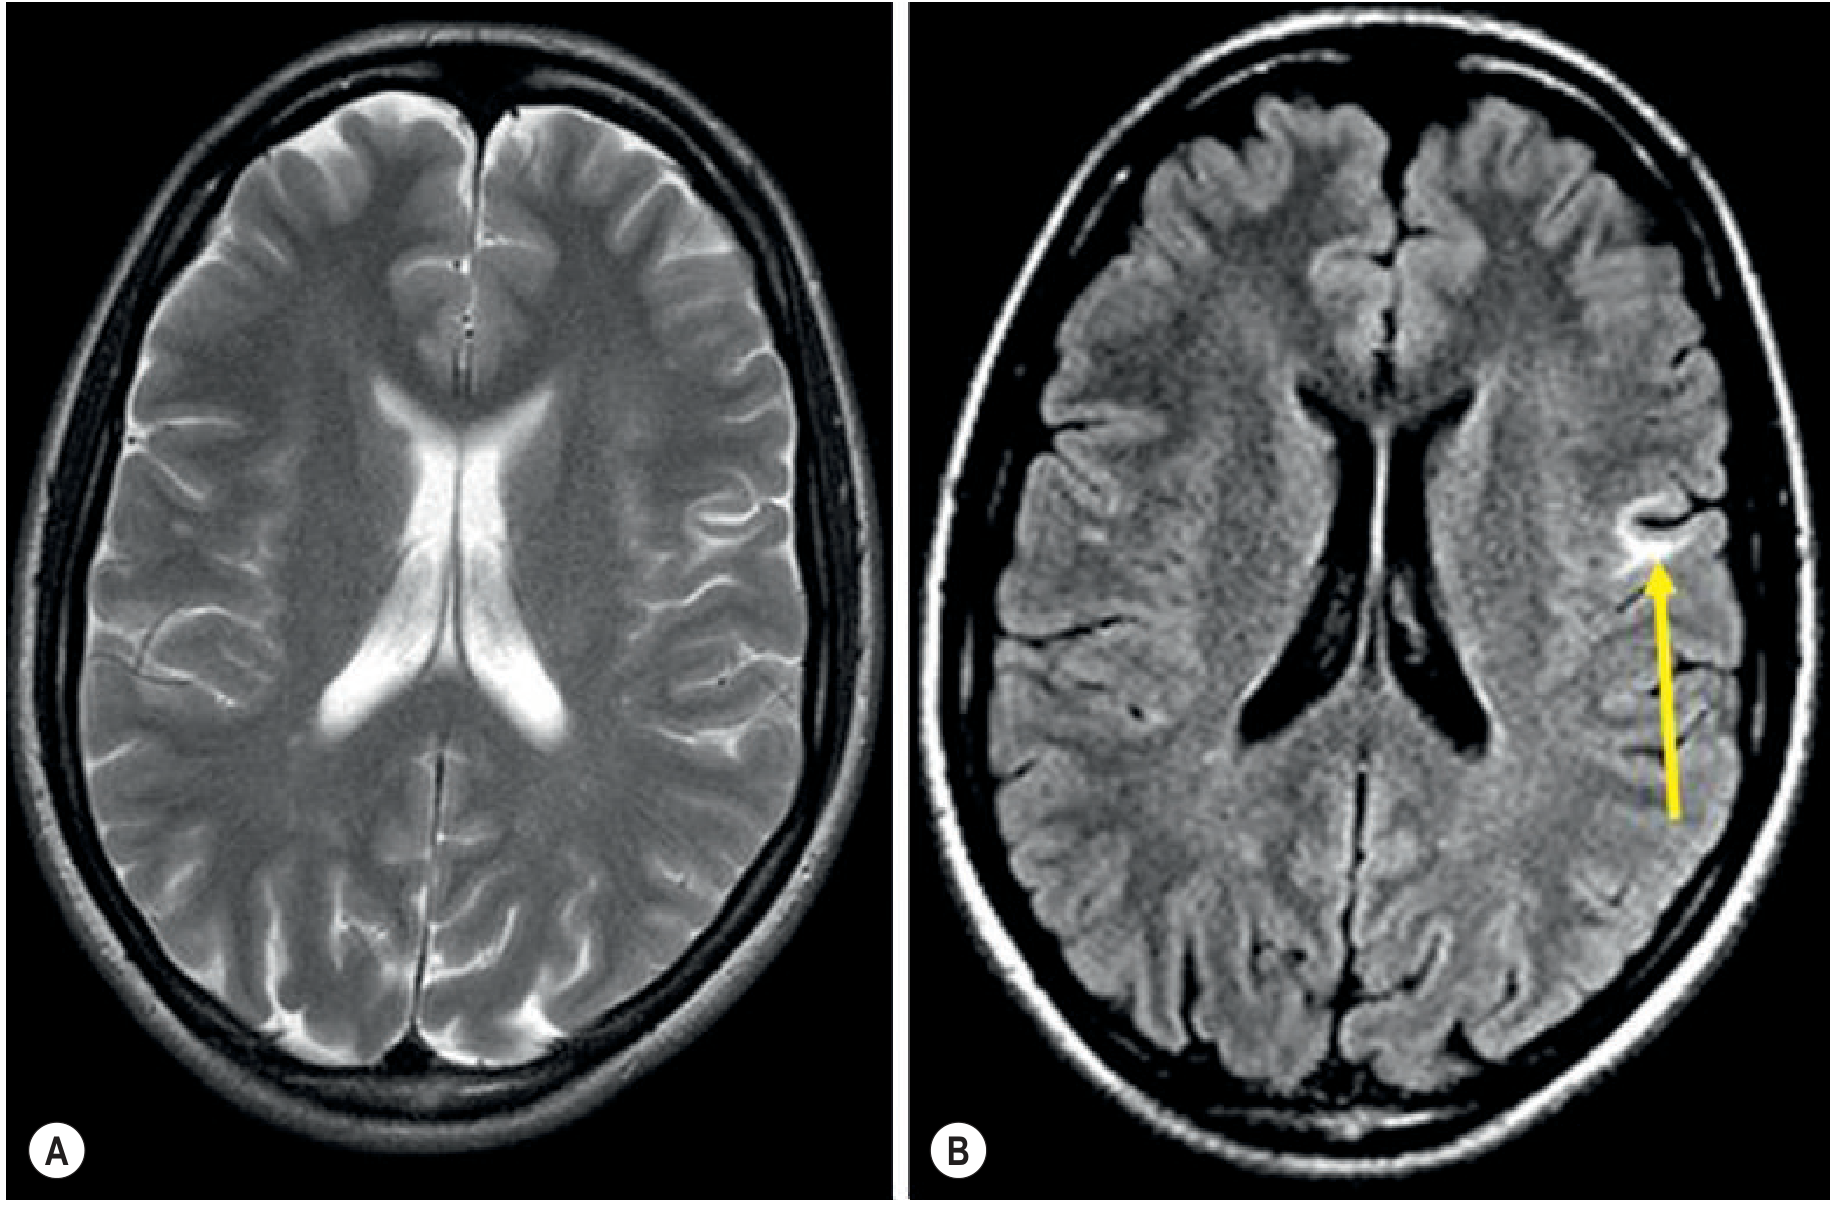
MS plaques appear as T2-hyperintense (bright) lesions on fluid-attenuated inversion recovery (FLAIR) sequences, which suppress CSF signal from the ventricles and optimise detection of supratentorial lesions. Key features of individual lesions:
- Size: typically 2 mm - 2 cm; rarely, large lesions can mimic a tumour
- Shape: elliptical with discrete borders
- Mass effect: absent (helps distinguish from tumour/abscess)
- Margins: well-defined in chronic plaques; less well-defined in acute lesions
2. Lesion Distribution - DIS (Dissemination in Space)
The 2017 McDonald criteria require T2 lesions in at least 2 of 4 CNS regions to demonstrate dissemination in space:
| Region | Details |
|---|---|
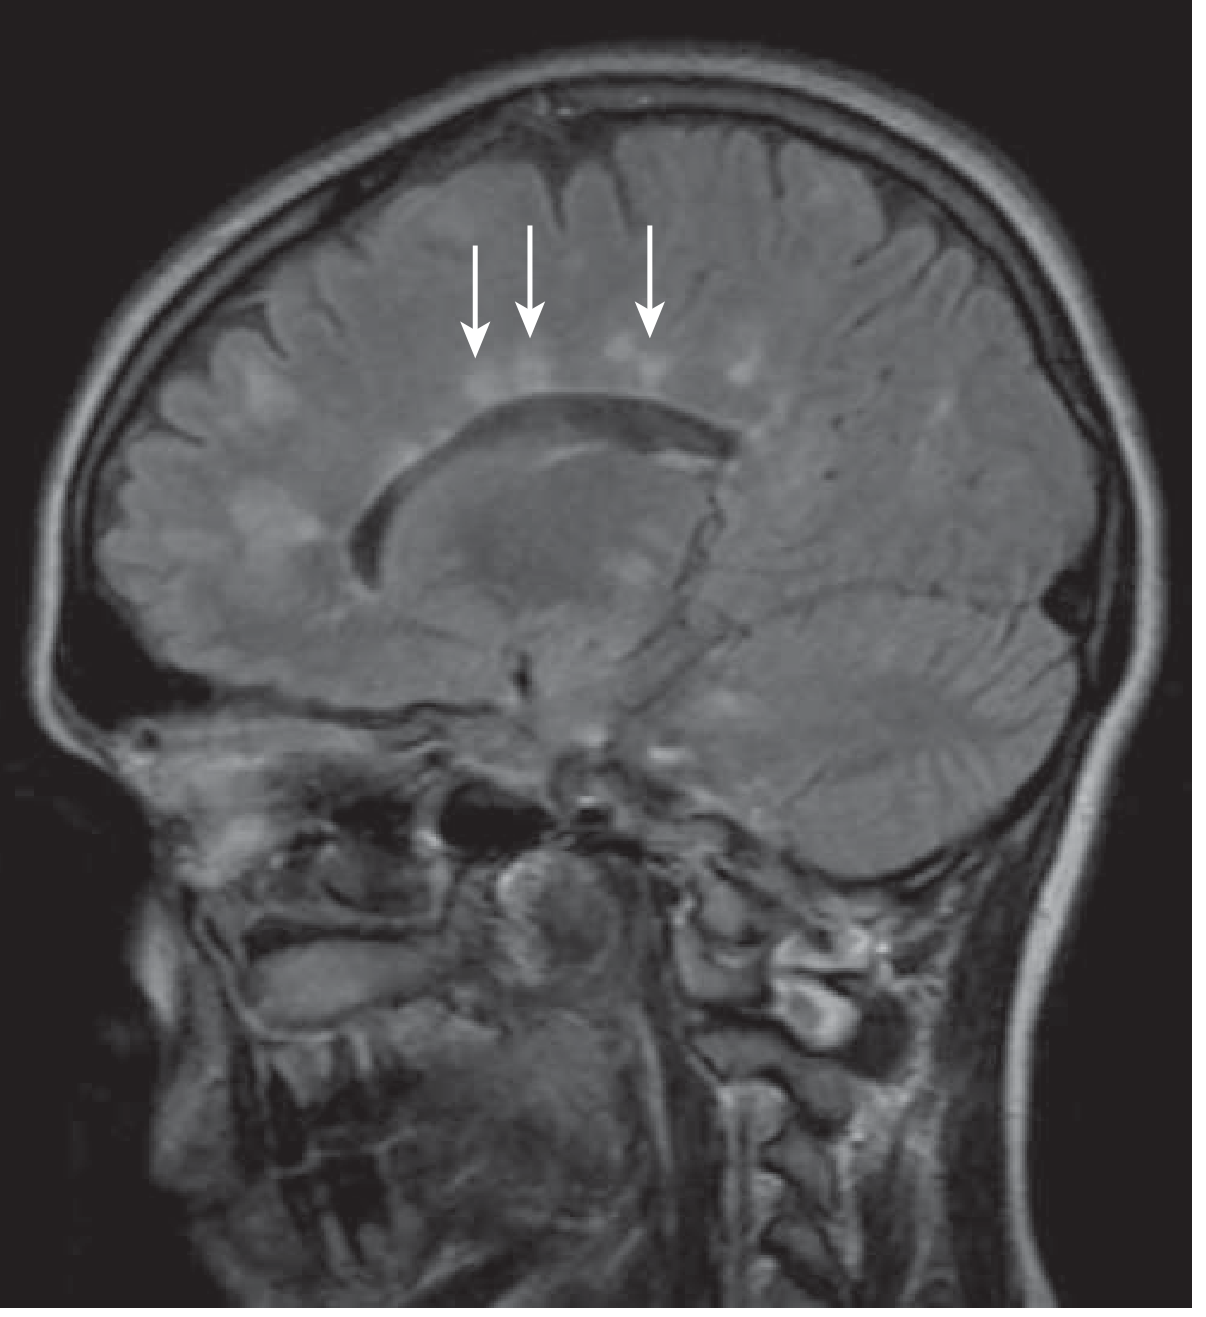
| Periventricular | Perpendicular to lateral ventricle walls - "Dawson's fingers" on sagittal FLAIR |
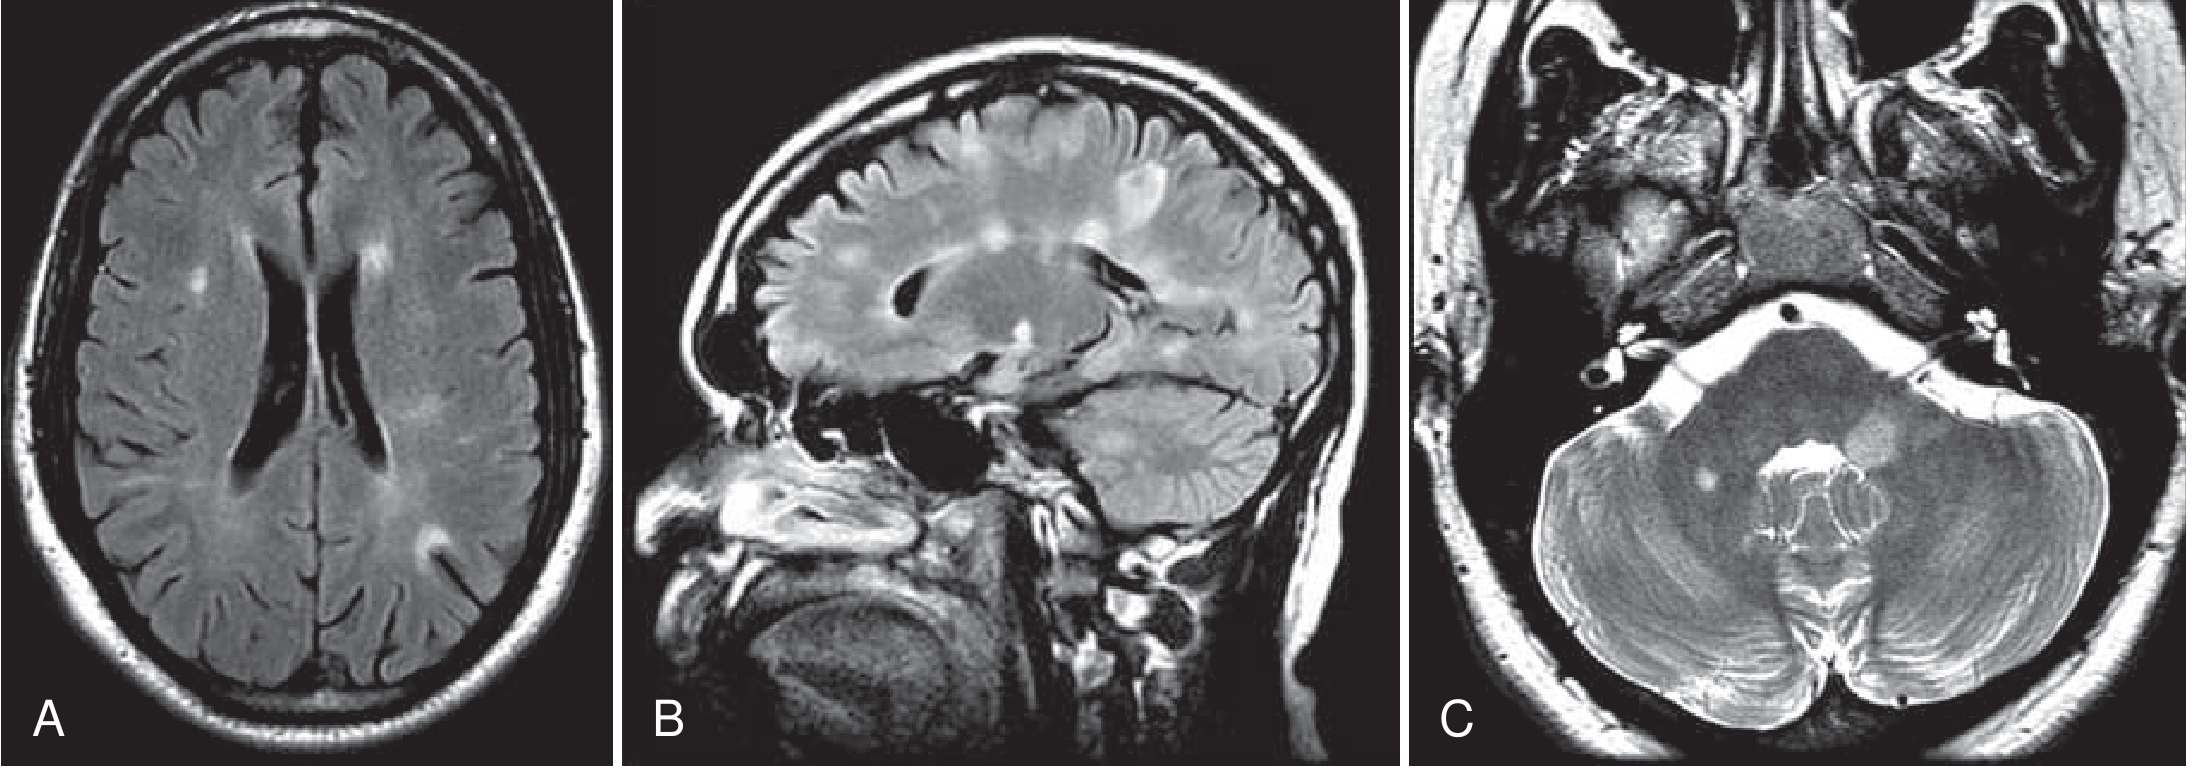
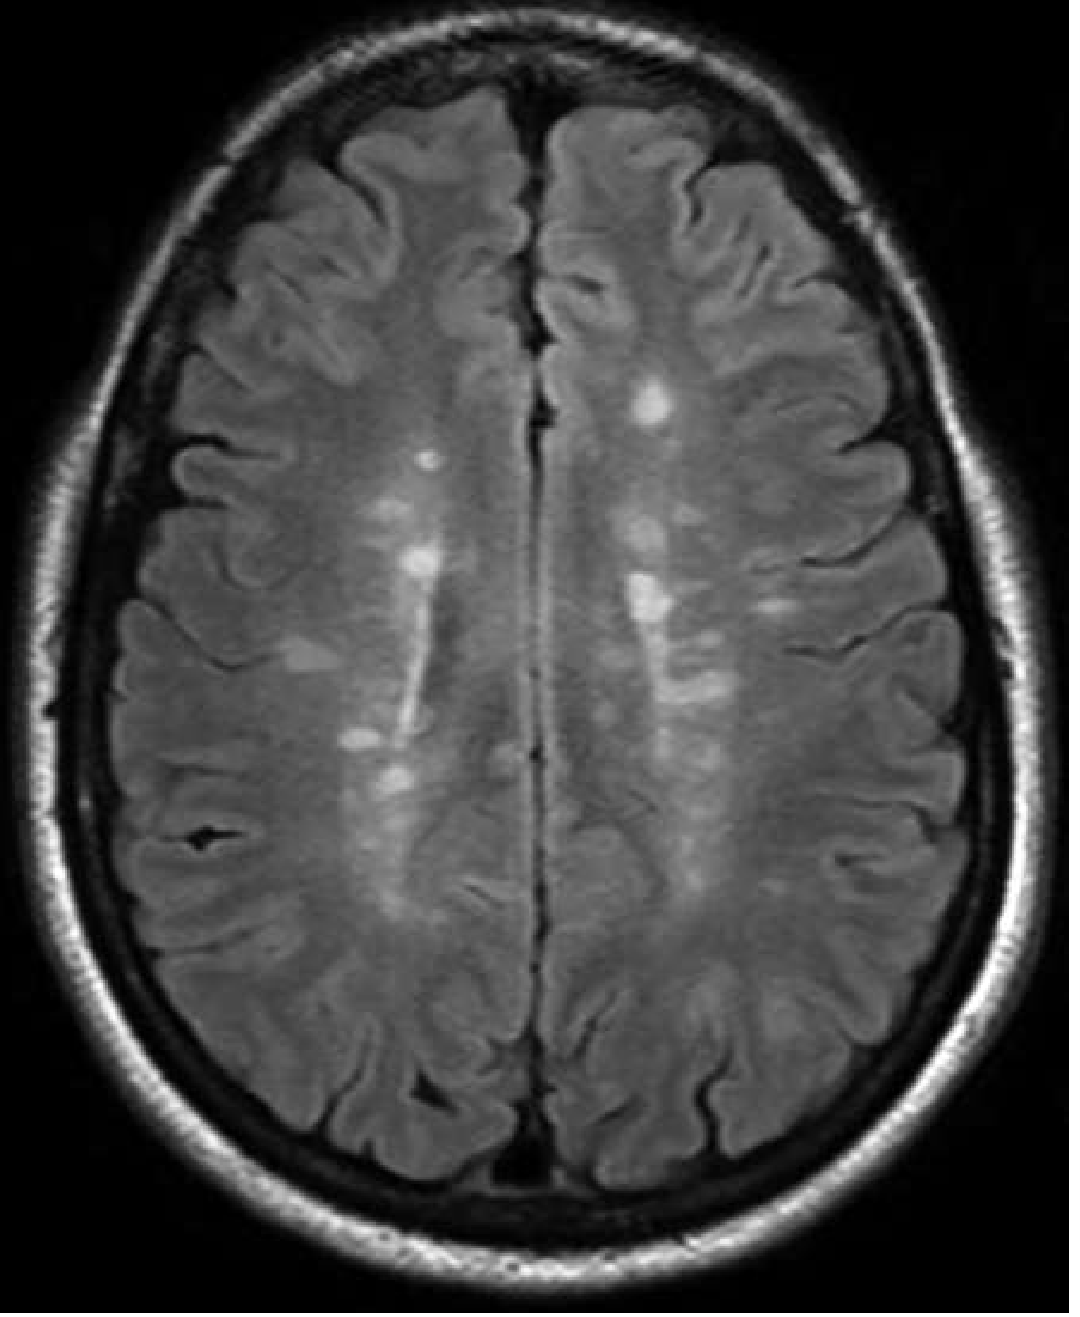
| Cortical / juxtacortical | At the grey-white junction; FLAIR is superior to T2 for detection |
| Infratentorial | Cerebellum, cerebellar peduncles, brainstem (outer margin of pons) |
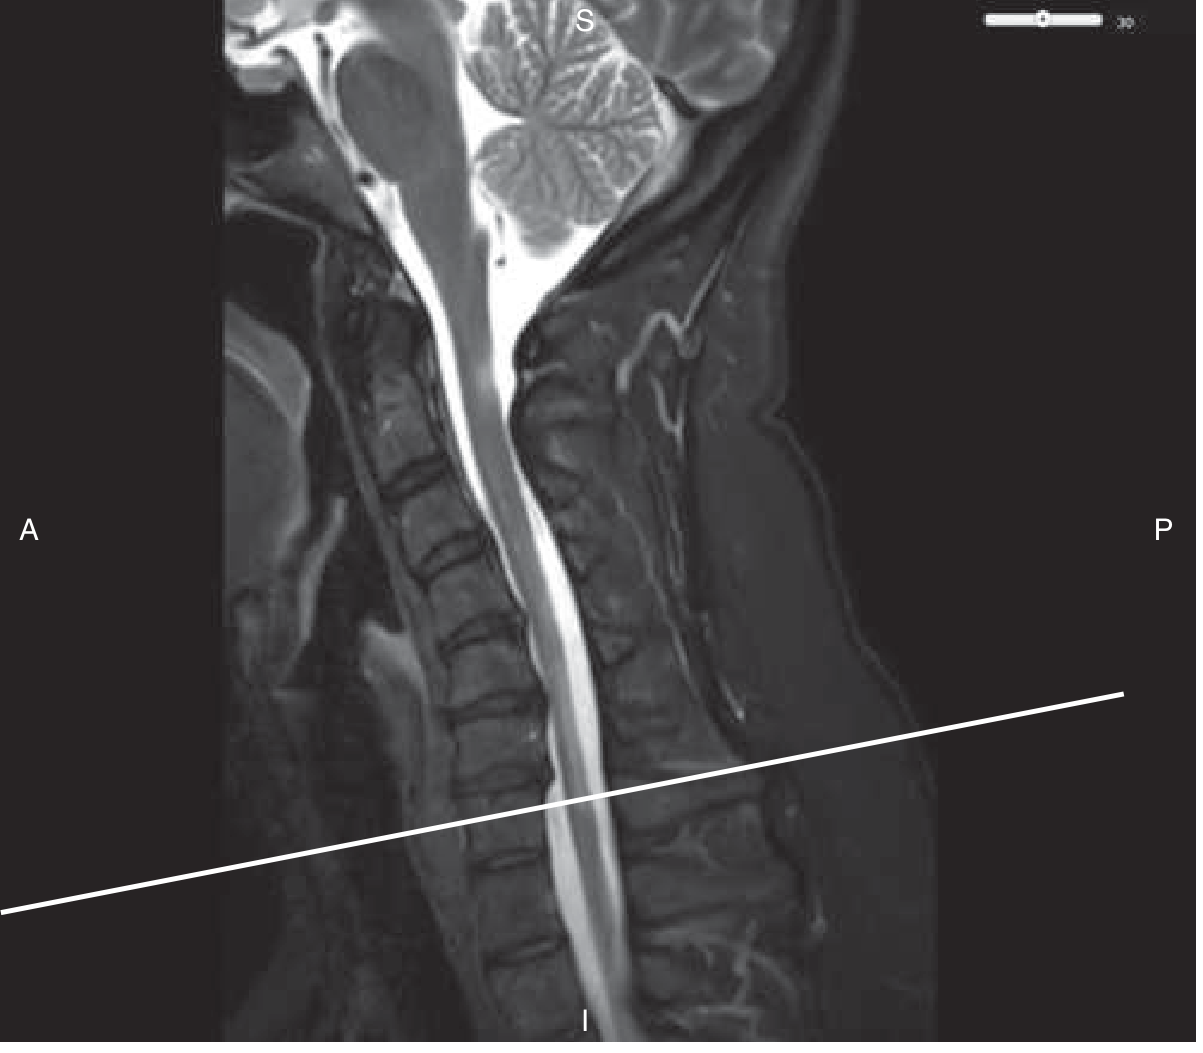
| Spinal cord | Dorsolateral columns; "cigar-shaped" <2 vertebral segments; rarely >half cord cross-section |
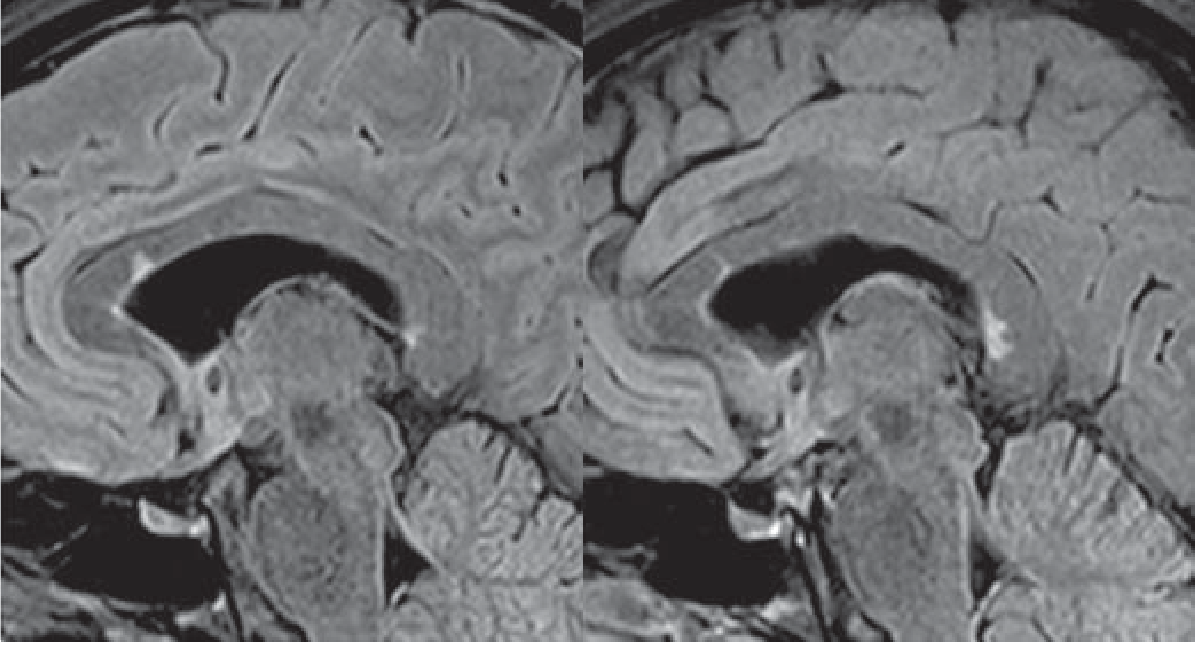
The calloso-septal interface (inferior margin of the corpus callosum) is a classic location, well seen on sagittal FLAIR.
3. Dawson's Fingers
On sagittal FLAIR, periventricular lesions orient perpendicularly outward from the ventricles along perivascular spaces - producing the classic "Dawson's fingers" sign. This orientation reflects the perivenular distribution of MS plaques.
4. Juxtacortical Lesions
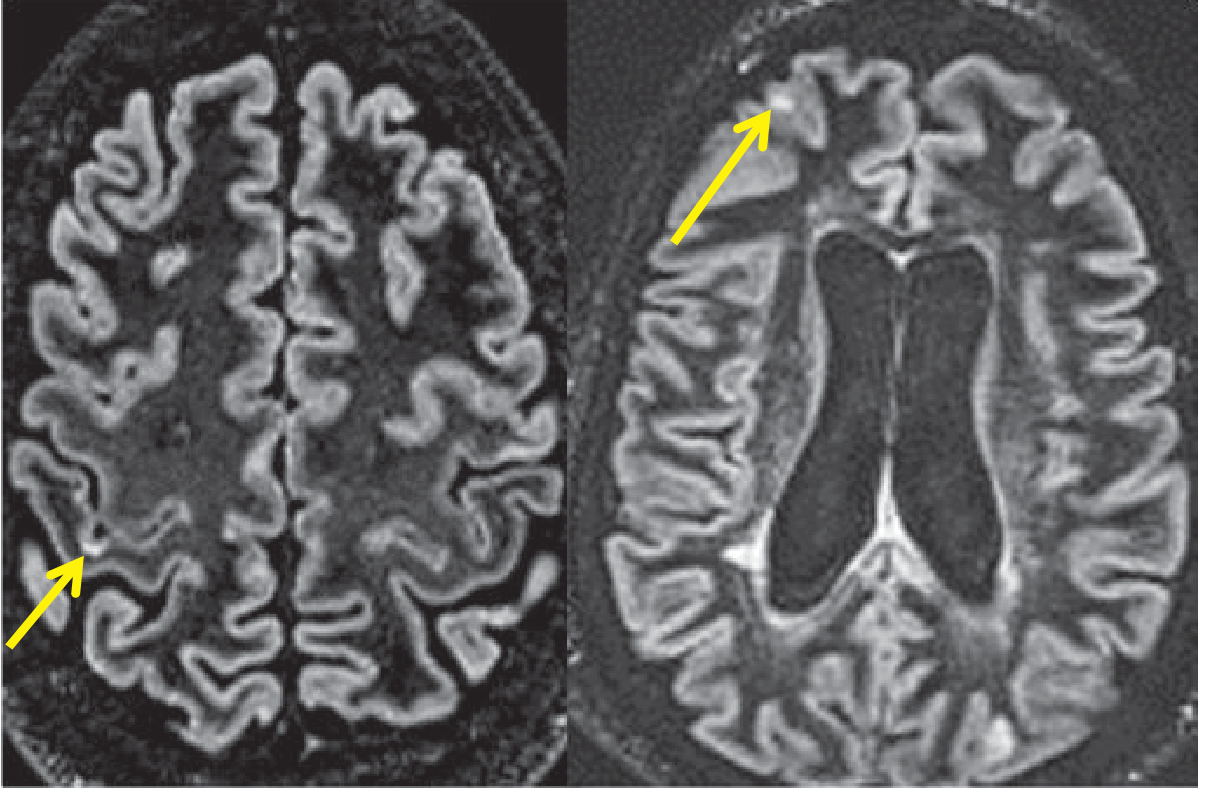
Lesions at the grey-white junction (juxtacortical) are best seen on FLAIR compared with standard T2. They are one of the four DIS regions in the McDonald criteria. Double inversion recovery (DIR) sequences offer the highest sensitivity for detecting purely cortical lesions.
5. Gadolinium Enhancement - Active / Acute Lesions
Gadolinium enhancement indicates blood-brain barrier disruption due to acute perivascular inflammation. It detects disease activity 5-10 times more frequently than clinical relapse assessment alone.
Key facts about enhancement in MS:
- Duration: typically days to weeks (median ~3 weeks; rarely beyond 2-3 months)
- Pattern: nodular, homogeneous, or ring-type; may evolve from nodular to ring
- Open (incomplete) ring enhancement is a useful sign - the open side faces grey matter/cortex, unlike the closed rings of abscess or high-grade tumour
- Enhancement is rapidly suppressed by steroids
- Less frequent in spinal cord vs. brain (4-10x more common in brain)
- Even clinically stable patients can have enhancing lesions (subclinical activity)

6. T1 "Black Holes"
Persistent areas of T1 hypointensity (dark on pre-contrast T1) are called "black holes." They correlate with irreversible axonal loss and atrophy - the neurodegenerative component of MS. They are a marker of poor prognosis and are monitored in disease-modifying therapy (DMT) decisions. Acute T1 lesions can also appear (reflecting edema/demyelination) but may resolve; persistent T1 hypointensity implies permanent tissue destruction.
7. Spinal Cord MRI
- Detected in up to 90% of MS patients, often asymptomatic
- Cervical > thoracic > lumbar in frequency
- Sagittal appearance: "cigar-shaped," spanning <2 vertebral segments
- Cross-sectional: lateral and posterior white matter columns; rarely anterior columns or central grey matter; rarely >50% cord cross-section
- These cord features help differentiate MS from NMOSD (which causes longer, central cord lesions >3 segments)
8. Dissemination in Time (DIT) on MRI
DIT can be demonstrated by:
- Simultaneous presence of a gadolinium-enhancing lesion AND a non-enhancing T2 lesion on a single scan (they represent lesions of different ages)
- New T2 or gadolinium-enhancing lesion on a follow-up scan compared with baseline, regardless of the interval between scans
9. Brain Atrophy
Brain volume loss is the most robust MRI biomarker of neurodegeneration in MS. Atrophy occurs from early in the disease course, even in clinically isolated syndrome, and progresses across all phenotypes. It parallels disability accumulation better than T2 lesion load alone in progressive MS.
10. Advanced / Quantitative MRI Techniques
| Technique | What It Measures |
|---|---|
| Magnetisation transfer ratio (MTR) | Myelin content / demyelination in NAWM |
| Diffusion tensor imaging (DTI) | Axonal integrity, tract disruption |
| Proton MR spectroscopy | NAA (axonal marker), choline, lactate |
| Susceptibility-weighted imaging (SWI) | Iron rims around chronic active lesions ("rim signs") |
| Optical coherence tomography (OCT) | Retinal nerve fibre layer - surrogate for optic nerve/CNS damage |
These are used in research but not yet routine clinical practice for treatment monitoring.
11. Primary Progressive MS (PPMS) on MRI
PPMS typically shows:
- Smaller T2 lesion load and less gadolinium enhancement than relapsing MS
- More prominent spinal cord involvement
- Greater cortical damage and diffuse normal-appearing white matter (NAWM) damage
- This "MRI-clinical paradox" (modest MRI lesion load but significant disability) is partly explained by extensive cortical and spinal cord pathology
McDonald Criteria 2017 Summary (MRI-based)
DIS = ≥1 T2 lesion in ≥2 of: periventricular, cortical/juxtacortical, infratentorial, spinal cord
DIT = Simultaneous enhancing + non-enhancing lesions at any time point, OR new T2/Gd+ lesion on follow-up
Sources:
- Goldman-Cecil Medicine, Chapter 380 (pp. 3987-3988)
- Grainger & Allison's Diagnostic Radiology, Chapter 58 (pp. 1503-1504)
- Bradley and Daroff's Neurology in Clinical Practice, Chapter 80 (p. 1722)
This is a shared conversation. Sign in to Orris to start your own chat.