
Line of treatment for heart attack
"myocardial infarction"[MeSH Terms] AND "reperfusion"[MeSH Terms]
STEMI treatment algorithm reperfusion pathway PCI fibrinolysis flowchart
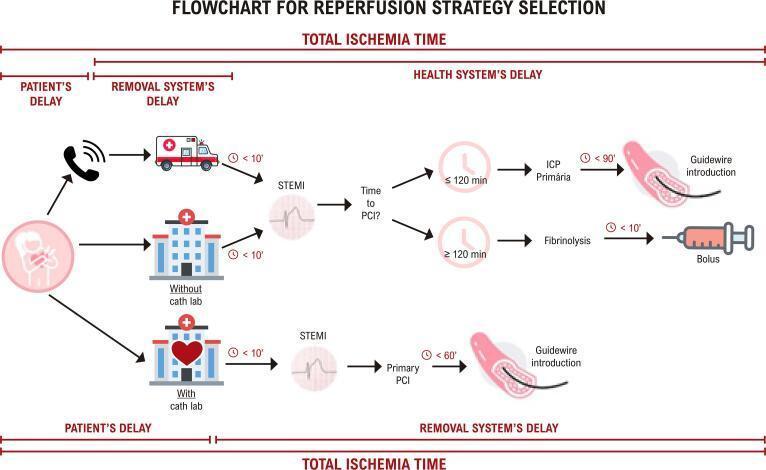
This medical flowchart illustrates the reperfusion strategy selection and timeframes for patients with ST-elevation myocardial infarction (STEMI), based on 2018 ESC/EACTS Guidelines. The algorithm maps the 'Total Ischemia Time' from symptom onset, divided into 'Patient\'s Delay' and 'Health System\'s Delay'. Following a STEMI diagnosis (visualized by ST-segment elevation on ECG), the pathway bifurcates based on hospital capabilities. For hospitals with a catheterization lab (cath lab), the goal for Primary Percutaneous Coronary Intervention (PCI) is <60 minutes to guidewire introduction. For patients at hospitals without a cath lab or via emergency medical services, the decision depends on 'Time to PCI'. If the estimated PCI delay is ≤120 minutes, Primary PCI is preferred with a goal of <90 minutes. If the estimated delay is >120 minutes, immediate fibrinolysis (bolus) is indicated within 10 minutes. The diagram emphasizes minimizing 'Removal System\'s Delay' to ensure optimal myocardial revascularization and clinical outcomes.
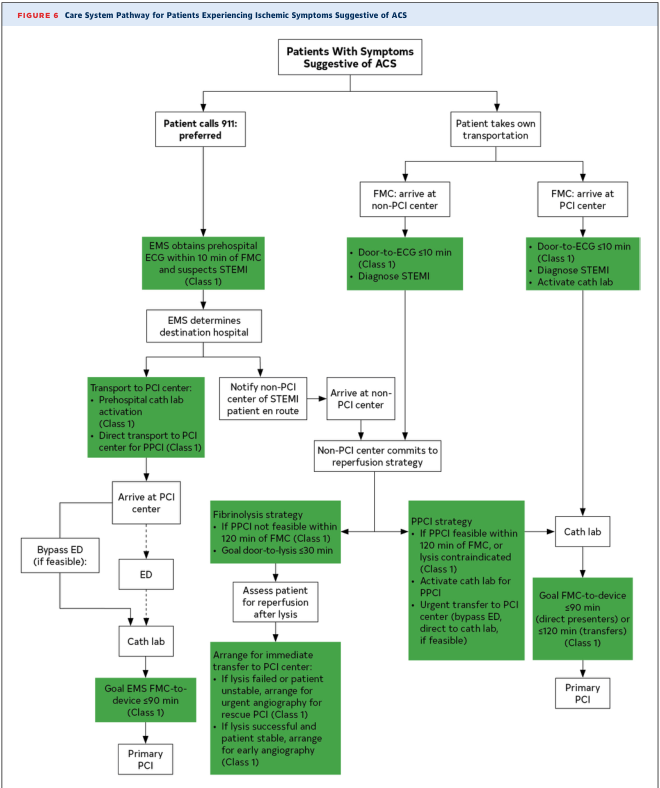
Summary : This figure presents a care system pathway for patients experiencing ischemic symptoms suggestive of acute coronary syndrome (ACS), detailing the recommended steps for emergency medical services (EMS), hospital arrival, and reperfusion strategies based on the patient's mode of transportation and hospital capabilities. flowchart: # Nodes : • Start: Patients With Symptoms Suggestive of ACS (rectangle) • Patient calls 911: preferred (rectangle) • EMS obtains prehospital ECG within 10 min of FMC and suspects STEMI (Class 1) (rectangle) • EMS determines destination hospital (rectangle) • Transport to PCI center: Prehospital cath lab activation (Class 1), Direct transport to PCI center for PPCI (Class 1) (rectangle) • Arrive at PCI center (rectangle) • Bypass ED (if feasible) (rectangle) • ED (rectangle) • Cath lab (rectangle) • Goal EMS FMC-to-device ≤90 min (Class 1) (rectangle) • Primary PCI (rectangle) • Notify non-PCI center of STEMI patient en route (rectangle) • Arrive at non-PCI center (rectangle) • Non-PCI center commits to reperfusion strategy (rectangle) • Fibrinolysis strategy: If PPCI not feasible within 120 min of FMC (Class 1), Goal door-to-lysis ≤30 min (rectangle) • Assess patient for reperfusion after lysis (rectangle) • Arrange for immediate transfer to PCI center: If lysis failed or patient unstable, arrange for urgent angiography for rescue PCI (Class 1); If lysis successful and patient stable, arrange for early angiography (Class 1) (rectangle) • PPCI strategy: If PPCI feasible within 120 min of FMC, or lysis contraindicated (Class 1), Activate cath lab for PPCI, Urgent transfer to PCI center (bypass ED, direct to cath lab, if feasible) (rectangle) • Cath lab (rectangle) • Goal FMC-to-device ≤90 min (direct presenters) or ≤120 min (transfers) (Class 1) (rectangle) • Primary PCI (rectangle) • Patient takes own transportation (rectangle) • FMC: arrive at non-PCI center (rectangle) • Door-to-ECG ≤10 min (Class 1), Diagnose STEMI (rectangle) • FMC: arrive at PCI center (rectangle) • Door-to-ECG ≤10 min (Class 1), Diagnose STEMI, Activate cath lab (rectangle) # Connectors : • Arrows indicate progression from symptom onset to EMS or self-transport, then to hospital arrival, diagnosis, and reperfusion strategy. • Branches split based on whether the patient calls 911 or self-transports, and whether the hospital is a PCI or non-PCI center. • Decision points include EMS determination of hospital, non-PCI center commitment to reperfusion strategy, and assessment after fibrinolysis. • Merges occur at the cath lab and primary PCI endpoints. # Layout : • The flowchart is organized into three main vertical pathways: EMS/911 activation, self-transport to non-PCI center, and self-transport to PCI center. • Each pathway includes time-based goals (e.g., ECG within 10 min, FMC-to-device ≤90 min). • Green boxes highlight key actions and time targets. • The chart uses solid arrows for process flow and decision branches. # Analysis : • The figure emphasizes rapid diagnosis and treatment for STEMI, with clear time goals for ECG, lysis, and PCI. • Direct transport to PCI centers and bypassing ED when feasible are prioritized for faster reperfusion. • Non-PCI centers must quickly commit to either fibrinolysis or transfer for PCI, with specific instructions based on patient stability and response. • The workflow is designed to minimize delays and optimize outcomes for ACS patients, regardless of initial hospital type or mode of arrival.
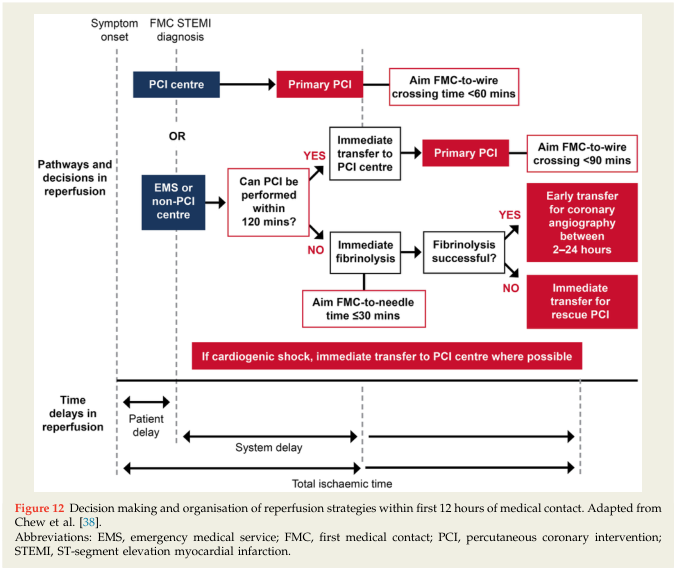
Summary : This flowchart outlines the decision-making and organization of reperfusion strategies for patients with ST-segment elevation myocardial infarction (STEMI) within the first 12 hours of medical contact, focusing on minimizing total ischemic time and system delays. flowchart: # Nodes : • Symptom onset (vertical dashed line, start point) • FMC STEMI diagnosis (vertical dashed line) • PCI centre (rectangle) • Primary PCI (rectangle, red) • Aim FMC-to-wire crossing time <60 mins (rectangle, red) • EMS or non-PCI centre (rectangle) • Can PCI be performed within 120 mins? (diamond) • Immediate transfer to PCI centre (rectangle) • Primary PCI (rectangle, red) • Aim FMC-to-wire crossing <90 mins (rectangle, red) • Immediate fibrinolysis (rectangle) • Aim FMC-to-needle time ≤30 mins (rectangle, red) • Fibrinolysis successful? (diamond) • Early transfer for coronary angiography between 2–24 hours (rectangle, red) • Immediate transfer for rescue PCI (rectangle, red) • If cardiogenic shock, immediate transfer to PCI centre where possible (rectangle, red, spanning bottom of chart) # Connectors : • Arrows indicate flow from symptom onset through diagnosis to either PCI centre or EMS/non-PCI centre. • From PCI centre → Primary PCI → Aim FMC-to-wire crossing time <60 mins. • From EMS/non-PCI centre → Can PCI be performed within 120 mins? – YES: Immediate transfer to PCI centre → Primary PCI → Aim FMC-to-wire crossing <90 mins. – NO: Immediate fibrinolysis → Aim FMC-to-needle time ≤30 mins → Fibrinolysis successful? ▫ YES: Early transfer for coronary angiography between 2–24 hours. ▫ NO: Immediate transfer for rescue PCI. • If cardiogenic shock at any point, immediate transfer to PCI centre where possible. # Layout : • Flow is left-to-right, with vertical swim-lanes for “Pathways and decisions in reperfusion” and “Time delays in reperfusion.” • Patient delay and system delay are indicated as horizontal bars below the main flowchart, contributing to total ischemic time. • Red boxes highlight critical time targets and urgent actions. # Analysis : • The chart emphasizes minimizing delays in reperfusion therapy for STEMI, prioritizing primary PCI when feasible within recommended timeframes. • Decision points focus on the feasibility of PCI within 120 minutes and the success of fibrinolysis, with clear fallback strategies (rescue PCI or early angiography). • Immediate transfer to PCI centre is recommended in cases of cardiogenic shock, regardless of other considerations. • The flowchart visually separates patient delay from system delay, underscoring the importance of rapid system response to reduce total ischemic time.
Line of Treatment for Heart Attack (Acute Myocardial Infarction)
Step 1 - Immediate / Pre-Hospital (First Medical Contact)
| Action | Detail |
|---|---|
| 12-lead ECG | Within 10 min of first medical contact |
| Aspirin (chewed) | 160-325 mg immediately; chewed for rapid buccal absorption |
| O2 supplementation | Only if SpO2 <90% - do NOT give routinely |
| Sublingual Nitroglycerin | 0.4 mg SL q5 min x3 for ongoing ischemic pain. Avoid if SBP <90 mmHg, suspected RV infarct, HR >100 or <50, or recent PDE-5 inhibitor use |
| IV access + monitoring | Continuous cardiac monitoring; defibrillator ready |
| Morphine | 2-4 mg IV only for pain refractory to nitroglycerin (use cautiously - may slow oral drug absorption) |
- Harrison's Principles of Internal Medicine 22E, p.2163
Step 2 - Reperfusion Strategy (The Core of STEMI Treatment)
2A. Primary PCI (Preferred Strategy)
- Goal: First medical contact (FMC) to balloon/wire crossing ≤90 min (direct presenters) or ≤120 min (transfers)
- PCI is preferred over fibrinolysis when achievable within these time windows
- Patients at a non-PCI center should be urgently transferred if PCI can be done within 120 min of FMC
2B. Fibrinolysis (When PCI Not Feasible Within 120 Min)
- Goal: Door-to-needle ≤30 min
- Agents: tPA (alteplase), reteplase, tenecteplase (TNK) - fibrin-specific preferred
- After successful fibrinolysis: transfer to PCI center for angiography at 3-24 hours
- If fibrinolysis fails (persistent chest pain + ST elevation >90 min): Rescue PCI immediately
- Cardiogenic shock: Transfer to PCI center regardless of other factors
- Harrison's Principles of Internal Medicine 22E, pp. 2163-2164; Washington Manual of Medical Therapeutics, p.154
Step 3 - Antithrombotic Therapy (Given Early, With Reperfusion)
Antiplatelet Agents (Dual Antiplatelet Therapy - DAPT)
| Drug | Role |
|---|---|
| Aspirin | 160-325 mg loading, then 75-162 mg/day indefinitely |
| P2Y12 inhibitor | Add to aspirin (choose one): |
| - Ticagrelor | More potent than clopidogrel; preferred in PCI |
| - Prasugrel | More potent; preferred if no prior stroke/TIA, age <75 |
| - Clopidogrel | Standard option, especially with fibrinolysis |
| GP IIb/IIIa inhibitors | (e.g., abciximab, eptifibatide) - for thrombotic complications during PCI |
Anticoagulants
| Drug | Use |
|---|---|
| Unfractionated Heparin (UFH) | Preferred with primary PCI: 60 U/kg bolus (max 4000 U) then 12 U/kg/h infusion (max 1000 U/h); aPTT target 1.5-2x control |
| Enoxaparin (LMWH) | Preferred with fibrinolysis; 30 mg IV bolus then 1 mg/kg SQ bid (if creatinine <2.5 mg/dL in men, <2 mg/dL in women); for ≤8 days |
| Bivalirudin | Alternative to UFH + GPIIb/IIIa; drug of choice in HIT patients; 0.75 mg/kg bolus then 1.75 mg/kg/h |
| Fondaparinux | Option in NSTEMI; avoid in primary PCI (risk of catheter thrombosis) |
- Harrison's Principles of Internal Medicine 22E, pp. 2164-2165; Washington Manual, p.154
Step 4 - Additional Pharmacotherapy (STEMI & NSTEMI)
Beta-Blockers
- Oral beta-blocker within 24 hours of STEMI in all patients WITHOUT:
- Signs of new heart failure or cardiogenic shock (Killip class ≥II)
- Age >70 years, SBP <120 mmHg, HR >110 or <60 bpm, advanced heart block
- Reduce infarct size, prevent arrhythmias, and reduce mortality
- IV beta-blockers: reserved only for arrhythmia control or acute hypertension (can increase mortality if given routinely in STEMI)
ACE Inhibitors / ARBs
- Start within 24 hours of STEMI, especially if:
- EF <40%, anterior infarction, hypertension, or diabetes
- A large meta-analysis (ACE Inhibitor Myocardial Infarction Collaborative Group, 100,000 patients) demonstrated survival benefit
- ARBs substituted if ACE inhibitor intolerant
Statins (High-Intensity)
- Start high-intensity statin therapy (atorvastatin 40-80 mg or rosuvastatin 20-40 mg) early and continue long-term
- LDL target <70 mg/dL (or <55 mg/dL in very high-risk patients)
Aldosterone Antagonists
- Eplerenone or spironolactone for patients with EF ≤40% + HF symptoms or diabetes
- Avoid if creatinine >2.5 mg/dL (men) or >2.0 mg/dL (women), or K+ >5 mEq/L
Step 5 - NSTEMI/UA-Specific Management
| Risk Category | Approach |
|---|---|
| Very high risk (ongoing ischemia, hemodynamic instability, refractory arrhythmia) | Immediate invasive strategy (<2 hours) |
| High risk (elevated troponins, dynamic ECG changes, GRACE score >140) | Early invasive strategy (<24 hours) |
| Intermediate risk | Invasive strategy within 72 hours |
| Low risk | Non-invasive risk stratification before discharge |
Step 6 - Post-MI / Discharge Medications (Long-Term Secondary Prevention)
| Drug Class | Agent | Duration |
|---|---|---|
| Antiplatelet | Aspirin | Lifelong |
| P2Y12 inhibitor | Ticagrelor or clopidogrel | ≥12 months post-ACS |
| Beta-blocker | Metoprolol, carvedilol | Indefinitely (especially if reduced EF) |
| ACE-I / ARB | Ramipril, lisinopril | Indefinitely |
| Statin | Atorvastatin, rosuvastatin | Lifelong |
| Aldosterone antagonist | Eplerenone | If EF ≤40% + HF/diabetes |
Step 7 - Monitoring for Complications in Hospital
- Arrhythmias: VF, VT, AV block - continuous monitoring; defibrillator/pacemaker ready
- Heart failure / cardiogenic shock: Diuretics, vasopressors, intra-aortic balloon pump (IABP) or mechanical circulatory support
- Pericarditis (Dressler syndrome): NSAIDs/colchicine
- LV thrombus: Anticoagulation (warfarin or NOAC)
- Mechanical complications: VSD, papillary muscle rupture, free wall rupture - surgical emergency
Summary Mnemonic: MONA-BASH (Acute Phase)
Morphine (pain control) | Oxygen (if SpO2 <90%) | Nitrates | Aspirin | Beta-blockers | Anticoagulants | Statins | Heparin
Pci.??
percutaneous coronary intervention PCI procedure coronary stent angioplasty diagram
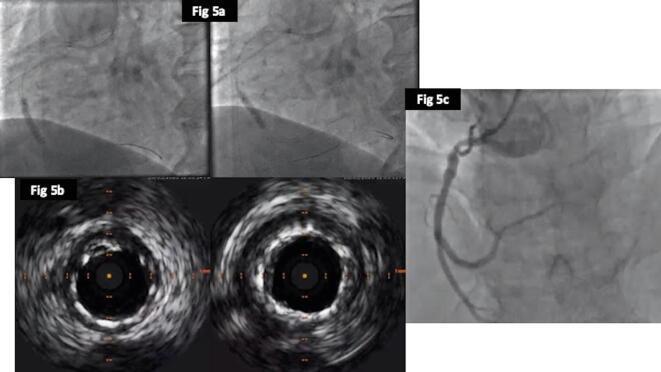
This composite figure illustrates a percutaneous coronary intervention (PCI) procedure for in-stent restenosis (ISR). Panel 5a consists of two fluoroscopic frames showing balloon angioplasty (POBA) being performed to optimize a previously deployed stent in the Right Coronary Artery (RCA); a radiopaque balloon catheter is visible within the vessel lumen. Panel 5b presents cross-sectional Intravascular Ultrasound (IVUS) images, showing a circular, widely patent lumen with improved stent expansion and wall apposition following the intervention. The bright, circumferential echoes represent the expanded stent struts against the vessel wall. Panel 5c displays the final coronary angiogram, revealing an excellent procedural result with a smooth, unobstructed lumen in the RCA and successful restoration of distal blood flow without signs of residual stenosis or dissection. This sequence demonstrates the use of intravascular imaging to guide and verify successful balloon optimization in complex coronary revascularization cases.
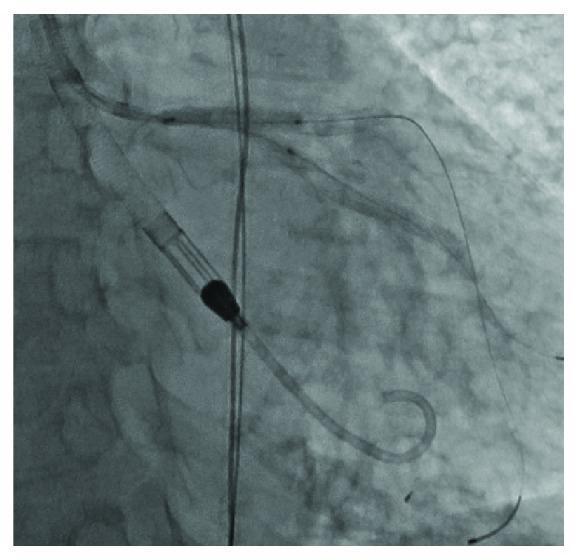
This diagnostic fluoroscopic image captures a Percutaneous Coronary Intervention (PCI) during a 'kissing balloon' dilation procedure. The angiogram displays the bifurcation of the left main coronary artery into the left anterior descending (LAD) and left circumflex (LCx) arteries. Two radiopaque coronary stents with a visible mesh-like morphology are positioned in tandem, extending from the left main artery into the LAD and LCx branches. Two distinct coronary guidewires are seen traversing the length of the stents and extending into the distal vasculature. Notably, two angioplasty balloons are simultaneously inflated at the bifurcation to ensure optimal stent expansion and bifurcation patency. A large-bore catheter (Impella device) is also visible in the cardiac silhouette, providing hemodynamic support. The image demonstrates complex interventional techniques for treating coronary bifurcation lesions, highlighting the use of simultaneous balloon inflation to prevent side-branch occlusion and maintain vessel geometry.
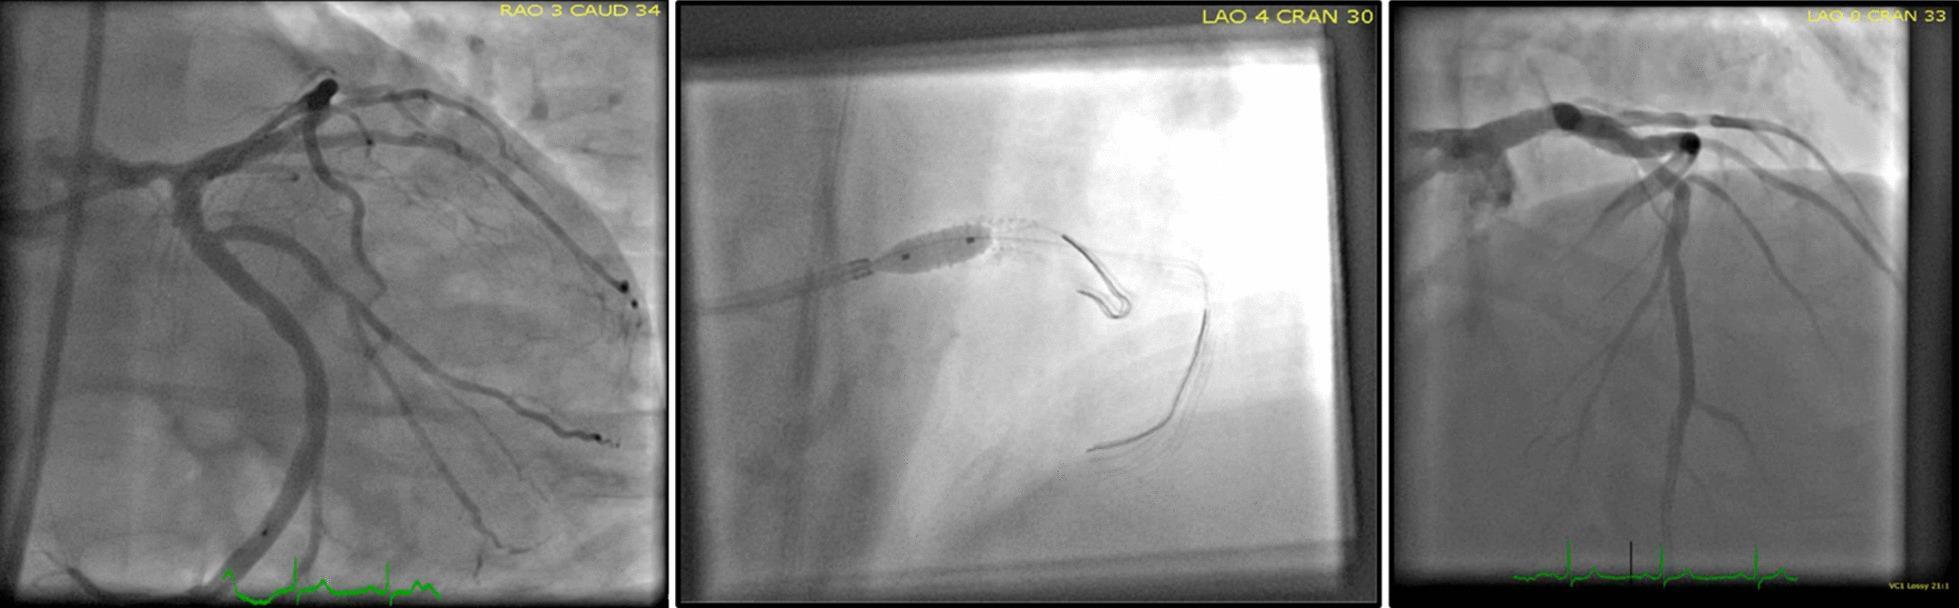
This composite of three diagnostic fluoroscopic images illustrates a percutaneous coronary intervention (PCI) procedure, specifically demonstrating Left Main (LM) coronary artery stenting using the kissing balloon technique. The left panel shows a coronary angiogram in an RAO Caudal projection (spider view), providing clear visualization of the distal left main bifurcation into the left anterior descending (LAD) and circumflex (LCx) arteries with contrast enhancement. The central panel captures the interventional phase in an LAO Cranial projection, showing a catheter-delivered angioplasty balloon inflated at the bifurcation site; the balloon is identifiable by distinct radiopaque markers, with a distal guidewire curving beyond the tip. The right panel displays the post-stent result in an LAO Cranial projection, demonstrating restored vessel patency and the structural deployment of the stent. These images serve as an educational resource for interventional cardiology, highlighting procedural steps for complex bifurcation lesions and coronary anatomy visualization.
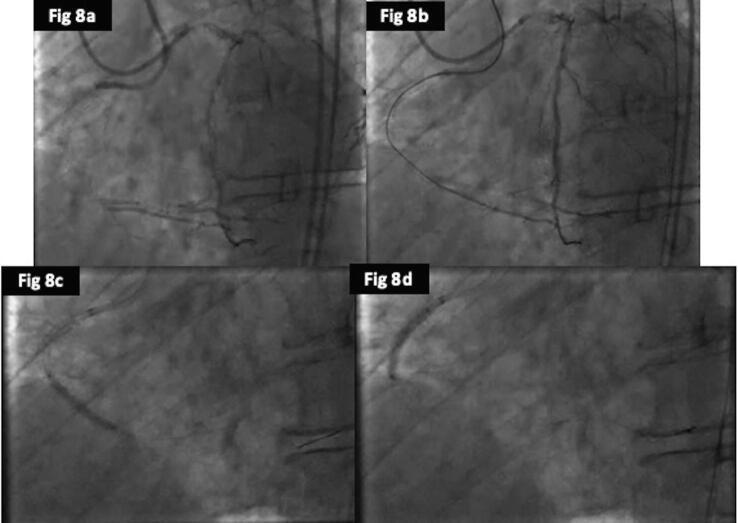
This composite of diagnostic images contains four panels (Fig 8a-d) showing a percutaneous coronary intervention (PCI) procedure for in-stent restenosis (ISR). Panel 8a is a coronary angiogram of the right coronary artery (RCA) displaying a complete occlusion within a previously placed proximal stent. Retrograde collateral vessels are visible, arising from the left coronary artery to supply the distal RCA. Panel 8b illustrates the successful antegrade advancement of a guidewire across the occluded segment into the distal vessel, confirmed via contralateral injection. Panels 8c and 8d demonstrate the therapeutic phase of the procedure, featuring predilatation of the occluded stented segment using non-compliant balloons. The balloons are seen fully inflated across the lesion site to restore luminal patency before further definitive treatment. This series provides a clinical example of managing complex chronic total occlusions within previously stented segments using antegrade techniques and high-pressure balloon angioplasty.
Percutaneous Coronary Intervention (PCI)
What is PCI?
- Harrison's Principles of Internal Medicine 22E, p.2148
Types of PCI
| Type | Description |
|---|---|
| Primary PCI | Done emergently for STEMI without prior fibrinolysis - the gold standard reperfusion strategy |
| Elective / Scheduled PCI | For stable angina or significant coronary stenosis identified on angiography |
| Rescue PCI | Done after failed fibrinolysis (persistent pain + ST elevation >90 min) |
| Facilitated PCI | PCI performed after pharmacologic therapy (GPI or lytics) as a bridge - largely abandoned |
| Staged PCI | Treating non-culprit vessels in a separate session after primary PCI for STEMI |
Step-by-Step Procedure
1. Vascular Access
- Radial artery (preferred - lower bleeding risk, earlier ambulation)
- Femoral artery (alternative - used in complex anatomy or hemodynamic instability)
- A sheath (5-8 Fr) is inserted via modified Seldinger technique
2. Guide Catheter Placement
- A guide catheter is advanced through the aorta to the ostium of the target coronary artery (left or right)
- Coronary angiography is performed with contrast to identify and characterize the lesion
3. Guidewire Crossing
- A thin coronary guidewire (0.014 inch) is carefully advanced across the stenosis or occlusion
- This wire acts as a "rail" for subsequent devices
4. Balloon Predilatation (optional)
- A balloon catheter is advanced over the wire and inflated at the lesion site
- Compresses the plaque and prepares the vessel for stent delivery
5. Stent Deployment
- A stent (crimped on a balloon catheter) is advanced to the lesion and inflated
- The balloon expands the stent against the vessel wall, restoring the lumen
6. Post-dilatation (if needed)
- A high-pressure non-compliant balloon inflated inside the deployed stent ensures full apposition
7. Final Angiography
- Confirms TIMI 3 flow (full restoration of blood flow), no dissection, no residual stenosis
Types of Stents
| Stent Type | Details |
|---|---|
| Bare Metal Stent (BMS) | First generation; higher restenosis rate (due to neointimal hyperplasia); DAPT for 1 month |
| Drug-Eluting Stent (DES) | Current standard of care; coated with sirolimus/paclitaxel derivatives to inhibit smooth muscle cell proliferation; restenosis rate <5%; DAPT for 12 months |
| Bioresorbable Vascular Scaffold (BVS) | Absorbable stent; less used currently due to higher thrombosis rates |
Indications for PCI
- STEMI: Primary reperfusion of choice (FMC-to-wire ≤90 min)
- NSTEMI/UA: High-risk patients with elevated troponins, dynamic ECG changes, ongoing ischemia
- Stable IHD: Significant stenosis (>70%) causing ischemia on stress testing, refractory to optimal medical therapy
- One or two-vessel disease: PCI preferred over CABG
- Selected three-vessel disease: PCI may be appropriate in certain anatomies (SYNTAX score-guided)
When CABG is Preferred Over PCI
| Situation | Reason |
|---|---|
| Left main coronary artery disease | High-risk anatomy; CABG provides more complete revascularization |
| Three-vessel disease + diabetes | CABG shows superior long-term outcomes (FREEDOM trial) |
| Three-vessel disease + reduced EF | CABG offers survival benefit |
| Vessels unsuitable for stenting | Heavily calcified, tortuous, or diffusely diseased vessels |
| Failed PCI / complications | Surgical bailout |
- Harrison's, p.2148
Pre-Procedure Medications
| Drug | Purpose |
|---|---|
| Aspirin 325 mg | Antiplatelet - given before PCI |
| P2Y12 inhibitor (ticagrelor or prasugrel preferred; clopidogrel alternative) | Dual antiplatelet - loading dose before or at time of PCI |
| UFH or bivalirudin | Anticoagulation during the procedure |
| GP IIb/IIIa inhibitors | (abciximab, eptifibatide) - for high thrombus burden or thrombotic complications |
Post-PCI Management
| Item | Detail |
|---|---|
| DAPT (Dual Antiplatelet Therapy) | Aspirin + ticagrelor/clopidogrel for ≥12 months after DES in ACS; 6 months in stable disease |
| Statin | High-intensity (atorvastatin 40-80 mg) - continue lifelong |
| Beta-blocker | Continue if reduced EF or post-MI |
| ACE inhibitor/ARB | Continue if reduced EF, hypertension, or diabetes |
| Access site care | Radial band (if radial) or compression + bed rest (if femoral) |
| Renal monitoring | Contrast nephropathy - hydration, avoid NSAIDs post-procedure |
Complications of PCI
| Complication | Notes |
|---|---|
| In-stent restenosis | Neointimal hyperplasia; <5% with DES; treated with repeat PCI (drug-coated balloon) |
| Stent thrombosis | Rare but life-threatening; early (≤30 days) or late (>30 days); risk rises with premature DAPT cessation |
| Coronary dissection | May require additional stenting |
| No-reflow / slow-flow | Microvascular embolization; treat with adenosine/verapamil IC |
| Contrast nephropathy | Pre-hydrate; minimize contrast volume |
| Vascular access complications | Hematoma, pseudoaneurysm, AV fistula (femoral > radial) |
| Perforation | Rare; may cause tamponade - needs pericardiocentesis or surgery |
| Radiation exposure | Minimized by fluoroscopy time reduction |
Key Time Targets (Primary PCI for STEMI)
| Scenario | Target |
|---|---|
| Direct presentation to PCI center | FMC-to-wire ≤90 min |
| Transfer from non-PCI center | FMC-to-wire ≤120 min |
| At PCI center, door-to-balloon | ≤60 min |
| If fibrinolysis given first, angiography | 3-24 hours later |
Adjunctive Tools Used During PCI
| Tool | Use |
|---|---|
| IVUS (Intravascular Ultrasound) | Assess plaque, optimize stent sizing and apposition |
| OCT (Optical Coherence Tomography) | High-resolution plaque characterization |
| FFR/iFR (Fractional Flow Reserve) | Assess hemodynamic significance of intermediate lesions |
| Rotablation / Atherectomy | Calcified lesions unamenable to balloon dilatation |
| Thrombectomy | Aspiration of large thrombus in STEMI |
What are the differences between CABG and PCI for multivessel disease?
"coronary artery bypass"[MeSH Terms] AND "percutaneous coronary intervention"[MeSH Terms] AND "multivessel"
PMID: 40174598
PMID: 40072460
CABG versus PCI comparison multivessel coronary artery disease outcomes diagram
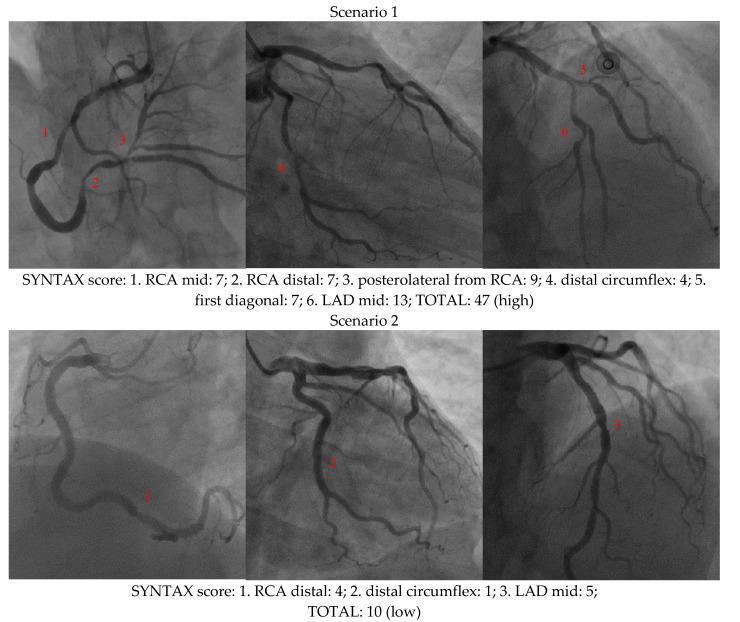
Diagnostic coronary angiography images comparing two clinical scenarios of coronary artery disease. The image is structured into two horizontal rows, each containing three angiographic views (likely RAO/LAO cranial and caudal projections) to visualize the Right Coronary Artery (RCA), Left Anterior Descending (LAD) artery, and Circumflex (LCx) artery. Scenario 1 (top row) demonstrates high-complexity multivessel disease with a total SYNTAX score of 47. Labeled lesions include the mid-RCA, distal RCA, posterolateral branch, distal circumflex, first diagonal, and mid-LAD, showing varying degrees of stenosis and vessel involvement. Scenario 2 (bottom row) illustrates low-complexity disease with a total SYNTAX score of 10, highlighting fewer and less severe lesions in the distal RCA, distal circumflex, and mid-LAD. These comparison images serve as an educational tool for cardiologists to understand coronary lesion scoring based on anatomical location, severity, and complexity to guide revascularization strategies (PCI vs. CABG).

Summary : This image presents a clinical recommendation table for DAPT (dual antiplatelet therapy) adherence in patients with multivessel coronary artery disease (CAD), comparing PCI (percutaneous coronary intervention) and CABG (coronary artery bypass grafting). table: # Recommendation Table for DAPT Adherence : ## Columns : • COR (Class of Recommendation): 2a (yellow background) • LOE (Level of Evidence): B-NR (blue background) • RECOMMENDATION: Textual clinical recommendation ## Recommendation Text : • "In patients with multivessel CAD amenable to treatment with either PCI or CABG who are unable to access, tolerate, or adhere to DAPT for the appropriate duration of treatment, CABG is reasonable in preference to PCI (1-10)." ## Supplementary Information : • Referenced studies supporting the recommendation are summarized in "Online Data Supplement 16." Analysis : • The table provides a specific clinical recommendation (Class 2a, Level B-NR) suggesting CABG over PCI for patients with multivessel CAD who cannot adhere to DAPT, with supporting references available in an online supplement. The structure is typical for guideline tables, with clear separation of recommendation strength, evidence level, and clinical context.
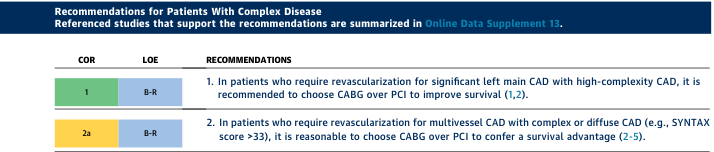
Summary : This table presents recommendations for patients with complex coronary artery disease (CAD) who require revascularization, comparing coronary artery bypass grafting (CABG) and percutaneous coronary intervention (PCI) based on disease complexity and supporting evidence. table: # Columns : • COR (Class of Recommendation): 1 (green), 2a (yellow) • LOE (Level of Evidence): B-R (randomized) • RECOMMENDATIONS: Detailed clinical guidance for each scenario # Rows : • Row 1: – COR: 1 (green) – LOE: B-R – Recommendation: In patients who require revascularization for significant left main CAD with high-complexity CAD, it is recommended to choose CABG over PCI to improve survival (references 1,2). • Row 2: – COR: 2a (yellow) – LOE: B-R – Recommendation: In patients who require revascularization for multivessel CAD with complex or diffuse CAD (e.g., SYNTAX score >33), it is reasonable to choose CABG over PCI to confer a survival advantage (references 2-5). # Design Encodings : • COR is color-coded: green for 1, yellow for 2a. • LOE is consistently B-R (randomized evidence). • Recommendations are text-based, with reference numbers in parentheses. # Analysis : • The table prioritizes CABG over PCI for patients with high-complexity or multivessel CAD, especially when left main disease or high SYNTAX scores are present. • Stronger recommendation (Class 1) is given for left main CAD with high complexity, while a reasonable (Class 2a) recommendation is given for multivessel or diffuse CAD. • Both recommendations are supported by randomized evidence (B-R).
CABG vs PCI for Multivessel Coronary Artery Disease
Overview
Head-to-Head Comparison
| Feature | PCI | CABG |
|---|---|---|
| Approach | Catheter-based, percutaneous | Open-heart surgery with cardiopulmonary bypass |
| Invasiveness | Minimally invasive | Major surgery |
| Recovery time | Hours to days | 4-6 weeks |
| Procedural mortality | 0.5-1% | 1-3% (higher baseline risk) |
| Stroke risk | Lower (~0.5-1%) | Higher (~1.5-2%) |
| Completeness of revascularization | Incomplete in complex/diffuse disease | More complete (bypasses segments, not just focal stenoses) |
| Repeat revascularization | Higher (10-16% at 5 years) | Lower (7-8% at 5 years) |
| MI risk long-term | Higher | Lower |
| Survival (simple 1-2 vessel disease) | Equivalent to CABG | Equivalent to PCI |
| Survival (complex multivessel / LM) | Inferior in high SYNTAX score | Superior |
| Survival (3-vessel + diabetes) | Inferior | Superior (FREEDOM trial) |
| DAPT requirement | 6-12 months minimum | Not required (aspirin alone) |
| Graft/stent durability | DES: >5 years; in-stent restenosis <5% | IMA graft: >90% patent at 10 years |
The SYNTAX Score - The Key Anatomical Guide
| SYNTAX Score | Coronary Complexity | Preferred Strategy |
|---|---|---|
| Low (<23) | Simple/limited disease | PCI acceptable; similar outcomes to CABG |
| Intermediate (23-32) | Moderate complexity | Heart team discussion; CABG often preferred |
| High (≥33) | Complex/diffuse disease | CABG preferred - survival advantage |
ACC/AHA Guideline Recommendations
| Clinical Scenario | Recommendation | Class / LOE |
|---|---|---|
| Left main CAD + high-complexity disease | CABG over PCI to improve survival | Class I / B-R |
| Multivessel CAD + SYNTAX score >33 | CABG over PCI - survival advantage | Class IIa / B-R |
| Unable to tolerate/adhere to DAPT | CABG over PCI - reasonable | Class IIa / B-NR |
| ACS / STEMI (acute setting) | PCI preferred as initial strategy | Class I |
| STEMI with failed PCI or residual ischemia | CABG as rescue | Class I |
- Goldman-Cecil Medicine, p.653
Special Populations
Diabetes + Multivessel Disease
- At 3 years, CABG had fewer MACCE than FFR-guided PCI in patients with diabetes (HR 1.44; 95% CI 0.91-2.28) - though not statistically significant
- In patients with SYNTAX score ≥23, PCI had higher MACCE than CABG regardless of diabetes status
- At low SYNTAX score (<23), no significant difference between PCI and CABG even in diabetics
The older teaching that "diabetes = always CABG" is now more nuanced: SYNTAX score matters more than diabetes status alone.
Reduced LV Function (EF <35%)
- CABG is preferred - provides complete revascularization and improves survival in hibernating myocardium
- The STICH trial confirmed CABG survival benefit over medical therapy in ischemic cardiomyopathy
Left Main Disease
- High complexity (extensive additional disease): CABG strongly preferred (Class I)
- Low complexity (isolated LM or LM + limited disease): PCI is a reasonable alternative; lower stroke risk with PCI but higher repeat revascularization
- Goldman-Cecil, p.524
FAME 3 Trial - Most Recent 5-Year Data (Lancet, 2025)
| Outcome at 5 years | PCI | CABG | HR (95% CI) |
|---|---|---|---|
| Death + stroke + MI (composite) | 16% | 14% | 1.16 (0.89-1.52), p=0.27 (NS) |
| Death | 7% | 7% | 0.99 (0.67-1.46) |
| Stroke | 2% | 3% | 0.65 (0.33-1.28) |
| MI | 8% | 5% | 1.57 (1.04-2.36) ↑ PCI |
| Repeat revascularization | 16% | 8% | 2.02 (1.46-2.79) ↑ PCI |
Why CABG Has a Biological Advantage in Complex Disease
- Internal thoracic artery (ITA/IMA) grafts bypass the diseased segment and tap into a healthy arterial conduit - superior patency (>90% at 10 years) vs saphenous vein grafts or stents
- Bypasses the entire diseased segment - not just the focal stenosis, protecting against future plaque rupture in the same vessel
- Complete revascularization of all major territories in a single procedure
- In complex/diffuse disease, there may be lesions too distal, too calcified, or too tortuous for stenting - CABG can reach them
Why PCI May Be Preferred in Certain Patients
- High surgical risk (poor candidate for general anesthesia, frailty, severe COPD)
- Prior CABG with patent IMA graft (re-do CABG is high risk; PCI of vein graft or native vessel is safer)
- Patient refusal of surgery
- Acute coronary syndrome / STEMI (speed of reperfusion)
- Limited disease (1-2 vessel, low SYNTAX score)
- No DAPT contraindication
Heart Team Decision-Making
- SYNTAX score ≥22
- Left main disease
- Reduced EF
- Diabetic patients with 3-vessel disease
Summary Decision Framework
Multivessel Disease
├── ACS / STEMI → PCI (primary reperfusion)
├── Stable + Low SYNTAX (<23) → PCI or CABG (equivalent)
├── Stable + Intermediate SYNTAX (23-32) → Heart Team; lean CABG
├── Stable + High SYNTAX (≥33) → CABG preferred
├── Left main + high complexity → CABG (Class I)
├── Left main + low complexity → PCI acceptable
├── 3-vessel + Diabetes + SYNTAX ≥23 → CABG preferred
├── Reduced EF (<35%) → CABG preferred
└── Cannot tolerate DAPT → CABG preferred
12 lead ecg
12 lead ECG electrode placement chest limb leads diagram
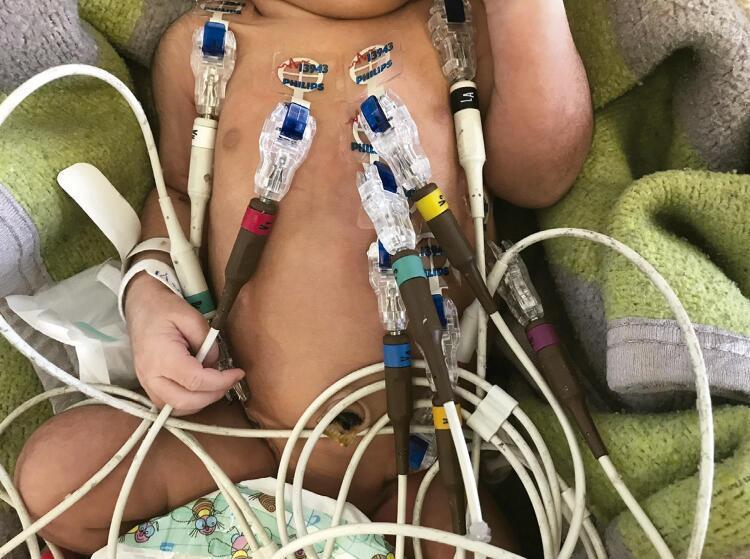
A clinical photograph illustrating the standardized placement of a 12-lead electrocardiogram (ECG) on a neonate. The image shows several electrodes secured to the newborn's skin using clear adhesive gel tabs (Philips brand). The electrode distribution follows neonatology guidelines to minimize motion artifacts: the four limb leads are positioned on the right and left shoulders and the right and left iliac crests, rather than the distal extremities. The precordial leads (V1-V6) are arranged across the anterior chest wall. Each electrode consists of a transparent plastic clip housing, a tapered brown connector with color-coded bands (including red, yellow, green, blue, and purple) for lead identification, and white cabling. The clinical context demonstrates the procedural adaptations required for neonatal cardiac monitoring, such as using torso placement for limb leads to improve signal-to-noise ratio in active infants.
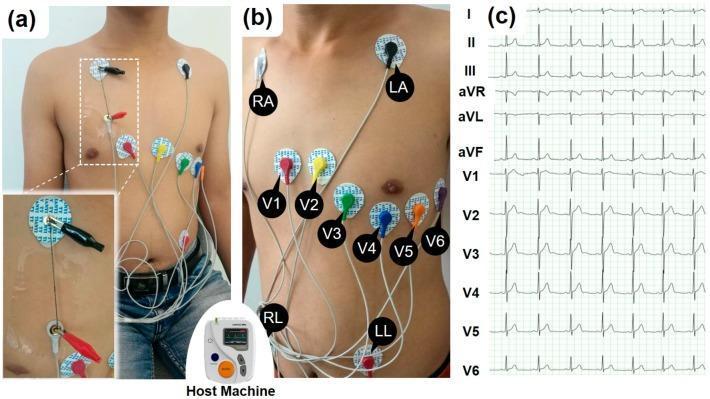
This composite educational graphic illustrates the procedural setup and resulting data for a standard 12-lead electrocardiogram (ECG/EKG). Panels (a) and (b) are clinical photographs demonstrating correct electrode placement on a male torso. The limb leads are positioned as RA (right arm/shoulder) and LA (left arm/shoulder) on the upper chest, with RL (right leg) and LL (left leg) on the lower abdomen. The precordial leads (V1-V6) follow the standard anatomical arc across the chest: V1 and V2 at the fourth intercostal space (right and left of the sternum), V4 at the fifth intercostal space (mid-clavicular line), and V3, V5, and V6 completing the transverse sequence toward the left axilla. Panel (a) includes an inset showing the experimental use of conductive carbon nanotube yarns (SWNT-CYs) connected via alligator clips to the electrodes. Panel (c) displays the resulting 12-lead ECG waveforms on a standard grid, labeled I, II, III, aVR, aVL, aVF, and V1-V6. Each lead shows distinct P-waves, QRS complexes, and T-waves, representing different electrical vectors of cardiac depolarization and repolarization.
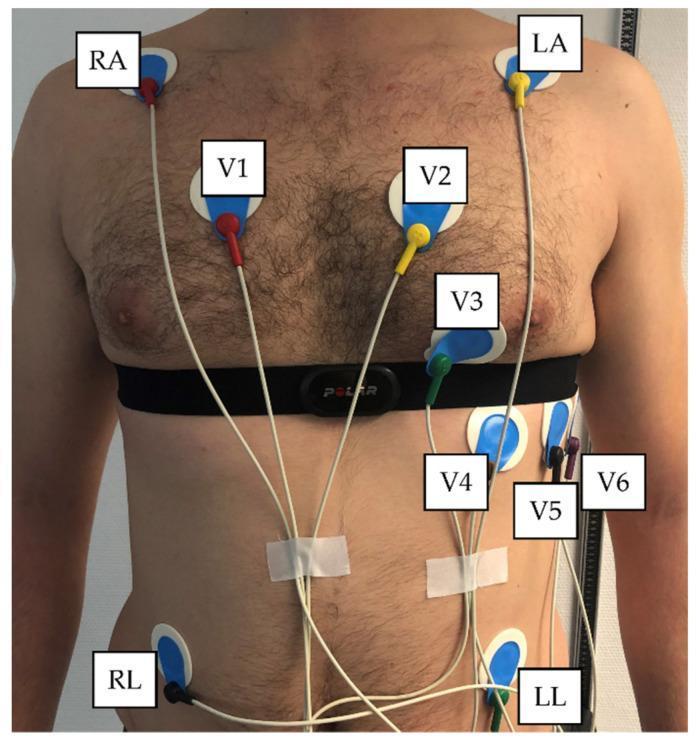
This procedural clinical photograph demonstrates the concurrent placement of a standard 12-lead electrocardiogram (ECG) and a Polar H10 heart rate sensor chest strap on a male subject. The image illustrates proper anatomical positioning for clinical and exercise physiology monitoring. The six precordial leads (V1-V6) are visible across the chest: V1 (4th intercostal space, right sternal border), V2 (4th intercostal space, left sternal border), V3 (midway between V2 and V4), V4 (5th intercostal space, mid-clavicular line), V5 (anterior axillary line), and V6 (mid-axillary line). The leads utilize standard color-coding (Red, Yellow, Green, Brown, Black, Violet). Limb leads are positioned at the shoulders (RA/LA) and the lower ribcage/abdominal area (RL/LL) to facilitate movement during testing. The Polar H10 chest strap is situated inferior to the pectoral muscles, intersecting the mid-precordial electrode line. This visual serves as an educational reference for electrode application in comparative heart rate variability (HRV) studies, highlighting the spatial relationship between traditional medical grade ECG sensors and wearable consumer fitness technology.
normal ECG waveform P wave QRS T wave labeled diagram
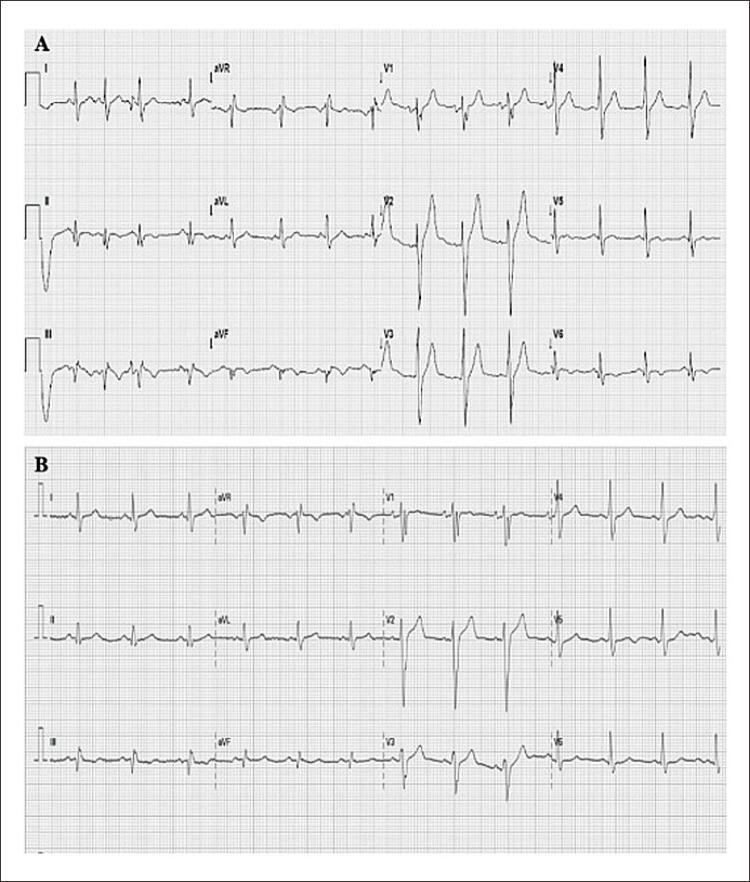
This diagnostic image displays two 12-lead electrocardiograms (ECGs) labeled Panel A and Panel B, presented on standard grid paper for clinical comparison. Panel A shows a 12-lead ECG demonstrating sinus rhythm with normal P-wave morphology. The QRS complexes exhibit nonspecific intraventricular conduction disturbances, characterized by widened or slurred morphologies in certain leads, notably the precordial leads V1-V6. Panel B shows a subsequent ECG from the same patient. Comparison between the two panels reveals subtle variations in waveform amplitude and ST-segment baseline, though both lack overt ST-segment elevation. The precordial leads (V1-V6) show a typical progression of R-wave amplitude, while lead aVR shows the expected global inversion of P, QRS, and T waves. This comparison is used in cardiology to monitor electrical changes during acute coronary syndromes, such as Non-ST Segment Elevation Myocardial Infarction (NSTEMI), where conduction disturbances may be present despite the absence of classic ST-elevation.
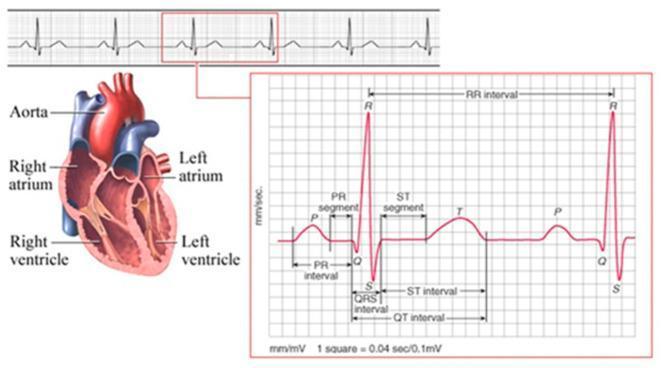
This composite educational illustration combines an anatomical diagram of the human heart with a diagnostic Electrocardiogram (ECG) tracing to demonstrate cardiac physiology. On the left, a coronal cross-section of the heart identifies the Aorta, Right Atrium, Left Atrium, Right Ventricle, and Left Ventricle. The right side features a detailed ECG waveform analysis set against a standard measurement grid (1 square = 0.04 sec / 0.1 mV). The tracing identifies key electrophysiological components: the P wave (atrial depolarization), QRS complex (ventricular depolarization), and T wave (ventricular repolarization). Critical diagnostic intervals and segments are explicitly labeled, including the PR interval, PR segment, QRS interval, ST segment, ST interval, QT interval, and the RR interval (representing the heart rate). This comparison chart and pathophysiology diagram serve as an introductory resource for understanding the correlation between cardiac anatomy and the electrical signals recorded during a cardiac cycle, suitable for basic to intermediate medical education.
ECG leads territory coronary artery inferior anterior lateral STEMI localization
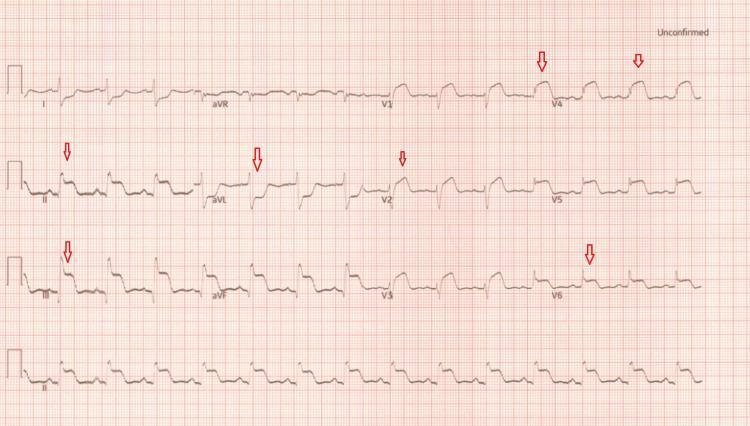
This diagnostic image is a 12-lead electrocardiogram (ECG) demonstrating acute ST-segment elevation myocardial infarction (STEMI). The tracing reveals a sinus rhythm with significant ST-segment elevation in the inferior leads (II, III, and aVF) and the anterior precordial leads (V1 through V4), highlighted by red arrows. Notably, there is reciprocal ST-segment depression in the high lateral leads (I and aVL). The anterolateral leads (V5 and V6) show T-wave inversions. These findings indicate widespread myocardial ischemia or injury involving multiple vascular territories, specifically the inferior and anterior walls. The clinical significance of this ECG suggests acute occlusion of major coronary arteries, such as the right coronary artery (RCA) and left anterior descending (LAD) artery, requiring urgent intervention. This visual is an educational example of multi-territory STEMI and the identification of reciprocal changes in a clinical cardiology context.
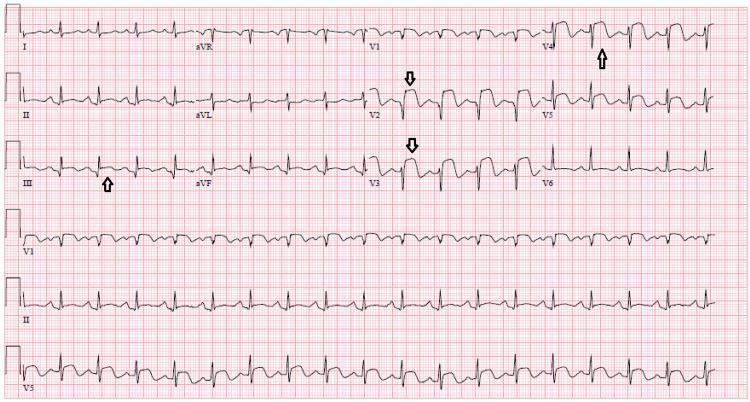
This diagnostic image is a 12-lead electrocardiogram (ECG) demonstrating signs of an acute ST-elevation myocardial infarction (STEMI). The tracing reveals significant ST-segment elevation in the anterior leads (V1-V4) and inferior leads (II, III, and aVF), with black arrows highlighting specific areas of elevation. In lead V2 and V3, the ST-segment shows an upward-sloping, concave morphology, while lead V4 displays a more pronounced, 'tombstone' appearance merging into hyperacute T-waves. Reciprocal ST-segment depression is visible in the lateral leads, specifically I and aVL. The rhythm is sinus, and the heart rate is approximately 75-80 beats per minute. The ECG is clinically significant for multi-territory ischemia, correlating with proximal left anterior descending (LAD) artery occlusion and multi-vessel coronary artery disease. This visual is an essential educational resource for medical students and clinicians for identifying acute coronary syndromes and understanding the distribution of myocardial injury across various cardiac walls.
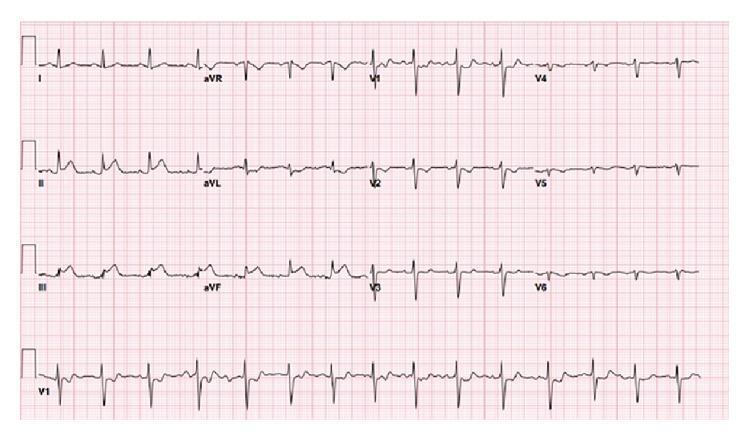
This diagnostic image is a 12-lead electrocardiogram (ECG) demonstrating an acute inferior ST-elevation myocardial infarction (STEMI). The tracing reveals significant convex ST-segment elevation in the inferior leads (II, III, and aVF), characteristic of an injury pattern often involving the right coronary artery or left circumflex artery. Accompanying these findings are prominent reciprocal ST-segment depressions in the anterior precordial leads (V1 through V6) and high lateral lead aVL. The rhythm appears to be a normal sinus rhythm with a regular rate. No significant ST-segment deviations are noted in leads I and aVR. This ECG serves as a classic educational example of an inferior STEMI with reciprocal changes, illustrating the electrical changes associated with acute transmural myocardial ischemia in the inferior wall of the heart.
The 12-Lead ECG - Complete Guide
What is a 12-Lead ECG?
- Goldman-Cecil Medicine, p.511
The ECG Paper
- Each small box = 0.04 seconds (horizontal) and 0.1 mV (vertical)
- Each large box = 0.20 seconds (5 small boxes)
- Standard paper speed = 25 mm/sec
- Standard calibration = 10 mm = 1 mV
The 10 Electrodes - Placement
Limb Electrodes (4)
| Electrode | Placement |
|---|---|
| RA | Right arm (or right shoulder) |
| LA | Left arm (or left shoulder) |
| RL | Right leg - electrical ground only |
| LL | Left leg |
Precordial (Chest) Electrodes (6)
| Lead | Anatomical Position |
|---|---|
| V1 | 4th intercostal space, right sternal border |
| V2 | 4th intercostal space, left sternal border |
| V3 | Midway between V2 and V4 |
| V4 | 5th intercostal space, midclavicular line |
| V5 | Anterior axillary line (same level as V4) |
| V6 | Midaxillary line (same level as V4-V5) |
The 12 Leads - What They Look At
Frontal Plane Leads (Limb Leads)
| Lead | View of Heart | Positive Pole |
|---|---|---|
| I | Lateral wall | Left arm (+) vs Right arm (-) |
| II | Inferior wall | Left leg (+) vs Right arm (-) |
| III | Inferior wall | Left leg (+) vs Left arm (-) |
| aVR | Cavity/right | Right arm (augmented) |
| aVL | High lateral wall | Left arm (augmented) |
| aVF | Inferior wall | Left leg (augmented) |
Horizontal Plane Leads (Precordial / Chest Leads)
| Lead | View of Heart |
|---|---|
| V1-V2 | Septal wall (right ventricle) |
| V3-V4 | Anterior wall (LAD territory) |
| V5-V6 | Lateral wall (LCx territory) |
- Goldman-Cecil Medicine, p.630
The Normal ECG Waveform
Each Wave and What It Represents
| Component | Electrical Event | Normal Duration/Value |
|---|---|---|
| P wave | Atrial depolarization (SA node → atrial muscle) | <120 ms; <2.5 mm tall |
| PR interval | Atrial depol. + AV node conduction delay + His-Purkinje | 120-200 ms (3-5 small boxes) |
| QRS complex | Ventricular depolarization | <120 ms (<3 small boxes) |
| ST segment | Early ventricular repolarization (isoelectric) | At baseline; no elevation/depression |
| T wave | Ventricular repolarization | Upright in most leads; asymmetric |
| QT interval | Total ventricular electrical activity (depol + repol) | Corrected QTc: <450 ms (men), <460 ms (women) |
| U wave | Repolarization of Purkinje fibers (or papillary muscles) | Small, same direction as T wave |
- Goldman-Cecil Medicine, p.533-628; Costanzo Physiology 7E, p.4499
Key Notes on the QT Interval
- Must be rate-corrected (QTc) using Bazett's formula: QTc = QT ÷ √RR
- Prolonged QTc → risk of Torsades de Pointes (life-threatening VT)
- Causes of long QT: drugs (antiarrhythmics, antipsychotics, macrolides), hypokalemia, hypomagnesemia, congenital syndromes
Calculating Heart Rate from ECG
300 ÷ number of large boxes between two R waves
1500 ÷ number of small boxes between two R waves
Count QRS complexes in a 10-second strip × 6
| Rate | Interpretation |
|---|---|
| 60-100 bpm | Normal sinus rhythm |
| <60 bpm | Bradycardia |
| >100 bpm | Tachycardia |
Normal Axis and Axis Deviation
| Axis | Range | Meaning |
|---|---|---|
| Normal | -30° to +90° | Normal |
| Left axis deviation (LAD) | -30° to -90° | Left anterior fascicular block, inferior MI, LVH |
| Right axis deviation (RAD) | +90° to +180° | RVH, lateral MI, PE, Lposterior fascicular block |
| Extreme/indeterminate | -90° to +/-180° | Ventricular tachycardia, dextrocardia |
- Lead I positive + aVF positive → Normal axis
- Lead I positive + aVF negative → LAD
- Lead I negative + aVF positive → RAD
ECG Localization of MI - Which Leads, Which Artery
| Territory | Leads with Changes | Culprit Artery |
|---|---|---|
| Anterior | V1-V4 | LAD (Left Anterior Descending) |
| Anteroseptal | V1-V2 | Proximal LAD/septal perforators |
| Anterolateral | V1-V6, I, aVL | Proximal LAD |
| Lateral | I, aVL, V5-V6 | LCx (Left Circumflex) or Diagonal |
| Inferior | II, III, aVF | RCA (Right Coronary Artery) - 80%; LCx - 20% |
| Posterior | Tall R in V1-V2, ST depression V1-V3 | RCA or LCx |
| Right ventricle | V3R-V4R (right-sided leads) | Proximal RCA |
Common ECG Abnormalities - Quick Reference
Rate/Rhythm
| Finding | Diagnosis |
|---|---|
| Regular P waves, rate 60-100, normal PR | Normal sinus rhythm |
| No P waves, irregularly irregular QRS | Atrial fibrillation |
| Sawtooth flutter waves (~300 bpm), regular 2:1 or 3:1 conduction | Atrial flutter |
| Narrow QRS tachycardia, P before QRS | SVT (AVNRT/AVRT) |
| Wide QRS tachycardia, no P waves | Ventricular tachycardia |
Conduction
| Finding | Diagnosis |
|---|---|
| PR interval >200 ms | 1st degree AV block |
| Progressive PR lengthening → dropped QRS | 2nd degree AV block (Mobitz I / Wenckebach) |
| Fixed PR, sudden dropped QRS | 2nd degree AV block (Mobitz II) |
| No relationship between P and QRS | Complete (3rd degree) AV block |
| Wide QRS (>120ms), RSR' in V1, wide S in V6 | RBBB |
| Wide QRS (>120ms), broad R in I, aVL, V5-V6; QS in V1 | LBBB |
Ischemia / Infarction
| ECG Finding | Meaning |
|---|---|
| Hyperacute tall T waves | Earliest sign of STEMI (minutes) |
| ST elevation ≥1 mm in ≥2 contiguous leads | STEMI |
| ST depression, T-wave inversion | NSTEMI / Unstable angina |
| Pathological Q waves (>40ms wide, >25% QRS height) | Old/completed MI (necrosis) |
| New LBBB in chest pain setting | Treat as STEMI equivalent |
Hypertrophy
| Finding | Diagnosis |
|---|---|
| P wave >120 ms (bifid), "P mitrale" in lead II | Left atrial enlargement |
| Tall peaked P in II (>2.5 mm), "P pulmonale" | Right atrial enlargement |
| S in V1 + R in V5 or V6 > 35 mm (Sokolow-Lyon) | Left ventricular hypertrophy (LVH) |
| Tall R in V1-V2, RAD, right strain pattern | Right ventricular hypertrophy (RVH) |
Systematic Approach to Reading Any ECG
- Rate - calculate from R-R interval
- Rhythm - regular/irregular? P before every QRS?
- Axis - look at leads I and aVF
- P waves - morphology, duration, axis
- PR interval - normal 120-200 ms?
- QRS - duration, morphology, R wave progression (V1→V6)
- ST segment - elevation or depression? Which leads?
- T waves - upright, inverted, hyperacute?
- QT interval - calculate QTc
- U waves - present? (look in V2-V3)