
Anemia and its classification
anemia classification diagram types
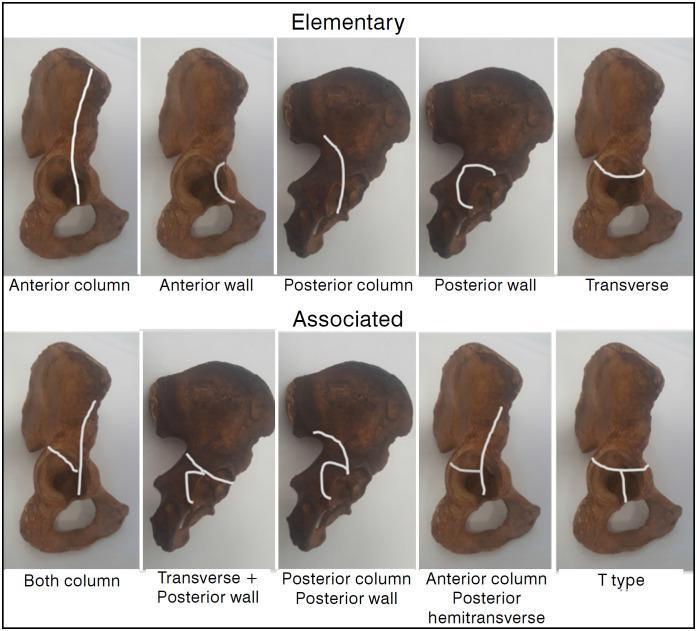
Educational diagram illustrating the Judet-Letournel classification of acetabular fractures using anatomical specimens of the hemipelvis. The visual is divided into two rows: 'Elementary' and 'Associated' fracture types. White lines superimposed on the specimens delineate specific fracture patterns. The 'Elementary' row features five simple patterns: Anterior column (vertical line through the pelvic brim), Anterior wall (localized articular segment), Posterior column (ischiadic notch through obturator foramen), Posterior wall (localized posterior rim), and Transverse (horizontal line bisecting the acetabulum). The 'Associated' row demonstrates complex configurations: Both column, Transverse plus posterior wall, Posterior column plus posterior wall, Anterior column with posterior hemitransverse (a vertical anterior column line joined by a horizontal posterior component), and T-type (a transverse fracture with an additional vertical stem extending through the obturator foramen). This orthopedic diagram serves as a clinical reference for orthopedic surgeons and medical students to understand pelvic trauma morphology and surgical planning.
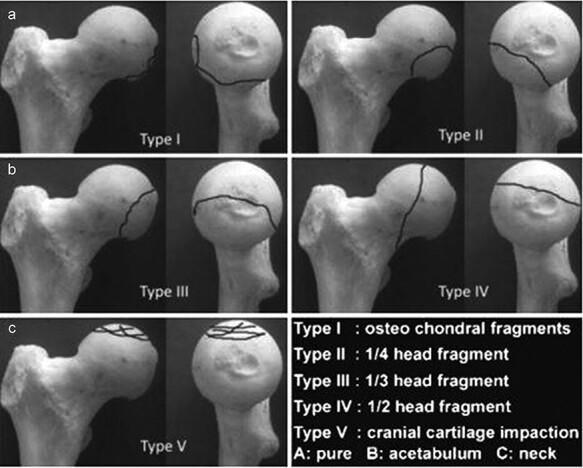
This orthopaedic anatomical diagram illustrates the Chiron classification (2004) for femoral head fractures, shown across five categorized types (Type I to Type V). Each type is presented using a dry bone model of the proximal femur from two perspectives: a lateral/oblique view and a frontal view of the femoral head. Fracture lines are demarcated by solid black lines to indicate the morphology and size of the fracture fragments. Type I displays small osteochondral fragments at the superior-lateral aspect. Type II shows a 1/4 head fragment on the anterior-superior surface. Type III demonstrates a 1/3 head fragment extending from superior to posterior. Type IV depicts a vertical fracture dividing approximately 1/2 of the femoral head. Type V illustrates cranial cartilage impaction with multiple intersecting lines across the superior articular surface. The classification is clinically relevant for orthopedic surgeons and residents for determining the severity of femoral head trauma and informing surgical decisions, such as fragment fixation versus excision based on size and location.
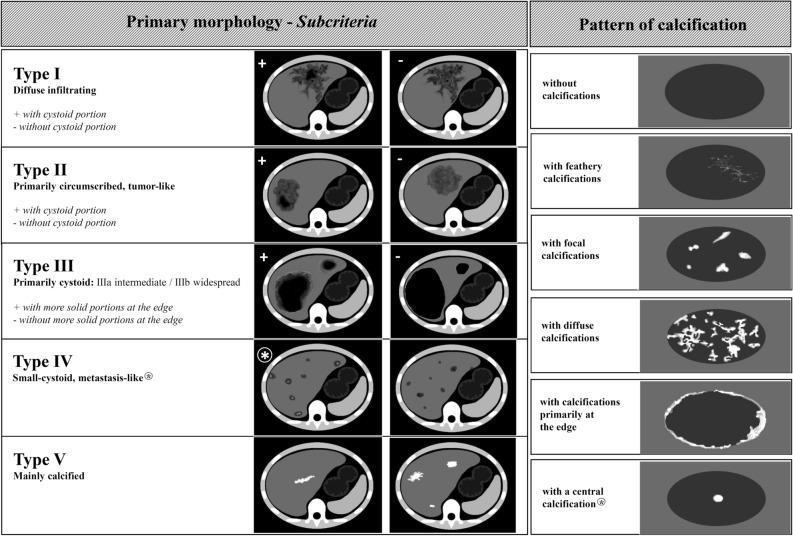
This educational infographic details the Echinococcus multilocularis Ulm Classification for Computed Tomography (EMUC-CT), a standardized system for evaluating hepatic Alveolar Echinococcosis (AE). The diagram is divided into two sections: Primary Morphology and Patterns of Calcification. The left section illustrates five morphological types (I-V) using axial CT cross-sections of the liver. Type I (diffuse infiltrating) and Type II (primarily circumscribed, tumor-like) are sub-categorized by the presence or absence of a cystoid portion. Type III (primarily cystoid) distinguishes between intermediate and widespread involvement, further categorized by solid peripheral portions. Type IV displays small-cystoid, metastasis-like lesions, while Type V represents mainly calcified, inactive lesions. The right panel illustrates six distinct calcification patterns within hepatic lesions: feathery (branching), focal (isolated spots), diffuse (widespread), edge-weighted (peripheral), and central. The classification system is designed to improve diagnostic accuracy and clinical assessment of disease activity in patients with Alveolar Echinococcosis.
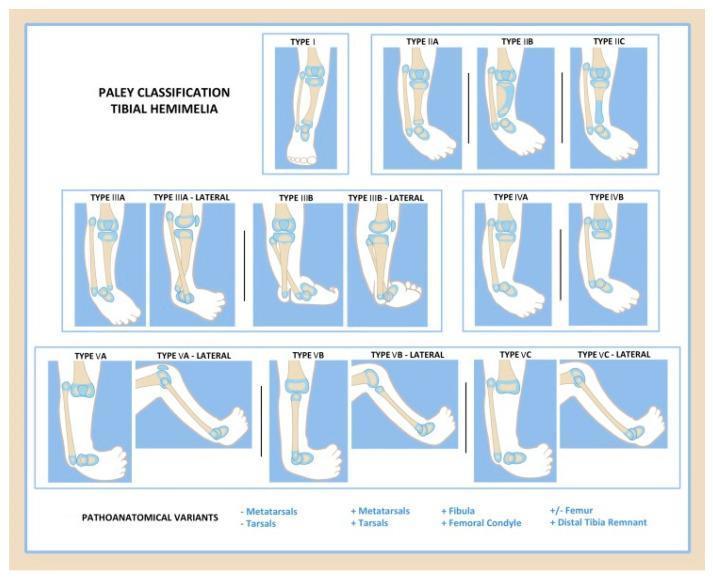
This medical illustration presents the Paley classification system for tibial hemimelia, a congenital lower limb deficiency. The diagram categorizes the condition into five primary types (I-V) based on the degree of tibial deficiency and associated joint anomalies, with several subtypes. Type I illustrates a hypoplastic but present tibia. Type II (A-C) shows various distal tibial dysplasias, including delta tibia and cartilaginous anlagen. Type III (A-B) demonstrates distal tibiofibular diastasis with a missing tibial plafond. Type IV (A-B) depicts distal tibial aplasia where only a proximal tibial remnant exists. Type V (A-C) represents complete tibial aplasia, further classified by the presence or absence of the patella and quadriceps function. Lateral views accompany several types to show the sagittal alignment of the knee and the equinovarus positioning of the foot. The illustration serves as a diagnostic and surgical planning tool for pediatric orthopedics, highlighting the relationship between the remnant tibia, the fibula, and the foot position.
iron deficiency anemia peripheral blood smear microcytic hypochromic
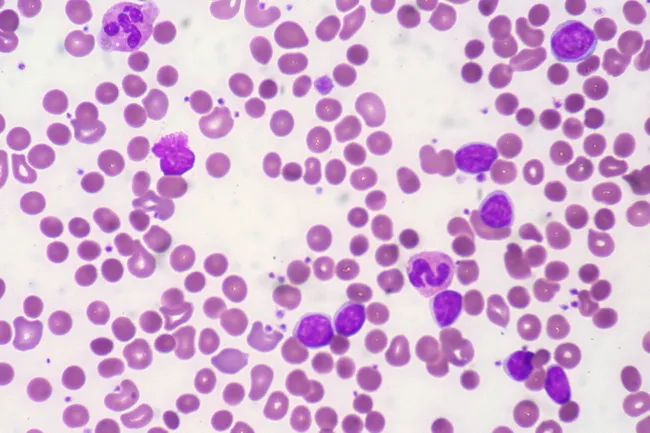
Peripheral blood smear from a patient with known chronic lymphocytic leukemia (CLL) showing autoimmune hemolytic anemia (AIHA). Brightfield microscopy of Wright-Giemsa stained smear at 1000x (oil immersion) reveals two dominant cell populations: numerous small mature lymphocytes typical of CLL and red blood cells showing spherocytic deformation. A smudge cell is evident just left of center, a classical clue for CLL. Red cells display reduced central pallor consistent with spherocytes, indicating intravascular or extravascular hemolysis driven by autoantibodies. The background shows mild polychromasia and rare nucleated RBCs, consistent with a robust reticulocyte response; the corrected reticulocyte count in this case is markedly elevated (>7%). Platelets are not significantly abnormal. These features collectively support autoimmune destruction of erythrocytes in the setting of CLL. Diagnostic significance lies in recognizing AIHA as a common autoimmune complication in CLL, with a clinical picture of sudden Hb decline and compensatory erythropoiesis. Differential considerations include drug-induced hemolysis, other causes of hemolytic anemia, or marrow infiltration by CLL. Clinical correlation includes therapy implications (steroids, rituximab) and close monitoring of hemolysis markers. This image is a valuable teaching resource for hematology morphology, AIHA in CLL, and differential diagnosis in anemia.
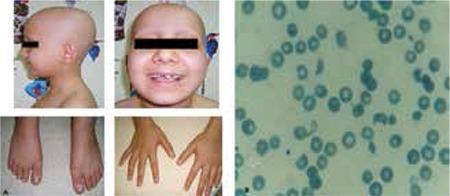
This composite image consists of clinical photographs and a diagnostic peripheral blood smear. Figure 1a (left) shows a pediatric patient with clinical signs including total alopecia (complete absence of scalp hair) and nail pitting affecting both hands and feet, characterized by small punctate depressions on the nail plates. Figure 1b (right) is a microscopic view of a peripheral blood smear demonstrating microangiopathic hemolytic anemia. Visible are numerous schistocytes—fragmented, irregular red blood cells including helmet cells and triangular forms—alongside some normal erythrocytes showing central pallor. The educational focus is on the multi-systemic manifestations of a medical condition, likely a microangiopathic process such as Hemolytic Uremic Syndrome (HUS) or similar systemic pathology, illustrating the correlation between dermatological signs (hair and nail changes) and hematological abnormalities (hemolysis and schistocytosis).
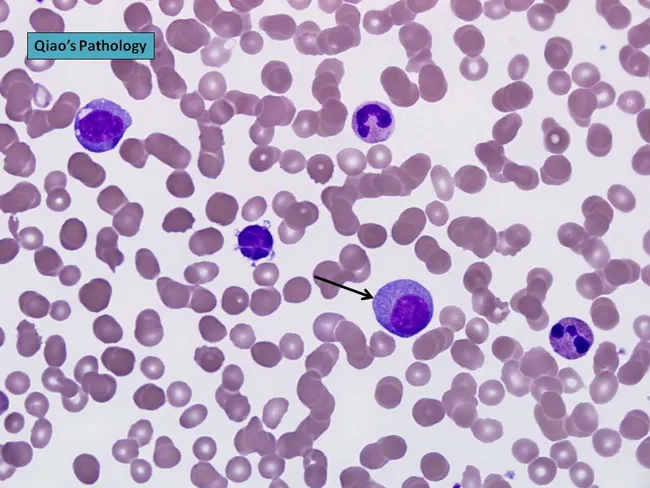
Peripheral blood smear prepared with Wright-Giemsa stain and examined under brightfield illumination using a 100× oil immersion objective reveals a single large plasma cell among a field of mature erythrocytes. The plasma cell displays features typical of clonal plasma cells: basophilic cytoplasm, an eccentrically placed round nucleus, and a conspicuous perinuclear hof; background shows rouleaux formation of red cells. This image exemplifies hematologic involvement by a plasma cell dyscrasia. In plasma cell leukemia, circulating plasma cells constitute more than 20% of leukocytes, a hallmark distinguishing it from conventional multiple myeloma, although both conditions share monoclonal plasma cell proliferation. The presence of circulating plasma cells is associated with younger patient age, higher incidence of anemia, thrombocytopenia, organomegaly, and possible lymphadenopathy; however lytic bone lesions may be less common. Immunophenotypic patterns often include lack of CD56 expression relative to myeloma. Clinically, this morphological finding warrants confirmation with complete blood count, peripheral smear review, quantitative plasma cell percentage, serum protein electrophoresis, and immunofixation to identify monoclonal immunoglobulin isotype (IgD/IgE or light-chain predominance). Early detection of circulating plasma cells supports prognosis assessment and guides therapy decisions in plasma cell dyscrasia management and monitoring, including risk stratification and treatment response evaluation for practice in clinics.
Anemia and Its Classification
Definition
- Men: < 13 g/dL
- Women: < 12 g/dL
- Pregnant women: < 11 g/dL
- Children (6 months - 6 years): < 11 g/dL
Classification of Anemia
1. Morphological Classification (by MCV)
| Category | MCV | Common Causes |
|---|---|---|
| Microcytic | < 80 fL | Iron deficiency, Thalassemia, Sideroblastic anemia, Anemia of inflammation |
| Normocytic | 80-100 fL | Aplastic anemia, Renal disease, Anemia of chronic disease (most cases), Endocrinopathies, Marrow invasion, Hemolysis (early/acute) |
| Macrocytic | > 100 fL | B12/folate deficiency, Liver disease, Hypothyroidism, Alcohol use, Myelodysplasia, Medications |
Microcytic Anemia (MCV < 80 fL)
- Iron deficiency - inability to synthesize heme; most common cause worldwide
- Thalassemia - defects in globin chain synthesis (alpha or beta)
- Sideroblastic anemia - defects in heme synthesis; iron accumulates in mitochondria of erythroblasts
- Anemia of inflammation/chronic disease - impaired iron delivery/reutilization due to hepcidin upregulation (note: can also be normocytic)
- Lead poisoning - inhibits heme synthesis enzymes
Normocytic Anemia (MCV 80-100 fL)
- Aplastic anemia
- Renal disease (EPO deficiency)
- Endocrinopathies (hypothyroidism, adrenal insufficiency, androgen deficiency)
- Anemia of chronic disease (most cases)
- Marrow infiltration (leukemia, metastases)
- Pure red cell aplasia
- Early iron deficiency
Macrocytic Anemia (MCV > 100 fL)
- Megaloblastic (oval macrocytes) - defective DNA synthesis:
- Vitamin B12 deficiency
- Folate deficiency
- Medications (methotrexate, hydroxyurea, some anticonvulsants)
- Myelodysplastic syndrome
- Non-megaloblastic (round macrocytes) - membrane/lipid abnormalities:
- Liver disease
- Alcohol use
- Hypothyroidism
- Reticulocytosis
- Hypoxia, smoking, dysproteinemia
2. Pathophysiological Classification (by Mechanism)
A. Decreased RBC Production (Hypoproliferative / Underproduction)
Reticulocyte count: LOW (inappropriately low for degree of anemia)
- Iron deficiency (hemoglobin synthesis impaired)
- Vitamin B12 / Folate deficiency (DNA synthesis impaired)
- Copper, Vitamin C deficiency
- Chronic kidney disease
- Anemia of inflammation/chronic disease
- Anemia of aging
- Aplastic anemia (acquired or congenital - e.g., Fanconi anemia)
- Pure red cell aplasia (Diamond-Blackfan syndrome, TEC)
- Parvovirus B19 infection
- Myelodysplastic syndrome
- Leukemia, lymphoma, myeloma
- Metastatic carcinoma, granulomatous disease
- Thalassemias (defective erythroblast maturation)
B. Increased RBC Destruction (Hemolysis / Hyperproduction)
Reticulocyte count: HIGH (bone marrow compensating)
i. Intrinsic (Inherited) Defects - Intracorpuscular
| Category | Examples |
|---|---|
| RBC membrane disorders | Hereditary spherocytosis, hereditary elliptocytosis |
| Enzyme deficiencies (HMP shunt) | G6PD deficiency, glutathione synthetase deficiency |
| Enzyme deficiencies (glycolytic) | Pyruvate kinase deficiency, hexokinase deficiency |
| Hemoglobin abnormalities | Sickle cell disease, unstable hemoglobins, thalassemia |
| Acquired intrinsic | Paroxysmal nocturnal hemoglobinuria (PNH) - loss of GPI-anchored proteins |
ii. Extrinsic (Acquired) Defects - Extracorpuscular
| Category | Examples |
|---|---|
| Immune-mediated | Autoimmune hemolytic anemia (warm/cold antibody), drug-induced, transfusion reactions, hemolytic disease of the newborn |
| Microangiopathic (MAHA) | TTP, HUS, DIC, malignant hypertension - schistocytes on smear |
| Mechanical/cardiac | Prosthetic heart valves, march hemoglobinuria |
| Infections | Malaria, babesiosis, Clostridium septicemia |
| Toxic/chemical injury | Snake venoms, arsenic |
| Sequestration | Hypersplenism |
C. Blood Loss
- Trauma, surgery, GI hemorrhage
- Initially normocytic/normochromic; reticulocytosis begins 3-5 days later
- Eventually leads to iron deficiency anemia (microcytic)
- GI tract lesions (peptic ulcers, colorectal cancer), gynecologic causes (menorrhagia)
Summary Table: Reticulocyte Count as Key Differentiator
| Reticulocyte Count | Mechanism | Examples |
|---|---|---|
| Low (< 1-2%) | Underproduction | Iron deficiency, B12/folate def., aplastic anemia, renal disease, anemia of inflammation |
| High (> 2-3%) | Hemolysis or blood loss | Sickle cell crisis, AIHA, spherocytosis, PNH, acute hemorrhage |
Quick Diagnostic Approach
Anemia confirmed (low Hb/Hct)
     |
     ├── MCV < 80 → Microcytic → Check iron studies, ferritin, Hb electrophoresis
     |
     ├── MCV 80-100 → Normocytic → Check reticulocyte count
     |        |
     |        ├── High reticulocyte → Hemolysis/bleeding
     |        └── Low reticulocyte → Bone marrow problem / EPO deficiency
     |
     └── MCV > 100 → Macrocytic → Check B12, folate, LFTs, TSH, peripheral smear
- Harrison's Principles of Internal Medicine, 22nd Edition (2025), p. 492 - Anemia Definition and Classification
- Robbins, Cotran & Kumar: Pathologic Basis of Disease - Table 14.1: Classification of Anemia According to Underlying Mechanism
- Goldman-Cecil Medicine - Table 144-9: Classification of Anemia by MCV
- Tintinalli's Emergency Medicine - Table 144-2: Classification of Anemia